
Single-use Plastics Prohibition Regulations: SOR/2022-138
Canada Gazette, Part II, Volume 156, Number 13
Registration
SOR/2022-138 June 20, 2022
CANADIAN ENVIRONMENTAL PROTECTION ACT, 1999
P.C. 2022-723 June 17, 2022
Whereas, pursuant to subsection 332(1)footnote a of the Canadian Environmental Protection Act, 1999footnote b, the Minister of the Environment published in the Canada Gazette, Part I, on December 25, 2021, a copy of the proposed Single-use Plastics Prohibition Regulations, substantially in the annexed form, and persons were given an opportunity to file comments with respect to the proposed Regulations or to file a notice of objection requesting that a board of review be established and stating the reasons for the objection;
Whereas, pursuant to subsection 93(3) of that Act, the National Advisory Committee has been given an opportunity to provide its advice under section 6footnote c of that Act;
And whereas, in accordance with subsection 93(4) of that Act, the Governor in Council is of the opinion that the proposed Regulations do not regulate an aspect of a substance that is regulated by or under any other Act of Parliament in a manner that provides, in the opinion of the Governor in Council, sufficient protection to the environment and human health;
Therefore, Her Excellency the Governor General in Council, on the recommendation of the Minister of the Environment and the Minister of Health, pursuant to subsection 93(1) of the Canadian Environmental Protection Act, 1999 footnote b, makes the annexed Single-use Plastics Prohibition Regulations.
Single-use Plastics Prohibition Regulations
Definitions
Definitions
1 The following definitions apply in these Regulations.
- single-use plastic checkout bag
- means a plastic manufactured item, made entirely or in part from plastic, that is formed in the shape of a bag that is designed to carry purchased goods from a business and
- (a) whose plastic is not a fabric as defined in section 2 of the Textile Labelling Act; or
- (b) whose plastic is a fabric as defined in section 2 of the Textile Labelling Act that will break or tear if the bag is
- (i) used to carry 10 kg over a distance of 53 m 100 times, or
- (ii) washed in accordance with the washing procedures specified for a single domestic wash in the International Organization for Standardization standard ISO 6330, entitled Textiles — Domestic washing and drying procedures for textile testing, as amended from time to time. (sac d’emplettes en plastique à usage unique)
- single-use plastic cutlery
- means a plastic manufactured item, made entirely or in part from plastic, that is formed in the shape of a fork, knife, spoon, spork or chopstick and that
- (a) contains polystyrene or polyethylene; or
- (b) changes its physical properties after being run through an electrically operated household dishwasher 100 times. (ustensile en plastique à usage unique)
- single-use plastic flexible straw
- means a single-use plastic straw that has a corrugated section that allows the straw to bend and maintain its position at various angles. (paille flexible en plastique à usage unique)
- single-use plastic foodservice ware
- means a plastic manufactured item, made entirely or in part from plastic, that
- (a) is formed in the shape of a clamshell container, lidded container, box, cup, plate or bowl;
- (b) is designed for serving or transporting food or beverage that is ready to be consumed; and
- (c) contains expanded polystyrene foam, extruded polystyrene foam, polyvinyl chloride, a plastic that contains a black pigment produced through the partial or incomplete combustion of hydrocarbons or an oxo-degradable plastic. (récipient alimentaire en plastique à usage unique)
- single-use plastic ring carrier
- means a plastic manufactured item, made entirely or in part from plastic, that is formed in the shape of a series of deformable rings or bands that are designed to surround beverage containers in order to carry them together. (anneaux en plastique à usage unique pour emballage de boissons)
- single-use plastic stir stick
- means a plastic manufactured item, made entirely or in part from plastic, that is designed to stir or mix beverages or to prevent a beverage from spilling from the lid of its container. (bâtonnet à mélanger en plastique à usage unique)
- single-use plastic straw
- means a plastic manufactured item, made entirely or in part from plastic, that is formed in the shape of a drinking straw and that
- (a) contains polystyrene or polyethylene; or
- (b) changes its physical properties after being run through an electrically operated household dishwasher 100 times. (paille en plastique à usage unique)
Non-application
Transit
2 (1) These Regulations do not apply in respect of plastic manufactured items referred to in section 1 that are in transit through Canada, from a place outside Canada to another place outside Canada, and are accompanied by written evidence establishing that the items are in transit.
Export
(2) Subject to sections 8 and 9, these Regulations do not apply in respect of plastic manufactured items referred to in section 1 that are manufactured, imported or sold for the purpose of export.
Waste
(3) These Regulations do not apply in respect of plastic manufactured items referred to in section 1 that are waste.
Single-use Plastic Ring Carriers
Prohibition — manufacture or import
3 (1) A person must not manufacture or import single-use plastic ring carriers.
Prohibition — sale
(2) A person must not sell single-use plastic ring carriers.
Single-use Plastic Straws
Prohibition — manufacture or import
4 A person must not manufacture or import single-use plastic straws, other than single-use plastic flexible straws.
Prohibition — sale
5 (1) Subject to subsections (2) to (6), a person must not sell single-use plastic straws.
Exception — sale in certain settings
(2) A person may sell single-use plastic flexible straws in a non-commercial, non-industrial and non-institutional setting.
Exception — business to business sales
(3) A business may sell a package of 20 or more single-use plastic flexible straws to another business.
Exception — retail sales
(4) A retail store may sell a package of 20 or more single-use plastic flexible straws to a customer if
- (a) the customer requests straws; and
- (b) the package is not displayed in a manner that permits the customer to view the package without the help of a store employee.
Exception — beverage container
(5) A retail store may sell a single-use plastic flexible straw to a customer if the straw is packaged together with a beverage container and the packaging was done at a location other than the retail store.
Exception — sale in care institutions
(6) A hospital, medical facility, long-term care facility or other care institution may sell single-use plastic flexible straws to patients or residents.
Other Plastic Manufactured Items
Prohibition — manufacture or import
6 (1) A person must not manufacture or import single-use plastic checkout bags, single-use plastic cutlery, single-use plastic foodservice ware or single-use plastic stir sticks.
Prohibition — sale
(2) A person must not sell single-use plastic checkout bags, single-use plastic cutlery, single-use plastic foodservice ware or single-use plastic stir sticks.
Analysis
Accredited laboratory
7 (1) For the purposes of these Regulations, any analysis performed to determine the physical characteristics of single-use plastic checkout bags, single-use plastic cutlery, single-use plastic flexible straws, single-use plastic foodservice ware or single-use plastic straws must be performed by a laboratory that meets the following conditions at the time of the analysis:
- (a) it is accredited
- (i) under the International Organization for Standardization standard ISO/IEC 17025, entitled General requirements for the competence of testing and calibration laboratories, by an accrediting body that is a signatory to the International Laboratory Accreditation Cooperation Mutual Recognition Arrangement, or
- (ii) under the Environment Quality Act, CQLR, c. Q-2; and
- (b) subject to subsection (2), the scope of its accreditation includes the analysis of the physical characteristics of single-use plastic checkout bags, single-use plastic cutlery, single-use plastic foodservice ware, single-use plastic flexible straws and single-use plastic straws.
Standards of good practice
(2) If no method has been recognized by a standards development organization in respect of the analysis performed to determine the physical characteristics of the plastic manufactured items referred to in subsection (1) and the scope of the laboratory’s accreditation does not therefore include that analysis, the analysis must be performed in accordance with standards of good scientific practice that are generally accepted at the time that it is performed.
Record Keeping
Records — export
8 Any person that manufactures for the purpose of export, or that imports for the purpose of export, a plastic manufactured item to which these Regulations apply must keep records containing the following information and documents for each type of plastic manufactured item that was manufactured for the purpose of export or imported for the purpose of export:
- (a) in the case of a person that manufactures for the purpose of export,
- (i) the common or generic name and the trade name, if any, of the item,
- (ii) the quantity of the item manufactured at each manufacturing facility,
- (iii) the date of manufacture of the item,
- (iv) the date the item was exported and the quantity exported or, if it has not yet been exported, the date on which it is intended to be exported and the quantity intended to be exported, and
- (v) the name of the entity, if any, to which the item is sold in Canada for subsequent export; and
- (b) in the case of a person that imports for the purpose of export,
- (i) the common or generic name and the trade name, if any, of the item,
- (ii) the quantity imported of the item,
- (iii) the date the item was imported,
- (iv) the copies of the bill of lading, invoice and all documents submitted to the Canada Border Services Agency respecting the importation of the item,
- (v) the date the item was exported and the quantity exported or, if it has not yet been exported, the date on which it is intended to be exported and the quantity intended to be exported, and
- (vi) the name of the entity, if any, to which the item is sold in Canada for subsequent export.
Retention of records
9 (1) A person that is required to keep records under section 8 must keep the records at the person’s principal place of business in Canada or at any other place in Canada where they can be inspected, for at least five years after the date on which they are made. If the records are not kept at the person’s principal place of business, the person must provide the Minister with the civic address of the place where they are kept.
Records moved
(2) If the records are moved, the person must notify the Minister in writing of the civic address in Canada of the new location within 30 days after the day of the move.
Amendments to these Regulations
10 Subsection 2(2) of these Regulations is repealed.
11 Subsection 5(5) of these Regulations is repealed.
Related Amendment to the Regulations Designating Regulatory Provisions for Purposes of Enforcement (Canadian Environmental Protection Act, 1999)
| Item | Column 1 Regulations |
Column 2 Provisions |
|---|---|---|
| 38 | Single-use Plastics Prohibition Regulations |
|
Coming into Force
Six months after registration
13 (1) Subject to subsections (2) to (5), these Regulations come into force on the day that, in the sixth month after the month in which they are registered, has the same calendar number as the day on which they are registered or, if that sixth month has no day with that number, the last day of that sixth month.
One year after registration
(2) Subsection 3(1) comes into force on the first anniversary of the day on which these Regulations are registered.
Eighteen months after registration
(3) Section 5 and subsection 6(2) come into force on the day that, in the 18th month after the month in which these Regulations are registered, has the same calendar number as the day on which they are registered or, if that 18th month has no day with that number, the last day of that 18th month.
Two years after registration
(4) Subsection 3(2) and section 11 come into force on the second anniversary of the day on which these Regulations are registered.
Forty-two months after registration
(5) Section 10 comes into force on the day that, in the 42nd month after the month in which these Regulations are registered, has the same calendar number as the day on which they are registered or, if that 42nd month has no day with that number, the last day of that 42nd month.
REGULATORY IMPACT ANALYSIS STATEMENT
(This statement is not part of the Regulations.)
Executive summary
Issues: Current scientific evidence indicates that macroplastic pollution poses an ecological hazard, including physical harm, to some animals and their habitat. Canadians use substantial quantities of single-use plastic manufactured items (SUPs) every year. These SUPs are designed to be discarded once their single use has been fulfilled. A share of that waste becomes plastic pollution. Action is needed to restrict or eliminate SUPs that pose a threat of harm to the environment.
Description: The Single-Use Plastics Prohibition Regulations (the Regulations) will prohibit the manufacture, import and sale (including for the purpose of export) of six categories of SUPs (i.e., checkout bags, cutlery, foodservice ware made from or containing problematic plastics, ring carriers, stir sticks and straws), with a temporary exemption for export. The Regulations also provide exemptions for SUP flexible straws to accommodate persons with disabilities. Since SUP checkout bags, SUP cutlery and SUP straws have reusable substitutes made of plastics, the Regulations identify performance standards to differentiate between single-use and reusable items for these three product categories.
For SUP checkout bags, SUP cutlery, SUP foodservice ware made from or containing problematic plastics, SUP stir sticks, and SUP straws, the prohibitions on manufacture and import will come into force six months after the Regulations are registered. The prohibition on sale for these items will come into force 18 months after the Regulations are registered. SUP flexible straws will not be subject to the prohibition on manufacture and import as there is a need to ensure supply of these items for people who need them, but their sale will be subject to special rules that will come into force 18 months after registration. The prohibition on the manufacture and import of SUP ring carriers will come into force 12 months after the Regulations are registered. The prohibition on sale for SUP ring carriers, as well as the repeal of a temporary exemption on the sale of SUP flexible straws packaged together with beverage containers, will come into force 24 months after the Regulations are registered. The Regulations will also repeal the temporary exemption on manufacture, import and sale for the purposes of export for all categories of SUPs 42 months after the Regulations are registered.
Rationale: Plastics are among the most universally used materials in modern society. Single-use consumer items are the most commonly collected items in litter clean-ups, with plastic being the most common material recovered in both domestic and international clean-up efforts. The six categories of SUPs subject to the Regulations represented an estimated 150 000 tonnes sold in 2019 or an estimated 3% of the total plastic waste generated in Canada in 2019.
The Regulations support the federal, provincial, and territorial governments’ Strategy on Zero Plastic Waste (PDF). Several provincial, territorial and municipal jurisdictions have already enacted prohibitions or standards for certain SUPs. On October 7, 2020, the Department of the Environment (the Department) published a discussion paper on the Canadian Environmental Protection Act Registryfootnote 2 outlining a proposed integrated management approach to plastic products to prevent waste and pollution. During the ensuing 60-day public comment period, the Department received 205 written submissions representing the views of 245 stakeholder groups (151 industry members; 39 provincial, territorial, or municipal governments; two Indigenous groups; 32 non-governmental organizations; and 21 other groups such as think tanks, health advocacy and taxpayer groups). In addition, the Department received over 24 000 emails from individual Canadians, as well as an online petition started by a civil society group that received over 100 000 signatures indicating support for government action.
The proposed Regulations were published in Canada Gazette, Part I on December 25, 2021, followed by a 70-day public consultation period. During this consultation period, stakeholders and members of the public were given an opportunity to provide the Department with written comments on the proposed Regulations. The Department received 146 written submissions (75 industry members; 22 provincial, territorial or municipal governments; one Indigenous group; 29 non-governmental organizations (NGOs); and 19 others). The Department also received 25 notices of objection on the proposed Regulations and requests to establish a board of review to inquire into the nature and extent of the danger posed by one or more of the six categories of SUPs targeted by the Regulations. The Minister of the Environment has declined to form a board of review. All notices of objection, along with the Minister’s response letters, are available on the CEPA Registry.
Overall, NGOs and local governments have expressed support for the Regulations while resin producers and plastic product manufacturers have raised concerns. Other industry stakeholders have begun transitioning away from using SUPs or have announced their intention to do so. Support for the Regulations from provincial and territorial governments has been mixed.
In addition to written comments, the Government held online meetings with stakeholders to answer questions and receive feedback. As of March 11, 2022, a total of 48 online meetings with stakeholders took place, including 27 businesses, 12 industry associations and their members, four environmental non-governmental organizations, four municipal and provincial governments, and the Federation of Canadian Municipalities. In addition, the Department met with all provinces and territories via the Canadian Council of Ministers of the Environment. Many meetings involved multiple stakeholders and included representatives from Health Canada. During these meetings, stakeholders were given opportunities to pose questions and provide feedback. A survey was also sent to a large number of manufacturers across Canada seeking input on the impacts to the manufacturing sector, with 12 responses received.
The Regulations are expected to result in a net decrease of approximately 1.3 million tonnes in plastic waste over the 10-year analytical period (2023 to 2032), which represents around 3% of the total estimated plastic wastefootnote 3 generated in Canada each year. They are also expected to result in a decrease of around 22 000 tonnes in plastic pollutionfootnote 4 over the same period, which represents around 5% of the total plastic pollution generated each year. The Regulations are expected to result in $2 billion in present value costs over the analytical period, stemming mainly from substitution costs. While these costs are significant in aggregate, they will be widely dispersed across Canadian consumers (around $5 per capita per year). The prohibitions on manufacture of the six categories of SUPs are also expected to result in $176 million in costs to Canadian manufacturers over the analytical period.
By reducing plastic pollution, the Regulations are also expected to reduce the risk of ecological harm to wildlife and their habitats, as well as increase Canadians’ enjoyment of nature. While these benefits are not monetized in this analysis, they are expected to be significant, given the harms associated with plastic pollution. The analysis did monetize benefits associated with avoided costs for terrestrial litter clean-up and avoided marine plastic pollution ($616 million in present value monetized benefits over the analytical period).
Issues
The Canadian economy generates large amounts of plastic waste every year, of which a certain proportion enters the environment as plastic pollution. Current scientific evidence indicates that macroplastic pollution causes physical harm to wildlife on an individual level and has the potential to adversely affect habitat integrity. Single-use plastic manufactured items (SUPs) are significant contributors to plastic pollution, as they are designed to be discarded once their single use has been fulfilled. Preventing pollution and waste is an important shared jurisdiction among all levels of government in Canada, and plastic pollution is an issue with national and international dimensions that cannot be effectively eliminated through provincial, territorial, or local measures alone. Therefore, the Minister of the Environment and the Minister of Health (the Ministers), in accordance with section 93 of the Canadian Environmental Protection Act, 1999 (CEPA or “the Act”), recommended that the Governor in Council eliminate or restrict six categories of SUPs subject to the Regulations. These categories of SUPs are the following: checkout bags, cutlery, foodservice ware made from or containing problematic plastics, ring carriers, stir sticks, and straws (hereafter referred to as the “six categories of SUPs”).
Background
Lifecycle of plastic manufactured items in the Canadian economy
Plastics are among the most universally used material in modern society. Plastics are low-cost, durable and are used in a wide range of applications, such as packaging, construction materials, automotive materials, electronics, textiles, and medical equipment. Plastics can be created from a wide range of synthetic, or semi-synthetic organic compounds and are formed from long-chain polymers of high molecular mass that often contain chemical additives. Different polymers can be manufactured using different compositions of petroleum products, plant-based starting material, or recycled and recovered plastics. Plastic manufactured items can be formed into a specific physical shape, or design during manufacture and serve many different functions. They can include final products, as well as components of products. The scientific literature often categorizes plastic pollution by size, in an environmental context. Individual pieces of plastic that are less than or equal to 5 millimetres (mm) in size are referred to as microplastics, while those that are greater than 5 mm in size are referred to as macroplastics. Microplastics can be “primary microplastics” (intentionally produced micro-sized plastic particles), or “secondary microplastics” (micro-sized plastic particles resulting from the breakdown of larger plastic manufactured items).
The proper management of plastic manufactured items is a global issue as millions of tonnes of plastics are produced each year around the world and because plastic pollution entering the oceans is transported long distances to other parts of the globe. It is estimated that half of the plastics produced each year are for single-use items.footnote 5 In 2020, 367 million tonnes of plastic were produced globally, a 0.3% decrease from 2019.footnote 6 The COVID-19 pandemic significantly altered economic activity and demand patterns, in some cases increasing consumption of SUPs (e.g., supplied with restaurant takeout) and plastic packaging (due to the growth of e-commerce). It has also reduced plastic consumption in other economic sectors such as wholesale and retail trade, motor vehicle manufacture, and construction.footnote 7
In order to better understand the quantities, uses, and end-of-life management of plastics in the Canadian economy, the Department of the Environment (the Department) commissioned the Economic Study of the Canadian Plastic Industry, Markets and Waste (the 2019 Deloitte Study). This study published in 2019 presented the first detailed characterization of physical flow of plastic material in the Canadian economy. Building on and refining this work, Statistics Canada has since released its physical flow account for plastic material, which describes the production and fate of plastic in the Canadian economy.
Statistics Canada estimated that approximately 6.3 million tonnes of plastic resins (raw materials) were introduced to the domestic market in 2018 while approximately 4.4 million tonnes of plastic manufactured items became plastic waste. The packaging sector alone accounted for 50% (approximately 2.2 million tonnes) of all plastic waste generated, as the vast majority of packaging is designed to become waste after fulfilling a single-use. Of the 4.4 million tonnes of plastic waste generated nationally in 2018, 3.9 million tonnes (87%) were landfilled or incinerated without energy recovery, 365 000 tonnes (8%) were recycled, 149,000 tonnes (4%) were incinerated with energy recovery, and 43 000 tonnes (1%) became plastic pollution. Using those numbers, Canadians produced around one kilogram of plastic pollution per capita in 2018.
These figures support findings of the 2019 Deloitte Study that the Canadian plastics economy is mostly linear, as opposed to circular. Under a linear economy, plastic manufactured items follow a unidirectional path: production from mostly virgin (as opposed to recycled) materials, usage (until no longer deemed useful) and then disposal into the waste stream, mostly for landfill. Put another way, most plastic manufactured items in a linear economy are produced from virgin resins, and their value is not recovered at the end of their useful life. Therefore, most of the plastic waste generated in Canada enters landfills and exits the economy, representing a significant lost potential economic opportunity.
By contrast, a circular economy is a model of production and consumption that recovers and restores products, components, and materials through strategies like reuse, repair, remanufacture or (as a last resort) recycling.footnote 8 Under a circular economy, plastic manufactured items are produced by a number of different pathways, one of which includes using recycled resins. Their values are recovered at the end of their useful life to be reintegrated into the economy. In this way, the end of the value chain for one manufactured item becomes the start of the value chain for another, thereby extending life cycles and reducing waste.
There are many factors contributing to the linear nature of the plastics economy in Canada, including the following:
- virgin and recycled plastic resins compete: competition is difficult for the recycling industry because of inconsistent feedstock composition and a more labour-intensive cost structure compared to virgin resin production, which can take advantage of economies of scale;
- weak end-markets for recycled plastics: in some cases, recycled resins are a cheaper substitute for product manufacturers, but the inconsistent supply of quality feedstock at a competitive price undermines the establishment of viable and lasting end-markets;
- collection rates are low: only 25% of plastics are collected and sent to a sorting facility in Canada, according to the 2019 Deloitte Study (through curbside collection, recycling depots, or deposit-refund systems), while only around a third of collected plastics are effectively recycled because of contamination, infrastructure deficiencies and lack of end-markets;
- insufficient recovery options: current near absence of high-volume recovery options, losses from existing processes and competition from low-cost disposal substitutes, such as landfills, point to the need for investments in innovation and infrastructure, in particular to commercialize and scale up new technologies; and
- cost of plastic pollution is shouldered by individuals and communities: the responsibility for preventing and managing land-based sources of plastic pollution, such as urban and roadside litter, is largely shouldered by municipalities, civil society organizations and volunteers, at a great cost.
The 2019 Deloitte Study estimated that 2 500 tonnes of the plastic waste generated in Canada in 2016 entered the oceans as plastic pollution, while no estimates of the amount of plastic pollution entering Canadian freshwaters (e.g., the Great Lakes, other lakes, rivers) but never reach the oceans currently exists. Internationally, academic studies have estimated the total amount of plastic pollution entering oceans globally at between 8 million tonnes and 13 million tonnes per year.footnote 9 In fact, plastics constitute the most prevalent type of litter found in the oceans, estimated to make up at least 80% of total marine debris (from surface waters to deep-sea sediments), plastic bags being among the most prevalent littered items.footnote 10
The 2019 Deloitte Study indicates that one of the key pathways for plastic waste to become terrestrial or marine plastic pollution is people dropping litter on the ground or directly into aquatic environments. An estimated 80% of all marine plastic pollution originates on land and is transported to the ocean via wind or rivers, with the remaining 20% attributable to fishing activities, natural disasters, and other sources.footnote 11 Once plastic pollution reaches oceans, the majority will slowly weather and fragment into microplastics, accumulate on shorelines, sink to the seabed, or float on the sea surface, but will never fully decompose.
Plastic pollution is found on the shorelines of every continent, with greater proliferation typically found near tourist destinations and densely populated areas. Large-scale marine and freshwater litter clean-ups are very costly, and therefore, limited in practice. While such clean-ups may result in temporary benefits, they do not alter the inflow of plastic pollution into marine or freshwater environments, and must therefore be frequently repeated for sustained benefits to be realized. For this reason, preventing plastic pollution from entering the environment in the first place is often seen as the only viable approach to successfully managing the issue of marine plastic pollution on a long-term basis.footnote 11
Science Assessment of Plastic Pollution
In October 2020, the Department of the Environment and the Department of Health published a Science Assessment of Plastic Pollution (the Science Assessment) on the Canada.ca (Chemical Substances) website. The intent of the Science Assessment was to summarize the current state of the science regarding the potential impacts of plastic pollution on the environment and human health, as well as to inform future decision-making on plastic pollution in Canada. The Science Assessment found that macroplastic and microplastic pollution are ubiquitous in the environment. The Science Assessment also found that many sources of release contribute to plastic pollution, and that the potential effects of microplastics on individual animals, the environment, and human health are unclear and require more research.
With respect to macroplastic pollution, the Science Assessment found evidence of adverse effects, including mortality, to some animals through:
- entanglement, which can lead to suffocation, strangulation, or smothering;
- ingestion, which can block airways or intestinal systems leading to suffocation or starvation; and
- transport of invasive species into well-established ecosystems or transport of diseases that can alter the genetic diversity of an ecosystem when they use the plastic pollution as a vessel for rafting.
Overall, the Science Assessment recommended pursuing immediate action to reduce the presence of plastic pollution in the environment, in accordance with the precautionary principle as defined in section 2 of CEPA.
Government action on plastic waste and plastic pollution
The Government of Canada has committed to taking action to reduce plastic waste and plastic pollution through several avenues. In November 2018, through the Canadian Council of Ministers of the Environment, the federal, provincial and territorial governments approved, in principle, a Canada-wide Strategy on Zero Plastic Waste (PDF)(the Strategy). The Strategy takes a circular economy approach to plastics and provides a framework for action in Canada. Federal, provincial and territorial governments are collaborating to implement the Action Plan on Zero Plastic Waste (the Action Plan), for which Phase 1 (PDF) and Phase 2 (PDF) were approved in 2019 and 2020, respectively.
In October 2020, the Government published a discussion paper entitled A proposed integrated management approach to plastic products to prevent waste and pollution (the Discussion Paper). The Discussion Paper outlined a proposed integrated management approach that addresses the entire life cycle of plastics to prevent plastic waste and plastic pollution. The Government described a suite of measures to be developed under CEPA to implement the integrated management approach, which seeks to:
- manage single-use plastics using a management framework;
- establish performance standards for plastic products to reduce (or eliminate) their environmental impact and stimulate demand for recycled plastics; and
- ensure end-of-life responsibility, so that companies that manufacture or import plastic products or sell items with plastic packaging are responsible for collecting and recycling them.
Based on the findings of the Science Assessment and other available information, the Ministers were satisfied that plastic manufactured items met the ecological criterion for a toxic substance as set out in paragraph 64(a) of CEPA. In order to develop risk management measures under CEPA to address the potential ecological risks associated with certain plastic manufactured items becoming plastic pollution, the Administrator in Council made an Order adding plastic manufactured items to Schedule 1 to CEPA, which was published in the Canada Gazette, Part II, on May 12, 2021. The listing enables the Ministers to propose risk management measures under CEPA that could target the sources of plastic pollution and change behaviour at key stages in the life cycle of plastic products, such as product design, manufacture, use, disposal, and value recovery.
Most prevalent items contributing to plastic pollution
Internationally, single-use consumer items are the most commonly picked up items in litter clean-ups, with plastic being the most common material recovered. Most of the top 10 items reported in the Ocean Conservancy International Coastal Cleanup 2020 report (in which Canada participated) were made out of or contained plastics. These items included food wrappers, cigarette filters, plastic beverage bottles, other unspecified trash, plastic bottle caps, plastic grocery bags, straws, stir sticks, and plastic take-out containers. Similarly, data based on total items collected over time from the European Environment Agencyfootnote 12 shows that the most common category of items found as marine litter on the beach are cigarette filters, plastic caps and drink lids, shopping bags, string and cord, food wrappers, cotton bud sticks, drink bottles, and food containers. On a per material basis, plastic was found to account for 87% of all materials collected over time.footnote 13
Domestically, the Great Canadian Shoreline Cleanup has also typically found cigarette filters, food wrappers, bottle caps, plastic bags, plastic bottles, and straws among its 10 most commonly collected litter items. While quantities collected in the Great Canadian Shoreline Cleanup were lower in 2020, mainly due to COVID-19 limiting participation, the quantity collected in 2019 represented almost double the quantity for 2017 by weight. Other plastic items commonly found in shoreline clean-ups include cutlery, ring carriers, cups, pieces of foam and plastic fragments, and personal hygiene products.
Despite differences in the number of items recovered in each item category, some item categories are considered more environmentally problematic, as more harmful to wildlife or the environment in general based on material, weight and shape, or structure. Of common consumer items made of plastic, plastic bags pose one of the greatest impacts on marine wildlife.footnote 14 Plastic bags are lightweight and usually have looped handles that can entangle wildlife. Ring carriers can also pose a threat of entanglement due to their looped structure. Plastic bags and utensils have been rated the plastic items of greatest risk for ingestion by seabirds, turtles, and marine mammals.footnote 14 Many of the consumer items frequently picked up in litter clean-ups are also considered to be value recovery problematic as they are made of problematic plastics that have very low recycling rates.
Government action with respect to single-use plastic manufactured items
In June 2019, the Prime Minister announced a commitment for the Government of Canada to take steps to reduce plastic waste and plastic pollution, including working with provinces and territories to introduce standards and targets that would make companies that manufacture plastic products or that sell items with plastic packaging responsible for their plastic waste. In the same announcement, the Prime Minister committed the Government of Canada to banning harmful SUPs as early as 2021, where warranted and supported by scientific evidence. This commitment was reconfirmed in the 2019 Mandate Letter and the 2021 Mandate Letter to the Minister of the Environment (the Minister), as well as in the Speech from the Throne in September 2020.
In order to determine which SUPs are considered harmful and warrant prohibition in Canada, the Department developed a management framework for categorizing SUPs (the Framework), as presented in the Discussion Paper. The Framework categorized a wide selection of SUPs commonly collected as litter or flagged by other jurisdictions (e.g. different types of bags, different types of packaging, cigarette filters, coffee pods) as either environmentally problematic, value-recovery problematic, or both. The Science Assessment provides the justification to take action. As outlined in the Discussion Paper, further consideration was given to which SUPs should be included in the Regulations. The SUPs that were selected for the ban must meet the environmentally problematic and value-recovery problematic criteria using scientific evidence to assess environmental prevalence and value recovery challenges, with consideration for exemptions for certain essential functions. After evaluating the wide selection of SUPs in this way, the Framework identified six harmful SUPs, or categories of SUPs identified by utility, warranted for prohibition or restriction in Canada.
Checkout bags. Also known as shopping bags, grocery bags, or carryout bags. These items are typically given to customers at the retail point of sale to carry purchased goods from a business. They are typically (but not exclusively) made from high- or low-density polyethylene film and may, or may not have handles. SUP checkout bags have low recycling rates (estimated at less than 15%) despite being accepted in several recycling programs across Canada and are known to hamper recycling systems by becoming caught up in sorting and processing machinery. They are some of the most common forms of plastic litter in the natural environment (e.g., 31 164 units were collected from Canadian shorelines in 2019 through the Great Canadian Shoreline Cleanup). Checkout bags have been identified by experts as posing a threat of entanglement, ingestion and habitat disruption for marine wildlife;
Cutlery (knives, forks, spoons, sporks and chopsticks). These items are typically given to customers by restaurants and other food vendors to eat quick-service, or takeout food, though they can also be purchased in bulk at many retail businesses such as grocery, or dollar stores. They are typically (but not exclusively) made from polypropylene or polystyrene. SUP cutlery has low recycling rates (estimated at close to 0%) and is typically not accepted in provincial or municipal recycling systems. It is a common form of plastic litter (e.g., 10 772 units were collected from Canadian shorelines in 2019 through the Great Canadian Shoreline Cleanup). Cutlery litter has been ranked as a threat to wildlife because it is frequently encountered in the environment, carries food residues that encourage ingestion, and has rigid properties that make it hazardous harmful (e.g., by perforating organs) once eatenfootnote 15;
Foodservice ware made from, or containing problematic plastics. This category includes clamshell containers, lidded containers, cartons, cups, plates and bowls used for serving or transporting prepared food or beverages (i.e. that is ready to be consumed without any further preparation, such as cooking, boiling or heating). This category of SUPs only includes those made from problematic plastics, which are defined as extruded or expanded polystyrene foam, polyvinyl chloride, oxo-degradable plastics, or plastics that contain the additive “carbon black.” When littered in the environment, foodservice ware may be placed in a range of categories, depending on the kind of plastic used (e.g. expected to form part of the total units collected under the categories of foam [24 213 units], food wrappers/containers [74 224 units], or tiny pieces of plastic or foam [595 227 units] in the 2019 Great Canadian Shoreline Cleanup). Foodservice ware in the form of expanded polystyrene containers, takeout containers, cups and plates and plastic food lids have all been ranked as high by experts in terms of the threat posed to wildlife due to contamination and, for polystyrene foam, ingestion;
Ring carriers (typically known as six-pack rings). Ring carriers are deformable bands that are placed on beverage containers (e.g., cans, bottles) to package them for transport. They can be cut to hold different multiples of containers (e.g., two-packs, eight-packs). They are typically made from low-density polyethylene. Ring carriers are not typically recycled in Canada and are not accepted by provincial or municipal recycling systems. Ring carriers are a common form of plastic litter (e.g. 1 627 units collected from Canadian shorelines in 2019 through the Great Canadian Shoreline Cleanup) and are recognized as posing a threat of entanglement for wildlife such as seabirds;
Stir sticks (also known as stirrers or beverage stirrers). Stir sticks are typically made from polypropylene or polystyrene. They can be in the shape of a stick, rod, or tube, and can also have decorative elements (e.g., for cocktail stir sticks or muddlers) or have attachments to close coffee cup lids. They have very low or no recycling rates and are not typically accepted in provincial or municipal recycling systems. Stir sticks are found as litter in the environment. They are typically categorized alongside straws (e.g., stir sticks form part of the 26 157 units collected in 2019 through the Great Canadian Shoreline Cleanup referenced below for straws). Stir sticks pose the same threats to wildlife as straws; and
Straws. Straws are typically given to customers at restaurants, coffee shops, and other food vendors along with purchased drinks. They are typically (but not exclusively) made from polypropylene and have varying physical dimensions. They may also be sold in packages of multiple straws at retail locations such as grocery stores and dollar stores or may be packaged with another product (e.g., a juice box). Plastic straws are prevalent in litter data (e.g., 26 157 units of straws and stir sticks collected in Canada in 2019 through the Great Canadian Shoreline Cleanup). They have low or nil recycling rates due to their size and shape and are not typically accepted in provincial or municipal recycling systems. Straws are also ranked high by experts in terms of the threat posed to wildlife in the environment. They pose a threat of harm through ingestion (e.g., perforating organs).
Provincial, territorial and municipal actions on SUPs
Several municipal and provincial jurisdictions have already implemented bans on a selection of these six categories of SUPs. For example, in 2019, Prince Edward Island implemented bans on SUP checkout bags, and in 2020, Newfoundland and Labrador also implemented bans on SUP checkout bags. The bans permit businesses to offer paper and reusable checkout bags. Only Prince Edward Island mandates minimum fees for offering substitute checkout bags. All three of these bans also prohibit compostable and oxo-degradable SUP checkout bags and include various exemptions. In May of 2021, Yukon’s Speech from the Throne signalled the territory’s intention to ban SUPs and as of January 2022, all SUP shopping bags are banned in the territory. As of February 2022, no other SUP bans have been enacted at the provincial or territorial level, although British Columbia published a framework to facilitate municipal bans and amended its environmental protection legislation to allow it to develop province-wide bans.footnote 16 Numerous municipal governments have implemented SUP bans on a local level. For instance, Vancouver, Montréal, Sherbrooke, and several smaller municipalities across Canada have implemented bans on SUP checkout bags. Edmonton recently announced plans to regulate single-use shopping bags, polystyrene foam foodservice ware, utensils, straws, single-use cups, prepackaged condiments, and napkins.
Select Canadian market characteristics
According to the 2019 Deloitte Study, Canadian plastic product manufacturing (including SUPs and durable goods) accounted for $25 billion in sales in 2017. The study estimated that plastics manufacturing establishments were mainly located in Ontario (44%), Quebec (28%), British Columbia (11%), and Alberta (8%). Information from Statistics Canada indicates that domestic plastics manufacturers met approximately 50% of domestic demand, while imports met the remaining 50%.footnote 17 It is estimated that the United States receives 90% of Canadian exports, and provides over 60% of Canadian imports.
Distribution among the six categories of SUPs
As shown in Table 1, the six categories of SUPs accounted for approximately $760 million in sales in 2019 or nearly 30 billion units sold. Per capita per day, these values translate to approximately $0.06 in sales and 2.2 units sold. Assuming that each unit sold fulfilled its single use in short order following its sale, the mass of each unit sold promptly became plastic waste. Based on this assumption, the six categories of SUPs generated approximately 150 000 tonnes of plastic waste, representing roughly 4% of the total plastic waste generated in Canada in 2019.footnote 18
| Category of SUP table b1 note b | Sales volume (in millions of units) |
Average annual growth (2015 to 2019, by volume) | Unit price (2021 dollars) | Value (in millions, 2021 dollars) |
Unit weight (grams) | Tonnage |
|---|---|---|---|---|---|---|
| SUP checkout bags | 15 593 | 2.5% | $0.03 | $429 | 8 | 124 746 |
| SUP cutlery | 4 612 | 2.0% | $0.04 | $170 | 2.4 | 11 112 |
| SUP foodservice ware made from or containing problematic plastics table b1 note d | 469 | 0.9% | $0.09 | $43 | 19.0 | 8 685 |
| SUP ring carriers | 183 | 1.9% | $0.03 | $6 | 3.5 | 648 |
| SUP stir sticks | 2 950 | 3.1% | $0.01 | $31 | 0.6 | 1 770 |
| SUP straws | 5 846 | 2.7% | $0.01 | $81 | 0.4 | 2 339 |
| Total (or weighted average) table b1 note c | 29 654 | 2.5% | $0.03 | $760 | 5.0 | 149 300 |
Table b1 note(s)
|
||||||
Significant progress has been made in recent years by governments and industry globally to phase out several commonly identified SUPs, especially SUP checkout bags, as described in the Global Commitment 2021 Progress Report published by the Ellen MacArthur Foundation and the United Nations Environment Programme (UNEP). In Canada, some major companies have announced or have already implemented actions to reduce certain SUPs. For example, several companies in the quick-service restaurant industryfootnote 19,footnote 20,footnote 21 have already eliminated SUP straws and other SUPs in their Canadian establishments. Some full-service restaurants have also committed to eliminating all SUP straws from their restaurants.footnote 22 In the retail space, many grocery chains and other retailers have eliminated or have committed to eliminating SUP checkout bags from their stores.footnote 23,footnote 24,footnote 25 Despite the voluntary actions of some Canadian companies to reduce plastic waste in their establishments, consumption of the six categories of SUPs nationally is projected to grow at a positive rate for the next decade and beyond in the absence of regulatory intervention.
Substitutes to the six categories of SUPs
Substitutes for the six categories of SUPs exist and are readily available within established markets in Canada. Many of these substitutes are single-use manufactured items that are not made from plastics (single-use non-plastic manufactured items, or SUNPs). Most SUNPs are made from paper or wood, and as such, are typically heavier and costlier than their SUP counterparts. Regardless, SUNPs have become more prevalent in the market over time, as consumer preference for a substitute to SUPs grows with increased awareness of the impacts of plastic waste and plastic pollution. In the case of SUP foodservice ware made from or containing problematic plastics and SUP ring carriers, substitutes exist that are also plastic manufactured items, but which do not pose the same environmental or value-recovery challenges. The estimated year-over-year market growth of most substitutes for the six categories of SUPs is higher than that of their SUP counterparts. As shown in Table 2, the average annual growth rate from 2015 to 2019 across a selection of readily available single-use substitutes to the six categories of SUPs was 4.7%.
| Category of SUP | Readily available single-use substitute material | Sales volume (in millions of units) |
Average annual growth (2015 to 2019, by volume) | Unit price (2021 dollars) | Value (in millions, 2021 dollars) |
Unit weight (grams) | Tonnage |
|---|---|---|---|---|---|---|---|
| SUP checkout bags | paper | 3 709 | 4.8% | $0.08 | $292 | 52.6 | 214 562 |
| SUP cutlery | wood | 1 115 | 2.8% | $0.09 | $100 | 1.5 | 1 680 |
| SUP foodservice ware made from or containing problematic plastics | paper and moulded fibre | 486 | 2.0% | $0.16 | $78 | 39.1 | 18 744 |
| aluminum | 238 | 0.3% | $0.14 | $33 | 9.5 | 2 262 | |
| SUP foodservice ware made from or containing problematic plastics table b2 note d | recyclable plastics | 483 | 3.5% | $0.11 | $51 | 24 | 11 598 |
| SUP ring carriers | paper and moulded fibre | 127 | 2.7% | $0.30 | $39 | 27.6 | 3 502 |
| recyclable plastics | 53 | 1.6% | $0.14 | $8 | 19.5 | 1 034 | |
| plastic film table b2 note b | - | - | $0.06 | - | 18 | - | |
| SUP stir sticks | wood | 1 022 | 3.8% | $0.01 | $13 | 1.9 | 1 941 |
| SUP straws | paper | 744 | 13.0% | $0.03 | $21 | 0.8 | 595 |
| Total (or weighted average) table b2 note c | 7 976 | 4.7% | $0.08 | $634 | 29.7 | 255 918 | |
Table b2 note(s)
|
|||||||
Other substitutes to the six categories of SUPs are reusable manufactured items, made from a variety of materials including durable plastics, metals, woods, glass, silicone, and fabrics. Unlike single-use items, reusable items are specifically designed to remain durable through repeated uses and machine washings. Reusable items are typically heavier and costlier than their SUP, or SUNP counterparts, given their need for durability and associated quantity of raw material needed for their production. However, since a reusable item can be used multiple times, it essentially replaces a stream of single-use items over its useful lifetime, and if durable enough will eventually “meet or beat” the total cost of the stream of single-use items it diverted over time. How long it takes to break even depends on the price of the reusable item, the price of the single-use items it diverted, and the rate and duration of reuse.
With respect to the six categories of SUPs, the most commonly used reusable substitute is reusable checkout bags. Many Canadians have shifted their consumer behaviour to normalize bringing reusable checkout bags to a variety of retail settings, especially grocery stores. Some retail locations also sell reusable checkout bags at their checkout counters. Substituting reusable checkout bags for SUP checkout bags is more common in Canada than using substitutes for the five other categories of SUPs. For example, it is not yet common for consumers to bring reusable foodservice ware and reusable cutlery to collect and consume take-out food. Accordingly, reusable items are not seen to play as significant a role in diverting the consumption of five of the six categories of SUPs in the short term, relative to the role that SUNP and other single-use substitute items play in that regard. However, as ongoing education campaigns by governments and civil society groups increase awareness of waste and pollution caused by the consumption of single-use items, adoption of low-waste consumer behaviours may lead to more widespread preference for reusable products.
Public opinion research
A strong majority of Canadians are concerned about plastic pollution and that they are supportive of further action by governments. In a survey conducted by Abacus Data in 2018, 88% of respondents said they were concerned about plastic pollution in oceans and waterways, including 36% who say it is one of the most important environmental issues today.footnote 26 A major polling effort conducted by Ipsos in 2019 surveyed nearly 20 000 adults from 28 countries, showing widespread global support for action on plastics.footnote 27 Across all surveyed countries, 71% of respondents agreed with the statement that single-use plastics should be banned as soon as possible (by country, 72% of Canadian respondents and 57% of American respondents agreed with the statement).
The COVID-19 pandemic altered public opinion on SUPs bans and consumption of SUPs. Two surveys conducted by Dalhousie University, one pre-pandemic and another during, reported that support for a ban of all SUP food packaging fell from 72% of respondents in 2019 to 58% of respondents in 2020.footnote 28 The surveys also suggested that consumption habits changed, as 29% of respondents indicated that they were buying more plastic-packaged goods during the pandemic relative to before the pandemic. Conversely, over 90% of Canadians polled in a 2021 survey are concerned about the impact plastic pollution has on our oceans and wildlife and polling by Abacus Data in June 2020 reveals that 86% of Canadians support a ban on some SUPs which is up from 81% in 2019. In an early 2021 survey by Abacus Data commissioned by Oceana Canada, two-thirds of Canadians polled indicated support for extending the prohibitions to cover more than just the six categories of SUPs identified by the Framework, such as cigarette filters, polystyrene and other types of drink cups containing plastics.footnote 29
Objective
The objective of the Single-Use Plastics Prohibition Regulations (the Regulations) is to prevent plastic pollution by eliminating or restricting the manufacture, import and sale (including for the purposes of export) of six categories of SUPs that pose a threat to the environment.
Description
The Regulations will eliminate, or restrict six categories of SUPs in Canada and are made pursuant to section 93 of CEPA.
Applicability
The Regulations will apply to the following categories of plastic items:
SUP checkout bags, which are plastic manufactured items made entirely or in part from plastic, formed in the shape of a bag, designed to carry purchased goods from a business, and typically given to a customer at the retail point of sale;
SUP cutlery, which encompasses plastic manufactured items made entirely or in part from plastic and formed in the shape of a knife, fork, spoon, spork, or chopstick;
SUP foodservice ware made from or containing problematic plastics, which encompasses plastic manufactured items made entirely or in part from plastic and:
- formed in the shape of a clamshell container, lidded container, box, cup, plate, or bowl,
- designed for serving or transporting food or beverage that is ready to be consumed, and
- made from or containing the following materials:
- expanded or extruded polystyrene foam,
- polyvinyl chloride,
- plastics with the additive “carbon black,” which is an additive used as a black colour pigment for plastic manufactured items that is produced through the partial or incomplete combustion of hydrocarbons, or
- oxo-degradable plastics, which are plastic materials that undergo accelerated fragmentation into smaller pieces when triggered by ultraviolet radiation or heat exposure in the presence of air;
SUP ring carriers, which are plastic manufactured items made entirely or in part from plastic and formed in the shape of a series of deformable rings or bands that are designed to surround beverage containers in order to carry them together;
SUP stir sticks, which are plastic manufactured items made entirely or in part from plastic and designed to stir or mix drinks, or to stop a drink from spilling out of a lid; and
SUP straws, which are plastic manufactured items made entirely or in part from plastic and formed in the shape of a drinking straw, including SUP flexible straws that have a corrugated section that allows the straw to bend and maintain its position at various angles.
The prohibitions in the Regulations will include performance criteria for checkout bags, cutlery and straws for the purposes of determining whether an item is single-use. There are no similar criteria for stir sticks, ring carriers, or foodservice ware made from or containing problematic plastics, as all products meeting the definition in the Regulations are expected to be single-use.
Tests to determine whether a product meets the criteria for single-use must be conducted by a laboratory accredited under ISO/IEC 17025 entitled General requirements for the competence of testing and calibration laboratories, by an accrediting body that is a signatory to the International Laboratory Accreditation Cooperation Mutual Recognition Arrangement. Alternatively, certification can be provided by a lab accredited under the Quebec Environmental Quality Act.
Prohibitions and exceptions
Prohibitions and exceptions for single-use plastic items except plastic straws
The Regulations will prohibit the manufacture, import, and sale (including for the purpose of export) of the categories of SUPs described in the previous subsection (with the exception of straws, described in the subsection below).
Prohibitions and exceptions for plastic straws
The Regulations will prohibit the manufacture, import, and sale of SUP straws, including straws packaged with other items such as beverage containers, as well as SUP flexible straws in any commercial, industrial, or institutional setting, except for the following activities:
- the manufacture and import of flexible plastic straws, where a “flexible” plastic straw has a corrugated section that allows the straw to bend and maintain its position at various angles;
- the sale of flexible plastic straws from one business to another, as well as sale to or in hospitals, medical facilities, long-term care facilities, and other care institutions, including the offering or provision of SUP flexible straws to patients or residents of any of these institutions; and
- the sale of packages of 20 or more flexible plastic straws in retail stores, on the condition that the straws are not kept on public display (though businesses may advertise that straws are available for purchase) and are provided only if requested by the customer (who can be any individual).
Coming into force
For SUP checkout bags, SUP cutlery, SUP foodservice ware made from or containing problematic plastics, SUP stir sticks, and SUP straws, the prohibitions on manufacture and import will come into force six months after the Regulations are registered. The prohibition on sale of these items will come into force 18 months after the Regulations are registered. SUP flexible straws will not be subject to the prohibition on manufacture and import as there is a need to ensure supply of these items for people who need them, but their sale will be subject to special rules that will come into force 18 months after registration. The prohibitions on the manufacture and import of SUP ring carriers will come into force 12 months after the Regulations are registered. The prohibition on sale for SUP ring carriers, as well as the repeal of an exemption on the sale of SUP flexible straws packaged together with beverage containers, will come into force 24 months after the Regulations are registered. The Regulations repeal the exemption the manufacture, import and sale for the purposes of export for all categories of SUPs 42 months after the Regulations are registered.
Record keeping
Any person that manufactures or imports any of the six categories of SUPs for export for the 42-month period in which export is not prohibited must keep records providing written evidence that the SUP has been or will be exported. Records and supporting documents must be kept for at least five years after they are made.
Consequential amendments to other regulations under CEPA
Consequential amendments are needed to the Regulations Designating Regulatory Provisions for Purposes of Enforcement (Canadian Environmental Protection Act, 1999) (the Designation Regulations), which designate various provisions made pursuant to CEPA as being subject to the fine regime under the Environmental Enforcement Act. Specifically, any regulatory provisions listed in the Schedule to the Designation Regulations are subject to a minimum fine and higher maximum fines, should there be a successful prosecution of an offence involving harm or risk of harm to the environment, or obstruction of authority.footnote 30 Amendments are needed to include the Regulations in the Schedule to the Designation Regulations.
Regulatory development
Consultation
Pre-consultation activities
On October 7, 2020, the Department published the Discussion Paper on the CEPA Registryfootnote 2 outlining its proposed integrated management approach to plastic products to prevent waste and pollution. The Discussion Paper was open to a 60-day public comment period from October 7 to December 9, 2020. During that period, the Department received written submissions representing the views of 245 stakeholder groups (151 industry members, 39 provincial, territorial, or municipal governments, two Indigenous groups, 32 NGOs, and 21 others). In addition, the Department received over 24 000 emails from individual Canadians and an online petition started by a civil society group that received over 100 000 signatures.
The Department also held five webinars and four online stakeholder discussion sessions between October 30 and November 27, 2020. Over 6 000 stakeholders were notified in advance of the webinars, which were also open to the public, and a total of 1 474 individuals participated. For the stakeholder discussion sessions, 100 to 150 stakeholders were invited to each session, with 35 to 50 participants attending each session. Three webinars and three stakeholder discussion sessions addressed the proposed prohibitions on certain SUPs. Topics for discussion included definitions, prohibitions, the potential need for exemptions, and the availability of substitute products. A description of each webinar and stakeholder discussion session, including topics discussed, stakeholder participation, and input received, is available in the What we heard report.
Commenters included industry stakeholders, provincial, territorial, or municipal governments, Indigenous groups, NGOs, and others. Civil society organizations and local governments agreed that plastic pollution is harming the Canadian environment and that Canadians are shouldering the costs of plastic pollution. Many of these organizations were supportive of a ban on the six SUPs targeted by the Regulations, and many also urged the Government of Canada to pursue more ambitious measures (e.g., ban additional SUPs). Provincial and territorial governments were also mostly supportive of the ban, although others expressed concern with potential economic impacts of a SUPs ban, among other things.
Comments covered a range of topics, but generally related to one of seven themes, namely: non-conventional plastics; accessibility concerns; Canada’s international trade commitments; unintended social, economic and environmental effects of substitute products; economic hardship due to the COVID-19 pandemic; the ban not being comprehensive enough; and the creation of national standards. A comprehensive summary of the comments received from these engagements is included in the Regulatory Impact Analysis Statement published in the Canada Gazette, Part I, on December 25, 2021.
Consultation following pre-publication in Canada Gazette, Part I
A 70-day public consultation period followed the publication of the proposed Regulations in Canada Gazette, Part I, on December 25, 2021. During this consultation period, stakeholders and members of the public were given an opportunity to provide the Department with written comments on the proposed Regulations. The Department received written submissions representing the views of 146 stakeholder groups (75 industry members, 22 provincial, territorial or municipal governments, one Indigenous group, 29 NGOs and 19 others). Table 3 presents the level of support of different stakeholder groups. As shown, the majority of stakeholders support the Regulations.
| Stakeholder type | Oppose | Partially support | Support | Total |
|---|---|---|---|---|
| Indigenous Organizations | 0 | 0 | 1 | 1 |
| Industry | 41 | 24 | 10 | 75 |
| Local government | 0 | 4 | 17 | 21 |
| Miscellaneous | 3 | 8 | 8 | 19 |
| NGO | 0 | 6 | 23 | 29 |
| Provinces and territories | 0 | 0 | 1 | 1 |
| Grand total | 44 | 42 | 60 | 146 |
The Department also received 25 notices of objection to the proposed Regulations and requests to establish a board of review to inquire into the nature and extent of the danger posed by one or more of the six categories of SUPs targeted by the proposed Regulations. The Minister has declined to form a board of review. All notices of objection, along with the Minister’s response letters, are available on the CEPA Registry.
In addition to written comments, the Government held online meetings with stakeholders to answer questions and receive feedback. As of March 11, 2022, a total of 48 online meetings with stakeholders took place, including with 27 businesses, 12 industry associations and their Members, four environmental non-governmental organizations, four municipal and provincial governments and the Federation of Canadian Municipalities. In addition, the Department met with all provinces and territories via the Canadian Council of Ministers of the Environment. Many meetings involved multiple stakeholders and included representatives from Health Canada. During these meetings, stakeholders were given opportunities to pose questions and provide feedback. A survey was also sent to a large number of manufacturers across Canada seeking input on the impacts to this sector, with 12 responses received.
Oral and written feedback were considered in finalizing the Regulations. Comments covered a range of topics, but generally related to one of the eight following themes:
Coming into Force Dates
The proposed Regulations included a one-year coming into force period for the prohibitions on manufacture and import, plus an additional year for the prohibition on the sale of SUP checkout bags, cutlery, foodservice ware, ring carriers and stir sticks.
The Government received comments from NGOs and the public urging the Government to accelerate coming-into-force dates in recognition of the need for immediate action to prevent plastic pollution by restricting, or eliminating SUPs that pose a threat of harm to the environment.
In recognition of the actions of industry leaders and other jurisdictions, changing consumer preferences, as well as market trends that are moving away from SUPs, and the overarching goal of preventing plastic pollution, Departmental officials discussed with stakeholders the possibility of shortening the coming into force period. The Department heard from industry retailers and distributors that an accelerated implementation timeline could result in reduced or no access to substitutes once the prohibition on sale came into force. Some stakeholders cited supply chain issues during the COVID-19 pandemic as exacerbating this possibility. Industry manufacturers expressed concern that a shortened coming into force period would not provide sufficient time for re-tooling should they need to pivot their processes entirely.
The Government also heard from numerous stakeholders in the beverage industry that the coming into force period for ring carriers could not be shortened without incurring significant costs and disruptions. Stakeholders explained that shortened timelines would not be sufficient to select alternative packaging, purchase and receive new equipment, and re-arrange production facilities. The Government received similar feedback with regard to SUP flexible straws packaged together with beverage containers (e.g., attached to drink boxes).
This feedback was taken into consideration, as well as market trends and consumer preferences moving away from SUPs. As such, the prohibitions on manufacture and import will come into force six months after registration of the final Regulations and the prohibitions on sale will come into force 18 months after registration for single use plastic checkout bags, cutlery, straws, foodservice ware and stir sticks. For ring carriers, the prohibitions on manufacture and import will come into force 12 months after registration of the final regulations, and the prohibitions on sale for this item as well as for the repeal of a temporary exemption for the sale of SUP flexible straws packaged together with beverage containers will come into force 24 months after registration. A later coming into force date for sale will help avoid stranded inventory and allow sellers to deplete stockpiles and secure substitutes.
Exemption for Export
The proposed Regulations provided an indefinite exemption for the manufacture, import, and sale for the purposes of export of the targeted SUP items, so as to limit the economic impact on domestic manufacturers of these items. Following feedback from NGOs and the public that this exemption would be contrary to both the regulatory objective and to the Government of Canada’s broader zero plastic waste agenda, including commitments made by Canada under the to limit global plastic pollution, the Department raised the potential for removing this exemption during the 70-day consultation period.
The Department consulted broadly on removing the exemption for export, with a range of stakeholders including manufacturers, retailers and industry associations. In feedback from 29 virtual stakeholder meetings and in writing through official submissions on the Regulations regarding the phase-out of the exemption for export, a majority of industry stakeholders opposed removing the exemption for export, suggesting that this approach would result in lost jobs, stranded assets and facility closures. Some large manufacturers stated that a large proportion of their production is currently exported, and that an inability to sell to international markets would be economically harmful. It was also suggested by one stakeholder that removing the exemption for export would have little impact on global plastic pollution, as the market would be filled by foreign production. Some stakeholders suggested that these impacts could be mitigated by providing a transition period before removing the exemption. Industry suggestions for the specific length of time needed to transition varied but were generally three to five years, with consensus that the timeline to plan for and explore new markets, secure financing, order and install new equipment, hire and train new employees can take several years.
As a result of this feedback, the Department concluded that an appropriate balance between the environmental objectives of the Regulations and the time needed for industry stakeholders to transition would be to phase out the exemption for manufacture, import and sale for the purposes of export after 42 months. This timeline considers both industry’s proposition to allow for a transition period for the removal of the export exemption and the Government’s commitments to prevent plastic pollution around the world, including under the Ocean Plastics Charter.
Non-conventional Plasticsfootnote 31
The proposed Regulations did not differentiate between non-conventional (e.g., plant-based) plastics and conventional plastics made from petroleum-derived feedstock. Manufacturers of compostable plastics disagreed with this approach, stating that it would hinder innovation and growth in this sector, that compostable plastics bring environmental benefits and that they would incur economic losses. However, municipal and provincial governments, as well as recyclers and NGOs, were mostly supportive, stating that existing composting and recycling infrastructure is unable to process non-conventional plastics in a cost-effective manner. They urged the Government to also prohibit foodservice ware made from non-conventional plastics.
The Department recognizes the potential advantages of replacing single-use items made from conventional plastics with non-conventional plastic alternatives. Some of these benefits could include reducing fossil fuel consumption when plant-based materials replace carbon-intensive plastic source materials, and increasing food waste diversion in situations where contamination of plastics may present an obstacle to recycling. The Department also recognizes that these benefits must be weighed against current performance in compost facilities, where non-conventional plastics typically cannot be processed and are sent to landfills. In addition, while compostable plastics look very similar to the conventional plastics they replace, many are not designed to be recyclable. Mixing of compostable and conventional plastics can contaminate the recycling stream and reduce recycling recovery rates. The Science Assessment noted a lack of significant evidence that biodegradable, compostable, biobased, and oxo-degradable plastics will fully degrade in natural environments. Accordingly, the Regulations will treat single-use items made from non-conventional plastics in the same manner as their conventional plastic counterparts. The Department is working with partners and stakeholders, including provinces and territories, to develop the knowledge base about non-conventional plastics, which will inform future actions to promote innovation, clean growth and circularity in this sector for applications outside of the items prohibited by these Regulations.
SUP straws and accessibility
During the 70-day consultation period, stakeholders, particularly members of the public, raised the importance of ensuring continued access to SUP flexible straws for persons with disabilities or medical needs. The Department also received written comments from one disability advocacy group, one municipality and several individuals on the subject of straws and accessibility.
Feedback from industry stakeholders was mixed as to whether they would continue to produce or sell SUP flexible straws under the Regulations, given requirements to keep packages of straws out of sight of customers and only sell them on request, combined with an expected decline in Canadian market demand. Some major retailers and pharmacies indicated that they would continue to sell them, though the cost may increase due to reduced Canadian market demand. The City of Vancouver was engaged due to its bylaw requiring food vendors to provide SUP flexible straws upon request.
The Government of Canada is sensitive to the needs of Canadians, including Canadians with disabilities. The Department is committed to creating the conditions to keep SUP flexible straws available for anyone who needs them. The Regulations will allow Canadians with disabilities to continue to purchase SUP flexible straws for personal use, as well as to access them in hospitals and other medical or long-term care settings. These exemptions seek to balance the need to ensure accessibility options in Canada while protecting the environment from plastic pollution.
Canada’s International Trade Commitments
Some industry stakeholders gave their opinion that banning certain SUPs runs contrary to Canada’s interests in international trade, given the broad and growing trade network that provides Canadian companies with preferred access to diverse markets all over the world.
The Government of Canada is aware of its international trade commitments and will continue to respect them. The Department has investigated whether the Regulations could run contrary to Canada’s international trade commitments and has concluded that they would not, based on consultation with the Department of Foreign Affairs, Trade and Development. Where required by international agreements, Canada will notify the appropriate parties, such as the World Trade Organization, about the Regulations. All businesses operating in Canada or exporting to Canada would be subject to the prohibitions on certain single-use plastics, removing any unfair advantages within the domestic market. The Regulations would also continue to allow for the movement of goods in transit.
Unintended Social, Economic and Environmental Consequences of Substitute Products
During the 70-day consultation period and through virtual discussion sessions, some stakeholder groups raised potential economic and environmental impacts of producing and accessing reusable substitutes to the SUP items targeted by the proposed Regulations. Some industry stakeholders suggested that costs would be passed on to consumers, and that the Government’s analysis of cost increases to consumers was an underestimate given the limited supply of substitutes available, as described below in the “Economic Hardship Due to the COVID-19 Pandemic” section. Some stakeholders also claimed that substitutes would be less convenient compared to SUPs, specifically referencing bamboo, paper or wooden straws as less dependable.
In terms of unintended environmental effects of substitute products, many industry members stated that the supply of paper substitutes in particular largely comes from Asian markets. Members suggested that increased transportation through the importing of these substitutes from Asia and other global markets will have a negative environmental footprint. Further, some wondered whether a reliance on paper, or other substitute materials would lead to more environmental degradation (e.g., deforestation). The Department consulted internal experts on this issue and found that Canada will be able to supply the increased demand for paper or other alternative materials given the current operation and development of pulp and paper mills nationally – one of which uses straw as feedstock. The growing demand for these materials has also come from companies pivoting from plastic packaging and not only from a need for paper bags. Experiences in other jurisdictions also suggest that any supply issues would likely be temporary. For example, bans in jurisdictions in the United States, such as one in Washington, have seen supply rebound as industry adapted and increased production of paper bags to keep up with increasing demand.footnote 32
The Department developed these Regulations by taking into account best practices and lessons learned in other jurisdictions and thorough market research to minimize the risk of unintended consequences. In addition, the Department conducted a gender-based analysis plus (GBA+), which analyzed potential impacts of the proposed Regulations on certain demographic groups, including persons with disabilities, women, and single parents. Environmental considerations for substitutes, such as lifecycle analyses, were considered as part of the strategic environmental assessment. The results of these analyses have been incorporated into the design of the Regulations and the Department’s implementation strategy (e.g. exemptions for SUP flexible straws) and the Department will work with partners and stakeholders in the implementation of the Regulations to minimize the risk of unintended consequences, as needed.
Economic Hardship Due to the COVID-19 Pandemic
Many industry stakeholders consulted during the 70-day consultation period raised COVID-19 as a concern of the proposed Regulations, pointing to the negative effect of the pandemic on the economy and suggested that the timing of the Regulations was inappropriate. Pandemic-related disruptions to global supply chains and the high costs of transporting inventory via ocean freight were highlighted as reasons why industry should be given additional time to comply.
The COVID-19 pandemic has affected suppliers economy-wide since its beginning, and even more so in 2021 as global supply chains experienced additional disruptions.footnote 33 Supply shortages of raw materials and products were not exclusive to the market for SUPs and their substitutes, and were borne by many industries.
The global economy grappled with significant supply chain disruptions throughout 2021, including input shortages, production bottlenecks, backlogs at key ports, higher shipping costs and delivery delays. These constraints limited the supply of goods and services. As the pandemic recedes, the Bank of Canada expect consumers to shift back to spending more on services, taking some pressure off global demand for goods. It is also expecting supply chains to normalize, but predicting how long this will take is difficult.footnote 34
In light of the concerns raised by industry stakeholders regarding the negative economic impacts of the COVID-19 pandemic, the Department has worked to strike a balance between addressing a pressing environmental threat with the potential difficulties industry may face in adjusting to the Regulations, given the economic climate.
Scope of the Ban
Over the course of the 70-day consultation period and through virtual discussion sessions with stakeholders, some NGOs voiced opinions that the Government of Canada should do more to address plastic waste and pollution. They asked that the Regulations be expanded to include other single-use plastics (e.g., water bottles, cigarette filters) and that the export exemption in the proposed Regulations be removed. They described the export exemption as a “loophole” and inconsistent with the objectives of the Regulations and recognition of plastic waste and pollution as a global issue.
Some industry stakeholders raised concerns around additional SUPs being banned in the future, claiming this created uncertainty for businesses. Some industry stakeholders also expressed opposition to the Government’s regulatory approach to plastics, including the use of authorities under CEPA.
The Department has established a framework for managing SUPs, which categorizes SUPs according to their impacts on the environment and their value-recovery issues, and identifies measures including bans that could be taken to address issues. In applying the framework, six items were identified as candidates for a ban or restriction. The Department is aware of litter data showing large numbers of other SUPs in the environment and will review performance data for existing and new measures to manage these items, working with partners and stakeholders to identify areas where further action is needed. Currently, cigarette filters are being assessed by the Department to determine whether they are plastic pollutants of concern, and the result of this assessment could be reflected in future Government action. The Government has committed to working with provinces and territories to implement and enforce an ambitious recycling target of 90% – aligned with Quebec and the European Union – for plastic beverage containers. More broadly, the Department will continue to monitor the latest research and data relating to plastic pollution in the environment and will consult with Canadians if additional items are identified to be of concern.
Modern treaty obligations and Indigenous engagement and consultation
The assessment of modern treaty implications conducted on the Regulations in accordance with the Cabinet Directive on the Federal Approach to Modern Treaty Implementation concluded that the proposal will introduce new regulatory requirements on lands covered by modern treaties. However, the Regulations are not expected to affect any rights protected under the Constitution Act, 1982 nor those set out in modern treaties.
A survey conducted by the Department of the laws and regulations enacted by Indigenous governments pursuant to modern treaties found that some Indigenous laws and regulations are in place to help manage the impacts of pollution from SUPs. For example:
- the Makkovik Inuit Community Government, an Inuit community constituted under the Labrador Inuit Land Claims Agreement, has enacted a ban on SUP checkout bags; and
- the Tsawwassen First Nation has enacted the Good Neighbour Regulation that prohibits the littering of plastics, Styrofoam and bags in public places.
Similar to other jurisdictions in Canada with prohibitions on SUPs or on littering, these local measures will be enhanced by federal action to remove certain SUPs from the national market. By doing so, the burden on communities to develop, implement and enforce local measures will be significantly reduced. Indigenous communities that have enacted measures to address plastic pollution were informed of the Regulations and invited to provide input.
Through consultations on the Discussion Paper that was published in October 2020, the Department received written input from two Indigenous organizations: one situated in Northern Quebec and one situated in Atlantic Canada. These commenters expressed concern with increased levels of plastic pollution in Indigenous communities, explained some of the challenges of managing plastic waste in rural and remote areas and encouraged the Government of Canada to work closely with communities as it develops measures.
In the spirit of early engagement, the Department held a virtual “face-to-face” meeting with interested Indigenous communities and organizations on January 8, 2021, to discuss the proposed risk management approach presented in the Discussion Paper, answer questions and solicit feedback. Seven representatives of Indigenous organizations attended the meeting. Input received from this session included the following:
- the Government of Canada should take into consideration the needs of Indigenous communities that may rely on SUPs, such as water bottles and cutlery, during boil-water advisories;
- bans on SUP checkout bags implemented by Indigenous communities have been successful, without significant drawbacks;
- waste management policies, such as extended producer responsibility, are difficult to implement in rural and remote areas, due to the costs of transporting waste; as a result, waste is typically landfilled or burned; and
- further studies should be undertaken to understand the challenges and opportunities for Indigenous communities and businesses to reduce plastic waste and prevent plastic pollution.
In response to input from Indigenous peoples, the Department consulted officials at Crown-Indigenous Relations and Northern Affairs Canada, who stated that boil-water advisories should not prevent the washing of reusable cutlery.
The pre-publication comment period also provided an opportunity for Indigenous peoples to provide feedback on the Regulations. One Indigenous group located in Northern Quebec provided written comments stating that it supported the objective of the Regulations, but encouraged the Government to remain sensitive to the costs of substitutes in the context of the higher cost of living in remote, small and northern communities. It also encouraged the Government to collaborate with provincial, regional and local governments active in Northern Quebec in implementing the Regulations.
Instrument choice
The Prime Minister’s announcement and subsequent Mandate Letters to the Minister of the Environment in 2019 and 2021, as well as the 2020 Speech from the Throne, set a commitment for the Government of Canada to ban harmful SUPs, where supported and warranted by science. This commitment was reiterated in October 2020 with the publication of the Discussion Paper, which described the Government of Canada’s management framework for SUPs. This framework supports the above-mentioned commitment, as well as the Government of Canada’s comprehensive plan to achieve zero plastic waste. It established a three-step process for
- determining the need for particular SUPs to be managed;
- determining the management objective that should be assigned to particular SUPs; and
- choosing the most appropriate instrument to achieve management objectives.
The first step in the framework characterized SUP items as either environmentally problematic, value-recovery problematic, or both, and identified considerations for possible exemptions from management actions. Criteria for categorizing SUP items are described in the table below. Considerations for exemptions from risk management actions included whether a SUP item performs an essential function (e.g., related to accessibility, health and safety, or security) and whether a viable substitute exists that can serve the same function as the SUP item.
| Categories of single-use plastics | Criteria |
|---|---|
| Environmentally problematic |
|
| Value-recovery problematic |
|
The second step in the framework sets three management objectives based on the categorization of SUPs:
- eliminate or significantly reduce SUPs entering Canada’s environment;
- reduce the environmental impact of plastic products overall; and
- conserve material resources by increasing the value recovery of plastics.
The third step of the framework was to select policy instruments informed by the Department’s Instrument Choice Framework for Risk Management under CEPA. Under this framework, instruments are chosen based on several criteria, including the following:
- environmental effectiveness and achievement of the management objective;
- maximization of benefits and minimization of costs;
- distributional impacts on groups and segments of society;
- stakeholder acceptability and compatibility with other programs in Canadian jurisdictions; and
- meeting international obligations, including international protocols, agreements, and trade obligations.
Potential instruments identified under the framework include bans and restrictions on use, incentives to encourage selection of reusable products or systems, material specifications (e.g., recyclability rules or guidelines), and extended producer responsibility or other collection and recycling requirements.
The Department assessed fourteen categories of SUPs according to the criteria in the management framework described in the Discussion Paper. A total of six categories of SUPs met all of the criteria outlined in the first step of the framework as being both environmentally and value-recovery problematic, and therefore were identified as candidates for a ban or restrictions on their use. The other eight categories of SUPs met only some of the criteria, and are potential candidates for management using other instruments. The Department will continue to consult and work with jurisdictions, stakeholders and the public to help determine how these other SUPs can be better managed to reduce plastic pollution and improve value recovery.
Under the framework, regulatory actions banning or restricting SUPs that are both environmentally and value-recovery problematic was identified as the only viable option to eliminate, or significantly reduce the entry of these SUPs into Canada’s environment. The Department identified the development of regulations under section 93 of CEPA, following the addition of plastic manufactured items to Schedule 1 to the Act, as the preferred risk-management approach, given that CEPA is one of the Government of Canada’s key pieces of legislation to prevent pollution that can cause environmental harm. The Act also provides a broad suite of tools that allow for flexibility to tailor measures to the specific issues requiring action.
Regulatory analysis
Benefits and costs
Analytical framework
In order to analyze the incremental impacts of the Regulations, the Department developed an analytical framework to characterize the costs and benefits (Figure 1). Unless otherwise stated, all costs and benefits in the following subsections are presented in 2021 Canadian dollars, present value to base year 2022 using a 3% discount rate. The social discount rate of 3% is applied in the central analysis since the Regulations will primarily affect private consumption of goods and services. Total monetized benefits and costs discounted at 7%, as well as non-discounted totals, are presented in the “Sensitivity analysis” subsection of the “Benefits and costs” section.
| Policy design and activities |
Costs |
Benefits |
|---|---|---|
Prohibition of six categories of SUPs, resulting in
|
Economic costs:
Environmental and social impacts:
|
Reduced risk of injury or death to wildlife and improved habitat quality Increased enjoyment of ecosystem goods and services Avoided terrestrial litter clean-up cost Avoided marine pollution cost |
Record keeping |
Administrative costs |
N/A |
Compliance promotion and enforcement activities |
Government costs |
N/A |
The policy design and activities depicted in the analytical framework correspond to those presented in the “Description” section. Before any costs or benefits can be estimated, the impact of the Regulations on plastic waste and plastic pollution must first be quantified.
Quantifying the decrease in plastic waste (and associated increase in waste from substitutes)
Since single-use manufactured items are designed to become waste immediately after their single-use function has been fulfilled, the analysis assumes that “units sold” is equivalent to “waste generated.” In order to quantify the change in waste associated with the Regulations, the sales volumes over time for the six categories of SUPs and their main substitutes can be estimated, first in absence of the Regulations (baseline scenario), and then, given the Regulations (policy scenario). A quantification framework for this estimation is presented in Figure 2, where the area of each rectangle represents the sales volume of a given SUP and its main substitutes (note: areas are not to scale, diagram is illustrative only).
Figure 2. Quantification framework for units sold / waste generated in Canada
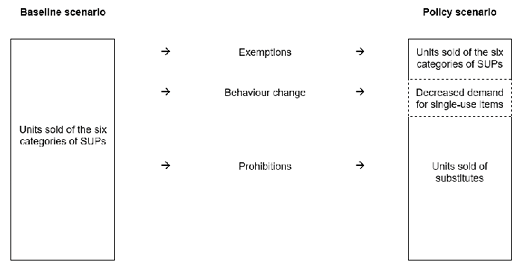
The quantifications following the framework in Figure 2 are presented in the subsections below.
Baseline scenario
The Department acquired off-the-shelf market data on checkout bags, cutlery, foodservice ware, ring carriers, stir sticks and straws from international data analytics firms, then cross-referenced this data against other research (e.g., the Statistics Canada Supply and Use Tables, proprietary information from industry, publicly available literature and manufacturer, distributor, or wholesaler websites) to create a historical database spanning from 2015 to 2019. The database includes estimates of sales volume, average price per unit (as paid by the final retailer) and the average mass per unit across the six categories of SUPs and their main substitutes. Sales volume is multiplied by average price per unit to estimate market value and by average mass per unit to estimate tonnage. These estimates for 2019 are presented in Table 1 and Table 2 in the “Background” section.
In order to construct a projected baseline scenario, the average annual growth in sales volumes over the historical period (2015 to 2019) for the six categories of SUPs and their main substitutes are first calculated and then applied from 2024 onward. The analysis assumes no sales growth for the six categories of SUPs and their main substitutes between 2019 and 2023 to account for the high level of uncertainty related to the COVID-19 pandemic and its impact on these markets. In the midst of public health measures such as stay-at-home orders, temporary business closures and teleworking, the use patterns of Canadians with respect to the six categories of SUPs and their substitutes have changed. For instance, greater uptake in take-out meals may contribute to higher usage of foodservice ware and cutlery, while fewer social outings in restaurants and bars may contribute to lower usage of straws and stir sticks. There is great uncertainty as to what the lasting market impacts of the COVID-19 pandemic on the six categories of SUPs may be. Equating projected sales volumes in 2023 with those observed in 2019 assumes that the markets for these goods will not shift permanently onto a different course, but rather, that they will “reset” back to their former usage rates and observed growth patterns once public health restrictions ease.
The projected baseline also takes into account Canadian jurisdictions that have implemented localized bans on any of the six categories of SUPs that have come into force after 2019 and prior to 2023 (e.g., Nova Scotia, Newfoundland and Labrador, Vancouver, Saint-Jean-sur-Richelieu, Sherbrooke), by adjusting the projected baseline sales volumes downward proportionate to the percentagefootnote 35 of the population living in areas covered by these bans. This is to ensure that the costs and benefits of measures undertaken by other jurisdictions are not attributed to the Regulations. The projected baseline does not take into account any announcements from governments or industry regarding future intent to phase out usage of any of the six categories of SUPs, as these announcements are non-binding.
Policy scenario
As illustrated in Figure 2, all sales of the six categories of SUPs in the baseline scenario will be reallocated into one of three outcomes in the policy scenario: exemptions, demand reduction, or substitution. The reallocation factors into each outcome used in the analysis are presented in Table 5.
| Item category | Exemptions | Demand reduction | Substitution |
|---|---|---|---|
| SUP checkout bags | 0 | 5 | 95 |
| SUP cutlery | 0 | 15 | 85 |
| SUP foodservice ware made from or containing problematic plastics | 0 | 0 | 100 |
| SUP ring carriers | 0 | 0 | 100 |
| SUP stir sticks | 0 | 10 | 90 |
| SUP straws | 10 | 15 | 75 |
The term exemptions refers to the continued manufacture, import and sale of SUPs in certain cases as outlined in the “Description” section. The Regulations contain exemptions to retain access to SUP flexible straws for accessibility purposes. The historical database from 2015 to 2019 suggests that sales of SUP straws to “healthcare” and “households” accounted for around 6% of total sales. Given that the Regulations permit the sale of SUP flexible straws for healthcare and individual use, the analysis assumes a 10% exemption rate to account for those baseline sales as well as some contingency to account for increased sales to individuals who want a SUP straw, but who will no longer receive one from a restaurant, for example. More analysis of this consideration is presented in the “Gender-based analysis plus” section.
Demand reduction refers to the expected decrease in demand for single-use substitutes induced by the Regulations. For example, this could result if higher unit costs for substitutes drive behavioural change in retail settings (price elasticity of demand),footnote 36 whereby certain substitutes (e.g., paper checkout bags, paper straws, wood cutlery, wood stir sticks) might be offered “on demand” instead of “by default”.
Substitution refers to the replacement of the six categories of SUPs by their readily available substitutes. In general, for SUPs with multiple substitutes (e.g., foodservice ware made from or containing problematic plastics), reallocation into each substitute is based on relative market shares under the baseline scenario. SUP checkout bags are the only category of SUPs for which a reusable substitute (i.e., reusable plastic checkout bags) is also modelled. For all categories of SUPs except SUP checkout bags, once demand reduction is considered, the analysis assumes the substitution of one SUP item by one single-use substitute item. For example, in the analysis, one SUP stir stick is replaced by one single-use wood stir stick and one SUP straw is replaced by one single-use paper straw. For SUP checkout bags, additional factors are included to account for substitution with reusable checkout bags, as well as volume capacity differences between SUP checkout bags and their substitutes. Specifically, the analysis assumes that, on average, one single-use paper checkout bag replaces 1.2 SUP checkout bags, and one reusable checkout bag replaces 1.7 SUP checkout bags each time it is used.footnote 37 Using the requirements for distinguishing between a plastic checkout bag that is single use versus one that is “reusable” (as per the “Description” section), the analysis assumes that each reusable checkout bag is used 100 times on average, thereby replacing 170 SUP checkout bags over its lifetime.
Incremental change
As outlined in the “Description” section, the prohibitions on manufacture and import will come into force six months after the Regulations are registered, with the exception of SUP ring carriers, for which the prohibition on manufacture and import will come into force 12 months after registration. The prohibition on sale will come into force 18 months after registration with the exception of SUP ring carriers and SUP flexible straws packaged together with beverage containers, for which the prohibition on sale will come into force 24 months after registration. Accordingly, the chosen 10-year analytical period is 2023 to 2032, with 2024 marking the first year of full policy stringency. To account for the de-facto “sell-through” period, the analysis assumes that 75% of substitutions for all categories of SUPs except ring carriers will have occurred by the date that the prohibition on sale comes into force. For SUP ring carriers, the analysis assumes that 50% of substitutions will have occurred by the date that the prohibition on sale comes into force.
As depicted in Table 6, the Regulations are expected to reduce the plastic waste generated by the six categories of SUPs by an estimated 139 225 tonnes in the first year of full policy stringency (2024) or 1.5 million tonnes over the analytical period (2023 to 2032). The Regulations will also reduce the quantity of plastic waste generated from Canadian exports, though these reductions may be offset by other suppliers in the global SUP market.
| Item category | Millions of units (first year of full stringency, 2024) | Millions of units (10-year analytical period, 2023–2032) | Tonnes (first year of full stringency, 2024) | Tonnes (10-year analytical period, 2023–2032) |
|---|---|---|---|---|
| SUP checkout bags | -14 247 | -152 169 | -115 364 | -1 232 839 |
| SUP cutlery | -4 411 | -47 386 | -10 627 | -111 434 |
| SUP foodservice ware made from or containing problematic plastics | -462 | -4 771 | -8 630 | -91 138 |
| SUP ring carriers | -187 | -1 904 | -661 | -6 742 |
| SUP stir sticks | -3 041 | -33 232 | -1 825 | -19 939 |
| SUP straws | -5 298 | -56 996 | -2 119 | -22 798 |
| Total table c4 note a | -27 646 | -295 329 | -139 225 | -1 484 891 |
Table c4 note(s)
|
||||
Due to the inherent characteristics of substitutes, the reduction in plastic waste from the six categories of SUPs depicted in Table 6 will have an associated increase in waste from substitutes (e.g., substituting paper for plastic increases material weight). As illustrated in Table 7, the Regulations are expected to increase the tonnage of waste generated from substitutes by an estimated 275 943 tonnes in the first year of full policy stringency (2024) or 2.9 million tonnes over the analytical period (2023 to 2032), almost all of which is driven by paper substitutes. In the case of SUP checkout bags, SUP foodservice ware made from, or containing problematic plastics, as well as SUP ring carriers, some of their substitutes are themselves made of plastics, though they are likely less harmful than their prohibited counterparts. The substitutes made out of plastics are usually easier to recycle and therefore less likely to contribute to plastic waste in landfills. Further, in the case of SUP ring carriers, many substitutes to these pose less of a risk of harm to wildlife due to entanglement as they are not shaped like rings.
As shown in Table 7, substitutes made of plastics are estimated to generate 13 822 tonnes of plastic waste in the first year of full policy stringency (2024) or 150 600 tonnes over the analytical period (2023 to 2032).
| Substitute material | Millions of units (first year of full stringency, 2024) |
Millions of units (10-year analytical period, 2023–2032) |
Tonnes (first year of full stringency, 2024) |
Tonnes (10-year analytical period, 2023–2032) |
|---|---|---|---|---|
| Paper | 8 769 | 93 890 | 248 041 | 2 641 488 |
| Wood | 6 486 | 69 227 | 9 189 | 98 623 |
| Plastics | 391 | 4 284 | 13 822 | 150 600 |
| Moulded fibre | 136 | 1 332 | 4 266 | 41 441 |
| Aluminum | 66 | 576 | 625 | 5 468 |
| Total table c5 note a | 15 848 | 169 308 | 275 943 | 2 937 620 |
Table c5 note(s)
|
||||
Combining the results in Table 6 with those from the plastics row from Table 7, the Regulations are expected to result in an estimated net reduction in plastic waste of 125 403 tonnes in the first year of full policy stringency (2024) or 1.3 million tonnes over the analytical period (2023 to 2032), as illustrated in Table 8. The net reduction in plastic waste for checkout bags alone represents 87% of this total net reduction in plastic waste by tonnage, or 52% by unit counts.
| Item category | Millions of units (first year of full stringency, 2024) |
Millions of units (10-year analytical period, 2023–2032) |
Tonnes (first year of full stringency, 2024) |
Tonnes (10-year analytical period, 2023–2032) |
|---|---|---|---|---|
| Checkout bags | -14 169 | -151 627 | -109 290 | -1 167 805 |
| Cutlery | -4 411 | -46 257 | -10 627 | -111 434 |
| Foodservice ware made from or containing problematic plastics | -203 | -1 843 | -2 406 | -20 862 |
| Ring carriers | -106 | -1 091 | 863 | 8 548 |
| Stir sticks | -3 041 | -33 232 | -1 825 | -19 939 |
| Straws | -5 298 | -56 996 | -2 119 | -23 798 |
| Total table c6 note a | -27 225 | -291 046 | -125 403 | -1 334 291 |
Table c6 note(s)
|
||||
Quantifying the net decrease in plastic pollution (and associated increase in pollution from substitutes)
The Regulations are expected to result in a net reduction in plastic litter and plastic pollution stemming from the net reduction in plastic waste depicted in Table 8. A quantification framework relating to these estimations is presented in Figure 3, where the area of each rectangle represents a proportion of plastic waste, by tonnes (note: areas are not to scale, diagram is illustrative only, percentages relate to 2024).
Figure 3. Quantification framework for terrestrial and marine plastic pollution generated in Canada
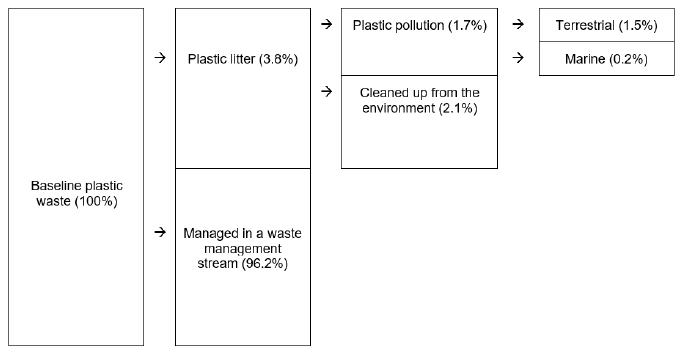
The quantification framework depicted in Figure 3 is populated using the following three-step methodology:
- Estimate the littering rates (See Table 9) associated with the six categories of SUPs. Certain literaturefootnote 38 has estimated the littering rates for SUP checkout bags, SUP cutlery, SUP foodservice ware, SUP stir sticks, and SUP straws. As the Department did not identify a specific estimate of the littering rate for ring carriers in the literature, the analysis uses the estimated littering rate for the overall packaging sector (from the 2019 Deloitte Study).
- Estimate the amount of plastic litter that is recovered through various clean-up initiatives that becomes properly disposed of in a managed waste stream and the amount of plastic litter that stays in the environment as plastic pollution. The 2019 Deloitte Study estimated that around 56% of the plastic littered into the environment from the packaging sector (excluding bottles) was recovered via clean-up efforts and properly disposed of, with the other 44% remaining in the environment as plastic pollution. The analysis assumes that these proportions hold for the six categories of SUPs, which are a subset of the overall packaging sector, and that they hold over the entire analytical period (i.e., paid and unpaid clean-up activities are expected to remain proportionate to the amount of baseline litter).
- Estimate the proportion of plastic pollution in the terrestrial versus marine environment. Certain literature has estimated that 5% of all plastic litter leaks into a marine environment.footnote 39 This approach to estimate marine plastic pollution excludes plastic pollution that enters Canadian fresh waters (including the Great Lakes, other lakes, and rivers) that never reaches the oceans.
The expected reduction in plastic pollution, including marine plastic pollution, across the six categories of SUPs is presented in Table 9 for the first year of full policy stringency (2024).
| Item category | Net reduction of plastic waste (tonnes) | Estimated littering rate | Avoided littered plastic (tonnes) | Reduction of plastic litter cleaned up (tonnes) table d1 note a | Reduction in total plastic pollution (tonnes) table d1 note b | Reduction in marine plastic pollution (tonnes) table d1 note c |
|---|---|---|---|---|---|---|
| checkout bags | -109 290 | 4.10% | 4 481 | 2 509 | 1 972 | 224.0 |
| cutlery | -10 627 | 0.46% | 49 | 27 | 22 | 2.4 |
| foodservice ware made from or containing problematic plastics | -2 046 | 5.10% | 123 | 69 | 54 | 6.1 |
| ring carriers | 863 | 0.89% | -9 | -5 | -4 | -0.5 |
| stir sticks | -1 825 | 0.20% | 4 | 2 | 2 | 0.2 |
| straws | -2 119 | 3.10% | 66 | 37 | 29 | 3.3 |
| Total table d1 note d | -125 403 | N/A | 4 712 | 2 639 | 2 073 | 235.6 |
Table d1 note(s)
|
||||||
Of the estimated net reduction in plastic waste of 125 403 tonnes in the first year of full policy stringency (2024), an estimated 2 073 tonnes are prevented from becoming plastic pollution, including 1 838 tonnes in terrestrial plastic pollution and 236 tonnes in marine plastic pollution. Of the estimated net reduction in plastic waste of 1.3 million tonnes across the total analytical period (2023 to 2032), an estimated 22 048 tonnes are prevented from becoming plastic pollution, including 19 543 tonnes in terrestrial plastic pollution and 2 505 tonnes in marine plastic pollution. The Regulations are also expected to result in an estimated 2 639 tonnes in avoided plastic litter cleaned up from the environment in 2024 or 28 061 tonnes over the total analytical period.
Overall, the expected net reduction in plastic waste and plastic pollution associated with the Regulations will represent around 3% of total estimated plastic waste and 5% of total estimated plastic pollution generated in Canada in 2024.
Benefits
The main benefit associated with reducing terrestrial and marine plastic pollution is reduced risk of injury or death to wildlife and improved natural habitat quality. Another benefit is increased enjoyment of natural scenery and outdoor public recreation spaces by Canadians. These non-monetized benefits are expected to improve the well-being of Canadians and the environment. The analysis also monetizes avoided terrestrial litter clean-up costs, as well as avoided marine plastic pollution as it affects tourism, fisheries, and clean-up costs. Such monetization may partially capture the value that Canadians place on reduced risk to wildlife and their habitats, as well as human enjoyment of cleaner environments, given that our society allocates time and resources to litter clean-up for environmental and aesthetic purposes.
Reduced risk of injury or death to wildlife and improved habitat quality
Most of the existing literature characterizes the harm from plastic pollution to wildlife and habitats in general, not specifically from SUPs, though conclusions regarding the former can be applied to the latter as SUPs are a common form of plastic pollution.
Plastic waste that enters the environment as plastic pollution does not decompose easily and represents a persistent risk of harm to wildlife and habitats throughout its lifetime. In the marine environment, plastics degrade slower than they do on land, while light-weight plastic pollution (such as SUPs) can float on the surface of waters for a long time before sinking. The buoyancy of light-weight plastic pollution makes it easily carried by currents from smaller bodies of water to oceans, where it can collect in floating garbage patches. Marine wildlife that encounters plastic pollution on the water’s surface may sustain injuries or may mistake it for food.
Entanglement is one of the most frequently reported impacts of macroplastic pollution on wildlife.footnote 40 Certain literature estimates that over 200 species have been impacted by entanglement as of 2015, though this number is likely underestimated due to lack of reporting from some major global regions.footnote 41 The looped structure of certain plastic items (e.g. plastic bags and ring carriers) poses a threat of entanglement. Plastic bags pose among the most significant threats of entanglement to marine life, along with fishing gear and balloons.footnote 15 Entanglement can be lethal to animals, causing either suffocation or strangulation, and when entanglement is not immediately lethal, it can inhibit growth, reduce mobility and cause physical injuries and physiological stress in animals that can lead to eventual mortality.footnote 42 For example, whole or parts of plastic items lodged in various body parts of wildlife can cause severe discomfort. Marine plants, sponges, and coral are also killed when smothered by larger items (e.g. plastic bags), that prevent adequate gas exchange or impair photosynthesis.
Another physical impact of plastic pollution on wildlife is intentional or unintentional ingestion. Intentional ingestion is when an organism mistakes plastic pollution for food, whereas unintentional ingestion is when an organism feeds on another organism that has ingested plastic pollution, thereby indirectly absorbing that pollution through the food chain. Like entanglement, ingestion can be lethal or sublethal. Lethal effects include damage to internal organs and intestinal blockages, which can ultimately lead to starvation. Sublethal impacts include altered growth or condition, nutritional changes, contamination from toxic additives, and other internal damage.footnote 15,footnote 43 Studies have rated SUP checkout bags and SUP cutlery as the greatest ingestion risk for seabirds, turtles, and marine mammals.footnote 15
In addition to bodily harm to wildlife, macroplastic pollution can adversely affect habitats and ecosystems. Floating plastic items in marine environments can act as rafting vessels that transport non-native organisms into established ecosystems. These organisms can be predators to native species or may outcompete them for resources, leading to losses in biodiversity. Non-native species can also expose native species to diseases, which could alter the genetic diversity within ecosystems.footnote 44
Macroplastic pollution can also fragment into smaller pieces, and the resulting microplastic pollution can pose a significant threat of ingestion to wildlife. While the literature in this domain is scarce, ingestion of microplastic pollution may have negative impacts on organisms’ nutrition and metabolism,footnote 45 as well as reproduction and mortality rates.footnote 46 Further research is needed to understand the full effects of microplastic pollution on wildlife and habitats.
The Regulations are expected to reduce the risk of harm to wildlife and habitats by reducing the amount of macroplastic pollution entering terrestrial and marine environments, thereby rendering fewer opportunities for wildlife to encounter such pollution and become adversely affected. The potential risk of harm to wildlife and their habitats from the littering of substitutes to the six categories of SUPs, which are expected to mainly be made out of paper or wood, is expected to be lower as products made out of these materials tend to biodegrade more rapidly.
Increased enjoyment of ecosystem goods and services
In addition to beneficial impacts on wildlife and their habitats, reduced terrestrial and marine plastic pollution associated with the Regulations is also expected to increase the enjoyment of outdoor spaces for current and future generations. Parks, beaches and other outdoor public spaces provide a wealth of ecosystem services, such as regulating services (e.g. regulating climate and biological processes) and cultural services (e.g. providing spaces for recreation and relaxation).footnote 47 Increasing access to and functionality of these spaces contributes to human well-being.footnote 48 The presence of plastic pollution in these environments can hinder the functionality and aesthetic beauty of outdoor public spaces. Reducing plastic pollution now is an investment in current and future ecosystem goods and services, and in their positive effect on human wellbeing.footnote 48
Reducing plastic pollution in public spaces may positively affect recreational value for residents and tourists. Studies have found that people value aesthetic beauty and cleanliness, while visitors will spend less time in littered environments or will avoid certain sites they anticipate to be full of litter.footnote 49 For example, cleanliness of beaches is an important factor for tourists in deciding which beach to attend,footnote 50 and tourists express a positive willingness to pay for clean water and coastlines.footnote 51 Residents and tourists may therefore derive increased recreational value from using visually clean and sanitary public spaces. This is expected to have positive impacts on local tourism communities (through increased tourism revenues) since cleaner outdoor public areas tend to attract more tourists.
Plastic pollution can also hinder the accessibility and functionality of public spaces and prevent residents and tourists from enjoying activities in a natural setting. Specifically, the presence of litter can have direct consequences on individuals’ physical and mental health. Visitors and workers can be susceptible to a range of injuries, such as cutting themselves on sharp plastics and being exposed to unsanitary items,footnote 52 as well as to negative impacts on their emotional and mental well-being.footnote 53 Refraining from participating in activities that ecosystems typically offer can also have health implications due to forgoing opportunities to obtain the positive impacts associated with such goods. Plastic pollution can also act as a barrier to accessing outdoor public spaces, such as boardwalks and parks.
Reducing plastic pollution in public spaces may also provide considerable cultural or emotional gratification. Evidence shows that humans experience well-being in the knowledge that animals are present and will remain there for future generations. For example, “charismatic” marine organisms such as seabirds or turtles hold significant cultural and emotional importance to some individuals, which suggests that a reduction in marine plastic pollution that reduces the risk of harm to charismatic species may also improve human well-being.footnote 54
People’s perceptions, preferences, and valuations of ecosystem goods and services differ with variables such as income, culture, education and gender.footnote 55 These individual characteristics play a role in the degree to which the population will enjoy the benefits of the Regulations. Peoples’ relationship with ecosystem goods and services is also positively correlated with their willingness to pay for them.footnote 56 Hence, individuals will reap the benefits of improved well-being differently, depending on their relationships with ecosystem goods and services and their respective positionalities.
Avoided terrestrial litter clean-up costs
The cost of cleaning up terrestrial litter predominantly relates to the cost of collecting the individual pieces of litter that are dispersed throughout urban and rural environments (e.g. streets, parks, roadsides, shorelines). These costs are usually borne by municipalities, but can also be carried by businesses on their properties and can represent a significant opportunity cost when accomplished through volunteering activities.
Canadian municipal litter surveys (e.g., in Vancouver, Edmonton, and Toronto) and provincial highway litter surveys (e.g., in Newfoundland and Labrador, New Brunswick, Nova Scotia, Prince Edward Island) provide information on plastic litter but do not disclose the costs incurred to clean up that litter. Therefore, the analysis makes use of publicly available case studies on terrestrial plastic litter clean-up costs and is structured on a per item basis. Assessing terrestrial litter clean-up costs on a tonnage basis would mischaracterize the scope of the benefit, given that plastic litter is numerous, light-weight, and scattered widely throughout the environment.
As shown in Table 9, the expected decrease in plastic litter cleaned up from the environment is estimated at 2 639 tonnes in the first year of full policy stringency (2024) or 28 061 tonnes over the analytical period (2023 to 2032). This tonnage is equivalent to a reduction of more than 439 million SUP units cleaned up from the environment in 2024, or 4.7 billion SUP units over the analytical period. The analysis of avoided litter clean-up costs also needs to account for the increased littering of substitutes made from materials other than plastics. The littering rates for substitutes to the six categories of SUPs are expected to be the same as the six SUPs, independent of the material type, except for reusable checkout bags, which are expected to have a littering rate of 0.5% relative to the 4.1% littering rate for SUP checkout bags.footnote 57 Single-use substitutes made out of paper, wood, or moulded fibre are all biodegradable in the environment, and are estimated to represent 95% of all substitutes, by weight. The littering of these substitutes is therefore not expected to result in long-term harm to the environment. However, a portion of these substitutes that are littered in the environment will still be cleaned up through paid and volunteer activities, before they had enough time to fully decompose. The proportion of these substitutes picked up during litter clean-up activities will vary depending on the category of item and the type of material. For example, a single-use paper straw decomposes in the environment much faster than a single-use paper checkout bag or a piece of single-use wood cutlery. While pollution from single-use aluminum foodservice ware does not decompose in the environment easily, these substitutes are expected to represent less than 1% of the total tonnage across all substitute materials.
The increased waste from non-plastic substitutes is estimated to result in 344 million items littered in the environment in the first year of full policy stringency (2024) or 3.7 billion items over the analytical period (2023 to 2032), of which, less than one third (101 million items in 2024 or 1.1 billion items over the analytical period) will be cleaned up from the environment before fully decomposing. The Regulations are therefore expected to result in an estimated net reduction of 338 million littered items cleaned up from the environment in the first year of full policy stringency (2024), or 3.6 billion littered items over the analytical period (2023 to 2032).
Governments generally do not apportion litter costs based on individual pieces of litter, but rather, on the time spent cleaning up that litter. The literature provides some examples of annual per capita costs for litter collection, but these data are not helpful in determining the marginal cost of a specific source of litter (i.e., the six categories of SUPs). The majority of cost information comes primarily from roadside litter collection programs. However, there are limitations in generalizing roadside litter clean-up costs across all terrestrial litter clean-up, as roadside litter clean-up costs will vary depending on litter deposition rates and density, cost of labour, surface conditions, and cost of the necessary equipment.footnote 58 Different studies from the United States have estimated the cost of litter clean-up at between US$0.21 and US$1.29 per littered item for paid public employees, and at between US$0.047 and US$0.18 for voluntary labour under Adopt-a-Highway litter clean-up programs.footnote 59 Another study estimated that the cost of labour alone to collect each piece of litter that accidentally leaked into the environment from curbside recycling collection ranged from US$0.17 to US$0.79 per littered item.footnote 60
While the six categories of SUPs are among the most prevalent forms of plastic litter picked up during litter clean-up activities, other types of litter are also collected. Therefore, the following analysis is based on the average number of littered plastic items that can be picked up in one hour and assumes an average hourly labour rate or opportunity cost of volunteer labour of $15 per hour.
| Number of units of SUPs picked up in one hour | Cost of collection per item | Estimated total avoided terrestrial litter clean-up cost for 338 million units (2024) | Estimated total avoided terrestrial litter clean-up cost for 3 618 million units (2023–2032) |
|---|---|---|---|
| 40 | $0.38 | $121M | $1,162M |
| 60 | $0.25 | $80M | $764M |
| 80 (central scenario) | $0.19 | $61M | $581M |
| 100 | $0.15 | $48M | $459M |
Under the chosen central scenario, the Regulations are expected to result in an estimated $61 million in avoided terrestrial clean-up cost in the first year of full policy stringency (2024), or $581 million across the analytical period (2023 to 2032). These cost savings represent $1.58 per capitafootnote 61 in avoided terrestrial litter clean-up cost in 2024 or $15.11 over the analytical period.
Avoided marine pollution costs
The Regulations are expected to result in an estimated net reduction in marine plastic pollution of 2 505 tonnes over the analytical period. The quantification of plastic leakage, especially marine plastic pollution, is a relatively nascent field of study. Further, studies assessing the geographical and spatial distribution of plastic pollution are even less prevalent. While these studies generally profile the negative externalities associated with marine plastic pollution qualitatively, only a few attempts to monetize those impacts, with significant variance between them. These studies are also difficult to compare as their scope, methodology and assumptions diverge significantly.
Combining input from the 2019 Deloitte Study with another Deloitte study, which modelled the median economic cost of marine plastic pollution in terms of its impact on tourism, fisheries, and clean-up costs in Canada at US$31 million per year, the cost of marine plastic pollution in Canada can be estimated at approximately Can$16,800 per tonne (2021 constant dollars). This figure is expected to represent a low-bound estimate, as the proprietary model only considered inhabited coastlines for clean-up, rather than the entire coastline. The model also excluded impacts to wildlife and their habitat and valuation of real estate in coastal areas. The prevalence and relatively small size of the six SUPs (as compared to other plastic litter, such as fishing gear) also suggests that the $16,800 is a low-bound estimate. Considering an estimated net reduction of 236 tonnes in marine plastic pollution in the first year of full policy stringency (2024), the Regulations are expected to result in an estimated $3.7 million in avoided costs of marine plastic pollution (or an estimated net reduction of 2 505 tonnes in marine plastic pollution over the analytical period resulting in estimated avoided costs of $35.6 million).
Based on available literature, the analysis assumes that there are minimal negative externalities on the marine environment associated with single-use substitutes that are not made of plastic, as most of these substitutes decompose either prior to reaching the marine environment or relatively quickly thereafter. In comparison, the six categories of SUPs are usually lighter and more buoyant than their non-plastic substitutes, which facilitate their transport via wind or water into marine environments.
Costs
The decreased quantity (and tonnage) of plastic waste and plastic pollution from the six categories of SUPs and associated increased quantity (and tonnage) of waste and pollution from substitutes to the six categories of SUPs elicits several costs, explored in the subsections below.
Substitution cost (for all categories of SUPs except checkout bags)
For SUP cutlery, SUP foodservice ware made from or containing problematic plastics, SUP ring carriers, SUP stir sticks, and SUP straws, the Regulations are expected to result in an estimated 295 billion fewer SUPs sold (Table 6) and 169 billion more substitutes sold (Table 7) over the analytical period (2023 to 2032). Market data suggests that, on average, these SUPs are sold for lower unit prices than their readily available substitutes. Substitution costs refer to the price differentials between the SUPs that would have been sold in the absence of the Regulations and the substitutes that are expected to take their place in the policy scenario, after accounting for demand reduction and the exemptions for SUP straws.
Figure 4. Substitution cost monetization framework
Note: Areas are not to scale and the diagram is illustrative only.
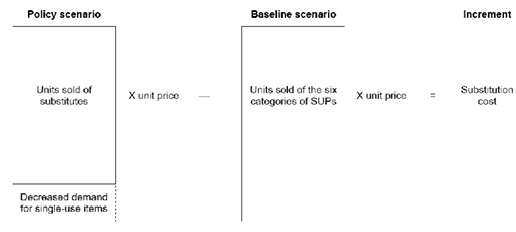
While the unit price of any one single substitute is relatively small (i.e., ranging from $0.01 for a single-use wood stir stick to up to $0.36 for a single-use cardboard substitute to a ring carrier), the total substitution costs per year for the Regulations are expected to be significant, given that these substitutes will replace around thirty billion SUP items annually, or around 800 SUP items per Canadian. As depicted in Table 11, the substitution cost for five of the categories of SUPs (excluding checkout bags) is estimated to be $173 million in the first year of full policy stringency (2024) or $1.6 billion over the analytical period (2023 to 2032). Those costs represent $4.49 per capita in 2024 or $41.94 per capita over the analytical period.
| Item category | First year of full policy stringency (2024) | Total analytical period (2023–2032) |
|---|---|---|
| SUP cutlery | 75 | 702 |
| SUP foodservice ware made from or containing problematic plastics | 14 | 114 |
| SUP ring carriers | 33 | 298 |
| SUP stir sticks | 4 | 37 |
| SUP straws | 48 | 462 |
| Total | 173 | 1 612 |
Substitution cost and secondary-use cost for SUP checkout bags
The Regulations are expected to result in an estimated 152 billion fewer units of SUP checkout bags sold over the analytical period (Table 6). In contrast to the five other categories of SUPs, the analysis for checkout bags considers substitution into reusable options alongside single-use paper substitutes. The Department of Natural Resources commissioned a report that was delivered in March 2021 to assess the potential impact of the Regulations on Canadian fibre-based packaging manufacturers (not available publicly). The report concluded that single-use paper checkout bags are only expected to replace a minority of baseline sales for SUP checkout bags, with the majority replaced by reusable checkout bags. This finding is consistent with case studies in other countries.
Reusable checkout bags vary in material, quality and price. The analysis only considers the unit price of relatively cheap reusable checkout bags (made of plastics) rather than other more expensive styles (e.g., made of cotton). In this way, the analysis estimates a minimum-cost way of achieving the expected substitution into reusable checkout bags. Of course, even a cheaper-end reusable checkout bag is many times more expensive than one SUP checkout bag. The average price of one reusable checkout bag can be divided by its theoretical number of uses (assumed to be 100) to obtain a low-end estimated “cost per use” (essentially, a straight-line amortization), which allows for the direct comparison of individual uses of reusable checkout bags against single-use counterparts. Using this methodology, the price per use of a reusable checkout bag is approximately 5.6 times less than the unit price of one SUP checkout bag.
Substitution cost for checkout bags cannot be considered in isolation from secondary-use cost. While SUP checkout bags are designed to become waste after their single use is fulfilled, it is common for individuals to hold on to these bags to use them in secondary applications (i.e., beyond the primary application of facilitating the transport of purchased goods from a retail setting). Some common secondary uses of SUP checkout bags are as trash bin liners, pet waste bags, to hold packed lunches, or to hold a change of clothes. Estimates in the literature of the secondary-use rate of SUP checkout bags as trash bin liners vary, but tend to fall in the range of 12% to 22%.footnote 62 The analysis considers the cost to substitute SUP checkout bags, in their secondary application as a trash bin liners, with plastic garbage bags (Figure 5).
Figure 5. Secondary-use cost monetization framework: SUP checkout bags as trash bin liners
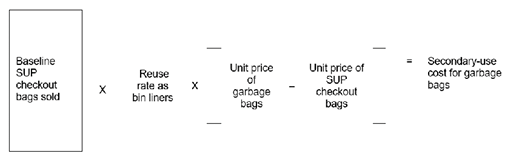
As the Regulations are expected to result in a higher quantity of single-use paper checkout bags available for secondary use, some consideration is also needed for the potentially offsetting effect of secondary usage of single-use paper checkout bags as either trash bin liners or compost bin liners. Given the uncertainty with respect to several analytical parameters (e.g., expected proportion of baseline sales for SUP checkout bags that will be replaced by single-use paper checkout bags, reuse rates for single-use paper checkout bags, composting availability and habits), a break-even analysis is performed to determine the unit price that consumers would need to pay for paper bags in order for all costs related to SUP checkout bags (i.e., substitution cost plus secondary-use cost) to break even. Scenarios for this break-even analysis are presented in Table 12.
| Substitution rate: SUP to single-use paper table d5 note a | Substitution cost table d5 note b | Break-even price for paper bags (low scenario) table d5 note c | Break-even price for paper bags (high scenario) table d5 note d |
|---|---|---|---|
| 0.30 | -$111M | -$0.07 | $0.11 |
| 0.35 | -$75M | -$0.01 | $0.12 |
| 0.40 (central) | -$39M | $0.03 | $0.13 |
| 0.45 | -$3M | $0.06 | $0.13 |
| 0.50 | $33M | $0.09 | $0.14 |
Table d5 note(s)
|
|||
Assuming that 40% of baseline SUP checkout bag sales are substituted by single-use paper checkout bags (central case), paper bags would need to cost at least $0.03 to break even under a “low scenario,” and $0.13 under a “high scenario.” The historic unit price for single-use paper checkout bags (presented in Table 2 in the “Background” section) is $0.08. Since paper bags purchased from a store, such as composting bin liners, are typically more expensive than the single-use paper checkout bags that would accompany groceries, the likelihood of breaking even is expected to be reasonably high.
Waste-management costs
The Regulations are expected to prevent an estimated 1.5 million tonnes of plastics from entering the waste stream over the analytical period, but will also add an estimated 2.9 million tonnes of other materials to the waste stream from the use of substitutes, due to their increased unit weights relative to SUPs. The reduction in tonnage entering the waste stream represents a savings in avoided costs to waste management of the six categories of SUPs. However, the increase in tonnage from substitutes to the six categories of SUPs represents an increase in costs to waste management. The costs presented in this subsection are overall costs to manage net additional waste, which may fall on municipalities or producers, depending on the local regulations or extended producer responsibility programs in place. When waste management costs are absorbed by producers, they would be expected to be passed onto consumers, and when absorbed by municipalities, onto tax payers.
The analysis considers three waste managementfootnote 63 pathways for modelling the waste management incremental costs and avoided costs: landfilling, recycling, and composting. Figure 6 shows the pathways for the six categories of SUPs and their readily available substitutes. The rates at which waste is diverted to each pathway differ by category of SUP and material. The ability of waste to be appropriately diverted depends on the capacity of the infrastructure available.
| Landfill |
Recycling |
Composting |
|---|---|---|
Reduction in plastic for six categories of SUPs Single-use paper substitutes Single-use wood substitutes Single-use substitutes made of plastic Reusable checkout bags made of plastic Single-use moulded fibre substitutes Single-use aluminum substitutes |
Reduction in plastic for six categories of SUPs Single-use paper substitutes Single-use substitutes made of plastic Reusable checkout bags made of plastic Single-use aluminum substitutes |
Single-use paper substitutes Single-use wood substitutes Single-use moulded fibre substitutes |
Incremental costs are calculated as the net of savings or avoided costs of waste management from reducing the tonnage of waste entering the waste stream from the six categories of SUPs, plus the associated increase in costs to waste management from an increase in tonnage from substitutes to the six categories of SUPs. The following aspects are considered for both SUPs and substitutes (where applicable): incremental tonnage for each material, diversion rates for each disposal pathway by item category and material, cost per tonne of collecting, transporting, sorting and disposing of waste, and price of post-consumer material for materials being recycled and composted. The cost per tonne of collecting, transporting, sorting and recycling plastic waste is based on the 2019 Deloitte Study, while the cost per tonne of collecting, transporting, sorting and recycling or composting waste from other substitute materials is estimated from various publicly available reports, studies and Canadian municipal websites on waste management. The analysis also considers value recovery for the recycling and composting pathways. Post-consumer pricefootnote 64 per tonne of plastic (reduction in the six categories of SUPs and increase in substitute plastic), paper and aluminum is used to estimate the value recovery for the recycling pathway and post-consumer price per tonne of paper, moulded fibre and wood is used to estimate value recovery for the composting pathway. The costs associated with waste management are purely from costs to process the materials. Other costs such as negative externalities from landfills (e.g., visual aesthetic, residual odour) are not included in the analysis.
SUP checkout bags can clog recycling machinery, causing delays.footnote 65 The analysis also estimates cost savings associated with reducing such delays. The general methodology for estimating incremental costs to waste management is presented in Figure 7 (note: areas are not to scale, diagram is illustrative only). The estimation of costs per tonne of waste diverted into each of the three pathways is very similar, with the main difference being the consideration of value recovery for waste being recycled or composted. This is estimated for each of the six categories of SUPs and their readily available substitutes.
Figure 7. Waste management cost monetization framework
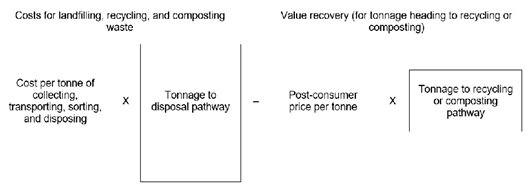
The reduction in tonnage of waste from the six categories of SUPs represents a decrease in costs to waste management in general, while the associated increase in tonnage of waste from substitutes represents an increase in costs. Despite the greater abundance of materials with value recovery, the Regulations are expected to generate net waste management costs given that the price per tonne of post-consumer materials is much lower than the cost per tonne of collecting, transporting, sorting, and disposing of waste.
As presented in Table 13, the expected net waste management cost is estimated to be $20 million in the first year of full policy stringency (2024) or $193 million over the analytical period (2023 to 2032). These costs represent an estimated $0.53 per capita in 2024 or $5.02 per capita over the analytical period. The majority of the cost savings from the reduction in tonnage of waste from the six categories of SUPs is attributable to SUP checkout bags, while the majority of the increased costs from the increase in tonnage of waste from substitutes is attributable to single-use paper checkout bags.
| Item category | First year of full policy stringency (2024) | Total analytical period (2023–2032) |
|---|---|---|
| Six categories of SUPs | -75 | -720 |
| Substitutes to the six categories of SUPs | 95 | 913 |
| Total incremental costs to waste management | 20 | 193 |
Costs to manufacturers of the six categories of SUPs
While the earliest prohibitions on manufacture of the six categories of SUPs will come into force 6 months after registration of the Regulations, outreach with select manufacturers revealed that many businesses have already seen reduced domestic demand since the pre-publication of the Regulations in the Canada Gazette, Part I, in December 2021. Some businesses have pre-emptively ceased production of the six categories of SUPs. By the time the prohibition on manufacture comes into force, a significant proportion of the impacts to Canadian manufacturers will have already occurred, given the ongoing shift to substitutes by businesses and consumers, a trend that is expected to accelerate once the Regulations are registered.
The Department estimates that 60% of total domestic manufacturing of the six categories of SUPs are sold domestically, while the other 40% are exported to foreign markets. Departmental data suggests that over 90% of all exports of single-use products, which include the six categories of SUPs, are sold to the United States. While Canadian manufacturers (alongside importers) will lose the domestic market once the prohibition on manufacture comes into force, the exemption on manufacture for the purpose of export will remain in effect until 42 months after the Regulations are registered. This provision will provide manufacturers flexibility to maintain production of the six categories of SUPs for a set period of time to ease their transition away from these specific products. The exemption period will also allow them time to identify other plastics manufacturing opportunities, retool their production lines, and commercialize new products. This approach is expected to minimize the scale of possible obsolete and underutilized production assets by businesses.
A business transitioning production to other goods may incur costs related to market development, production line planning, purchasing new equipment, installation, training, and marketing. Some businesses could also decide to permanently shut down production lines or production facilities. Production lines or facilities that shut down or become underutilized could lead to job losses. No broad impacts are expected for the job market, as most affected employees would likely relocate to other employment opportunities within the manufacturing sector and within the same geographic region.
While the impacts of obsolescence and underutilization of production assets and the cost of transitioning to the manufacture of other products will be unique to each business, the analysis applies expected forgone profit at the sectoral level as a proxy to estimate these costs.footnote 66 The analysis assumes an average profit margin for the plastic manufacturing sector of 15%. The analysis also assumes a five-year linear reduction in forgone profit opportunity, on the assumption that profit opportunity will recover as businesses transition into new markets (Table 14).
| Forgone profit opportunity | 2023 | 2024 | 2025 | 2026 | 2027 | 2028 | 2029 | 2030 | 2031 | 2032 |
|---|---|---|---|---|---|---|---|---|---|---|
| Manufacture for domestic sale | 80% | 60% | 40% | 20% | 0 | 0 | 0 | 0 | 0 | 0 |
| Manufacture for export | exports allowed | exports allowed | exports allowed | 80% | 60% | 40% | 20% | 0 | 0 | 0 |
Using the estimated profit margin and the assumed linear reduction in forgone profit opportunity, the Regulations are expected to cost manufacturers of the six categories of SUPs an estimated $176 million over the analytical period (2023 to 2032), comprised of $106 million from the prohibition on manufacture for domestic sale and $70 million from the removal of the exemption on manufacture for the purpose of export 42 months after the registration of the Regulations (Table 15).
| Forgone profit opportunity | First year of prohibition on manufacture (2023) | First year of removal of export exemption (2026) | Total analytical period (2023–2032) |
|---|---|---|---|
| Manufacture for domestic sale | 43 | 10 | 106 |
| Manufacture for export | 0 | 28 | 69 |
| Total | 43 | 38 | 176 |
Life cycle assessment
One recognized approach to measuring the broad impacts of any manufactured item is through a life cycle assessment (LCA). As the name suggests, LCAs provide a modelling approach that considers a manufactured item’s complete life cycle, from cradle to grave, including the upstream stage (e.g., natural resource extraction, manufacturing, transportation), the use stage (intended use by the end-user) and the downstream stage (e.g., disposal). Results are based on whichever environmental effects are identified for assessment, such as climate change, air quality, water quality, or biodiversity. Since these impacts go beyond the scope of the cost-benefit analysis for the Regulations, a literature review of LCAs covering the six categories of SUPs and their readily available substitutes is presented in the “Strategic environmental assessment” section.
Perceived utility loss (from consumer preferences)
Substitutes to the six categories of SUPs perform an equivalent function to the SUPs they replace. For instance, a single-use paper checkout bag and a reusable checkout bag perform the same function as a SUP checkout bag: carrying purchased goods away from a retail setting. While SUPs and their substitutes are functionally equivalent, some consumers may have preferences for certain materials over others, and therefore, may not derive the same satisfaction from using SUP substitutes relative to SUPs. For example, on the negative side, certain single-use wood cutlery may produce a subtle but detectable taste relative to SUP varieties, and certain single-use paper straws may become soggy after sitting in liquid for an extended period of time, both of which could detract from the user’s experience. On the other hand, some consumers may find that certain SUP substitutes increase their user satisfaction. For example, while some consumers may be inconvenienced by bringing (and remembering to bring) their own reusable checkout bags to a retail setting, others may enjoy their greater durability and lower likelihood of breakages, relative to SUP checkout bags. It is also possible that some consumers may derive additional satisfaction from using substitutes to SUPs through the knowledge that their consumption did not contribute to the proliferation of plastic waste. For some consumers, the increased satisfaction gained from using items that are not ecologically hazardous may outweigh losses to the user experience. Whether the Regulations will result in a net satisfaction loss or a net satisfaction gain depends on consumer preferences and behaviour change, both now and how they will evolve over time.
Administrative costs
The Regulations require any business that manufactures or imports any of the six SUPs for the purpose of export or re-export to keep a record (such as an invoice, contract or bill of lading) of the information and supporting documents establishing that the item has been or will be exported, as well as provide the records if requested by the Department. The Department expects that manufacturers and importers already collect the required information as part of their current business activities. Therefore, the Regulations will not result in new administrative costs stemming from this requirement. Businesses are required to keep these administrative records for a period of at least five years. Should these records be requested by the Department’s enforcement officers during any site visits or remotely, that retrieval would be expected to take between two and four hours of work from the business manufacturing or importing any of the six categories of SUPs for export. Associated undiscounted costs are expected to total around $3 000 per year for the years the manufacture for export exemption applies.
Familiarization with the administrative regulatory requirements and dissemination of the information is expected to take a person 30 minutes for a total one-time cost of $36.47 per manufacturing or importing firm.footnote 67 Familiarization with the administrative regulatory requirements and dissemination of the information, which will apply to approximately 250 000 businesses, is expected to take a person 15 minutes for a total one-time cost of $4.77 or $11.77 for businesses selling or offering any of the six SUPs, depending on if they are a small or a large business.footnote 68 This undiscounted one-time cost is expected to total an estimated $1.2 million. All administrative costs are summarized in Table 16.
| Requirement | Total one-time cost ($2021, undiscounted) | Total annual cost ($2021, undiscounted) |
|---|---|---|
| Familiarization with the administrative requirements | $1.2M | $0 |
| Responding to information requests from the Department | $0 | $3 000 |
The total discounted administrative costs to all businesses over the analytical period (2023 to 2032) is estimated at $1.2 million (present value, 2021 dollars, discounted to base year 2022 at 3%).
Government costs
The Department will incur incremental costs related to training, compliance and promotion activities, inspections, investigations, and measures to deal with any alleged violations. Specifically, an estimated one-time cost of $170 000 will be required to train enforcement officers, with an additional cost of $33 000 per year for administration, coordination and analysis to support enforcement activities. Ongoing enforcement costs will vary depending on the number of inspections performed by the Department’s enforcement officers and will include inspections (which include operations and maintenance, transportation and sampling costs for reusable plastic checkout bags, reusable plastic straws and reusable plastic cutlery), measures to deal with alleged violations (e.g., warnings, environmental protection compliance orders and injunctions), investigations, and prosecutions. These costs are expected to gradually decrease from $1.5 million per year in the first year of full policy stringency (2024) to $0.74 million per year from 2028 onward.
The total discounted government costs in the first year of full policy stringency (2024) is estimated at $1.5 million or $7.5 million over the analytical period (2023 to 2032) (present value, 2021 dollars, discounted to base year 2022 at 3%).
Distributional analysis
Consumers
Tens of millions of units of the six categories of SUPs are used and disposed of by Canadians on a daily basis. In 2019, each Canadian used an estimated 800 SUPs on average, or about two SUPs on a daily basis (Table 1). As SUP checkout bags, SUP cutlery, SUP foodservice ware made from or containing problematic plastics, SUP ring carriers, SUP stir sticks, and SUP straws are commonly used items throughout the economy, most Canadians are expected to be impacted by the Regulations. Under the Regulations, Canadians will use and dispose of comparatively more single-use (or reusable) substitutes to the SUPs overall, but in some instances, SUPs may not be replaced by another single-use product (e.g., not asking for a straw). The expected substitution cost associated with the Regulations is estimated to be $4.49 per Canadian in the first year of full policy stringency (2024) or $41.94 per Canadian over the analytical period (2023 to 2032). As detailed in the “Gender-based analysis plus” section, the substitution cost may be felt more acutely by Canadians with low-income and limited disposable income, as most of the cost of implementing the ban is expected to be passed on from retailers to consumers through increased prices for food, beverages and store merchandise.
All substitution costs are expected to be passed onto consumers once the Regulations come into force. The majority of SUP cutlery, SUP foodservice ware made from or containing problematic plastics, and SUP stir sticks are purchased by consumers in conjunction with food or beverage purchased in restaurants, cafés, or other facilities providing those services. Currently, the price of these items is usually embedded in the price of the overall transaction and represents only a small fraction of it. For SUP checkout bags, substitution costs are also expected to be borne by consumers, either directly (i.e., a per-paper bag fee charged by the retailer) or indirectly (i.e., embedded in the price of goods purchased from the retailer). Consumers will also face substitution costs directly if they were to buy packages of any of the substitutes from a store, as well as any purchase of beverages that previously contained a SUP ring carrier, as these beverages will be purchased in tandem with the substitute carrier.
Businesses selling or offering any of the six categories of SUPs
The Department estimated that the Regulations could impact up to 250 000 businesses selling or offering any of the six categories of SUPs in Canada, of which, around 242 000 are considered to be small businesses as defined in the Treasury Board Secretariat’s Policy on Regulatory Development (see the “Small business lens” section for further analysis).
Around 40% of these businesses are in the retail sector, and therefore, mostly impacted by the Regulations through the ban on SUP checkout bags. Some of these businesses sell at least one of the six categories of SUPs directly to consumers. These businesses will be able to sell any single-use or reusable substitute instead and, therefore, should not be impacted by the regulatory prohibitions. Businesses in the accommodation and foodservices sector represent around 35% of all the businesses that potentially sell or offer any of the six categories of SUPs. Many of these businesses are expected to sell more than one of the six categories of SUPs. For example, a quick-service restaurant could be offering SUP checkout bags, SUP cutlery, SUP foodservice ware made from or containing problematic plastic, SUP stir sticks, and SUP straws. The healthcare and social assistance sector comprises around 15% of potentially affected businesses where businesses will still be able to offer flexible plastic straws to patients or residents requiring it. The remaining 10% is split between the art, entertainment, and recreation sector, the transportation sector, and the wholesale trade sector. The geographic distribution of these 250 000 businesses selling or offering any of the six SUPs is mostly in line with Statistic Canada’s population estimate by province.footnote 69
As discussed in the “Consultation” section, the coming- into-force periods of the prohibition on sale for the six categories of SUPs are expected to give sufficient time for businesses to deplete their stockpiles and secure substitutes, thereby avoiding stranded inventory.
Businesses manufacturing any of the six categories of SUPs
Based on data acquired from a market analytics firm and further validation through engagement during the pre-publication consultation period, the Department identified 112 unique businesses potentially manufacturing at least one of the six categories of SUPs as of March 2021.footnote 70 Of these 112 businesses, six are also importing at least one of the six categories of SUPs. Around 80% of the facilities that manufacture these SUPs are located in Quebec and Ontario and 10% are located in Alberta and British Columbia. Sixty-four of these businesses are estimated to be small businesses (see the “Small business lens” section for further analysis).
The majority of the 112 unique businesses manufacture only one category (83%) or two categories (12%) of SUPs. Of the 67 businesses that manufacture SUP checkout bags, 60 produce that category of SUPs exclusively (Table 17). Of the 45 businesses that manufacture foodservice ware made from or containing problematic plastics, 30 produce that category of SUPs exclusively. The majority of businesses that manufacture SUP straws, SUP cutlery, SUP stir sticks, or SUP ring carriers produce more than one category of SUPs. While it is possible to estimate the total revenue for most of the 112 unique businesses manufacturing the SUPs that will be prohibited or restricted under the Regulations, it is not possible to estimate the share of that revenue that is attributable to the manufacture and sale of the SUPs.
| Item category | Straws | Checkout bags | Cutlery | Foodservice ware made from or containing problematic plastics | Stir sticks | Ring carriers | Total |
|---|---|---|---|---|---|---|---|
| Large businesses | 6 | 24 | 6 | 23 | 3 | 0 | 62 |
| Small businesses | 4 | 43 | 7 | 22 | 4 | 1 | 81 |
| Total | 10 | 67 | 13 | 45 | 7 | 1 | 143 table e2 note a |
Table e2 note(s)
|
|||||||
Businesses producing more than one category of SUPs could be disproportionately impacted by the prohibitions on manufacture as they’ll have to pivot out of more products line. Similarly, businesses having a higher share of their revenues coming from these streams will lose, at least temporally, a greater share of their cash flow, which could reduce their capacity to transition to producing other products. Small and medium-sized enterprises may face a higher burden, as they are typically less diversified, and therefore could face more difficulties in planning, financing, and implementing their transition to the production of new products. As discussed in the “Consultation” section, the prohibition on manufacture will come into force for SUP checkout bags, cutlery, foodservice ware made from or containing problematic plastics, stir sticks and straws (except for SUP flexible straws) six months after the Regulations are registered and 12 months after registration for SUP ring carriers, and removal of the exemption on manufacture for export will come into force 42 months after the Regulations are registered. These provisions will also offer more flexibility to businesses that already have exposure to foreign markets compared to businesses predominantly selling their products domestically. While accounting for all these considerations, some businesses could decide to permanently shut down production lines and/or production facilities.
Businesses importing any of the six categories of SUPs
Based on the Canadian Importers Database,footnote 71 the Department estimated 128 unique businesses potentially imported at least one of the six categories of SUPs in 2019, of which six could also have manufactured at least one of the six categories of SUPs as described in the previous subsection. Forty-one of these businesses are considered to be small businesses (see the “Small business lens” section for further analysis). Of the 128 businesses, 44% only import one category of SUPs, 10% import two categories, 17% import three categories, and 29% import four or more categories. The impact of the Regulations on businesses importing any of the six categories of SUPs will be minimal, as these businesses could switch supply lines to import single-use (or reusable) substitutes that comply with the Regulations.
Businesses manufacturing single-use substitutes to the six categories of SUPs
The Department of Natural Resources commissioned a report that was delivered in March 2021 to assess the potential impact of the Regulations on Canadian fibre-based packaging manufacturers (available upon request). The report’s conclusions suggest that the regulatory prohibition on SUP checkout bags will have to provide a sufficient increase in sales volume of fibre-based substitutes to Canadian manufacturers in order for them to consider seizing the market opportunity. The regulatory prohibitions on foodservice ware could also create an opportunity for fibre substitutes, but this opportunity is less certain due to the smaller market and investment needed to achieve required performance characteristics with fibre substitutes.
The report showed that demand for paper bags per capita has decreased by 80% since the 1970s, as public opinion took on deforestation concerns in the 1990s, but experienced a slight increase in demand in the 2010s as public opinion turned toward the issue of plastic pollution. As shown in the “Benefits and costs” section, the regulatory prohibitions could result in an increase of more than 200 000 tonnes in single-use paper bags in 2024. Regardless, the report suggests that Canada’s two main producers of kraft paper (the paper used to make paper checkout bags), one located in Manitoba, the other located in British Columbia, may decide not to produce more kraft paper as a result of the Regulations.
As an indirect outcome of the Regulations, the report suggests that new demand for kraft paper to make single-use paper checkout bags could be met by domestic production by firms in the declining market of graphic papers and firms with idled mills, which have a combined excess production capacity of 200 000 tonnes. To make the switch to producing single-use paper checkout bags, these firms would need to make a small capital expenditure. The report concluded that additional demand for single-use paper checkout bags could also be met easily by imports from the United States.
Cost-benefit statement
- Number of years: 10 years (2023 to 2032)
- Base year for costing: 2021
- Present value base year: 2022
- Discount rate: 3%
| Impacted stakeholder | Description of cost | 2023 | 2024 | 2032 | Total (2023–2032) | Annualized value |
|---|---|---|---|---|---|---|
| Canadians | Substitution (for all items except checkout bags) | $123 | $173 | $159 | $1 612 | $189 |
| Substitution and secondary use (for checkout bags) | Break-even | Break-even | Break-even | Break-even | Break-even | |
| Waste management | $15 | $20 | $19 | $193 | $23 | |
| Manufacturers | Forgone profit opportunity | $43 | $32 | $0 | $176 | $21 |
| Manufacturers, importers, and retailers | Administrative | $0.01 | $1.2 | $0.0 | $1.2 | $0.1 |
| Government | Compliance and enforcement | $0.3 | $1.5 | $0.6 | $7.5 | $0.9 |
| All stakeholders | Total costs | $181 | $228 | $179 | $1 990 | $234 |
| Impacted stakeholder | Description of benefit | 2023 | 2024 | 2032 | Total (2023–2032) | Annualized value |
|---|---|---|---|---|---|---|
| Canadians | Avoided terrestrial litter clean-up cost | $45.7 | $60.6 | $58.3 | $580.9 | $68.1 |
| Avoided marine pollution cost | $2.8 | $3.7 | $3.6 | $35.6 | $4.2 | |
| All stakeholders | Total benefits | $48.5 | $64.3 | $61.9 | $616.5 | $72.3 |
| Impacts | 2023 | 2024 | 2032 | Total (2023–2032) | Annualized value |
|---|---|---|---|---|---|
| Total costs (in millions of dollars) | $181 | $228 | $179 | $1 990 | $234 |
| Total monetized benefits (in millions of dollars) | $48 | $64 | $62 | $616 | $72 |
| Net monetized impact — net cost (in millions of dollars) | $133 | $164 | $117 | $1 374 | $162 |
| Quantified reduction in plastic waste (tonnes avoided) | 92 086 | 125 403 | 151 384 | 1 334 291 | 133 429 |
| Net non-monetized impact: benefits to wildlife and humans in the form of reduction in plastic pollution (tonnes avoided) | 1 520 | 2 073 | 2 501 | 22 048 | 2 205 |
As shown in Table 18, the Regulations are expected to result in $228 million in costs in the first year of full policy stringency (2024), or $2 billion in costs over the analytical period (2023 to 2032). While these costs are significant in aggregate, they will be widely dispersed across Canadian consumers (around $5 per capita in 2024 or around $50 per capita over the analytical period). Some consumers may feel the burden of these costs more than others, though these distributional impacts are expected to be relatively minor, especially given the exemptions for SUP flexible straws for accessibility purposes. This and other factors are explored in the “Gender-based analysis plus” section. All costs (except administrative and government costs) are assessed at the consumer level. The prohibitions on manufacture of the six categories of SUPs are expected to result in $176 million in costs to Canadian manufacturers over the analytical period.
As shown in Table 19, the Regulations are expected to result in $64 million in monetized benefits in the first year of full policy stringency (2024), or $616 million in monetized benefits over the analytical period (2023 to 2032), stemming mainly from the avoided cost of terrestrial litter clean-up. As shown in Table 20, the costs and monetized benefits of the Regulations will total $164 million in net cost in the first year of full policy stringency (2024), or $1.4 billion in net cost over the analytical period (2023 to 2032).
While the Regulations are expected to result in a total net cost with respect to monetized impacts, the most significant benefit is non-monetized; namely, the reduction in risk of harm to wildlife and their habitats from less plastic pollution. As shown in Table 19, the Regulations are expected to result in 125 403 avoided tonnes of plastic waste in the first year of full policy stringency (2024) or 1.3 million tonnes over the analytical period (2023 to 2032), of which 2 073 tonnes (2024) or 22 048 tonnes (2023 to 2032) represents avoided plastic pollution. By item count, those values translate to around 28 billion units of avoided plastic waste in the first year of full policy stringency (2024) or around 295 billion units over the analytical period (2023 to 2032), of which 338 million units (2024) or 3.6 billion units (2023 to 2032) represents avoided plastic pollution. Given the extent of ecological harm that the six categories of SUPs becoming plastic pollution can cause to wildlife and their habitats, and the reduction of enjoyment of ecological goods and services by Canadians, the associated non-monetized benefits are expected to be significant.
These results are reflective of comments received during 70-day public consultation period relating to the cost-benefit analysis.
Sensitivity analysis
There are several parameters and assumptions impacting the results presented in Table 20. The most sensitive factors affecting the cost-benefit analysis results are those explored in the scenario analyses presented in Table 10 in the “Avoided terrestrial litter clean-up costs” subsection and in Table 12 in the “Substitution cost and secondary-use cost for SUP checkout bags” subsection of the “Benefits and costs” section. Tables 21 through 24 present monetized and discounted cost and benefits for a few additional scenarios.
| Impacts | 3% (central case) | 0% | 7% |
|---|---|---|---|
| Total costs (millions of dollars) | $1 990 | $2 338 | $1 633 |
| Total monetized benefits (millions of dollars) | $616 | $729 | $501 |
| Net monetized impact — net costs (millions of dollars) | $1 374 | $1 609 | $1 132 |
| Net non-monetized impact: benefits to wildlife and humans in form of reduction in plastic pollution (tonnes avoided) | 22 048 | 22 048 | 22 048 |
| Impacts | 100 (central case) | 50 | 200 |
|---|---|---|---|
| Total costs (millions of dollars) | $1 990 | $2 010 | $1 980 |
| Total monetized benefits (millions of dollars) | $616 | $613 | $618 |
| Net monetized impact — net costs (millions of dollars) | $1 374 | $1 397 | $1 362 |
| Net non-monetized impact: benefits to wildlife and humans in form of reduction in plastic pollution (tonnes avoided) | 22 048 | 20 875 | 22 635 |
| Impacts | 0% (central case) | 1% | 2% |
|---|---|---|---|
| Total costs (millions of dollars) | $1 990 | $1 777 | $1 577 |
| Total monetized benefits (millions of dollars) | $616 | $616 | $616 |
| Net monetized impact — net costs (millions of dollars) | $1 374 | $1 161 | $961 |
| Net non-monetized impact: benefits to wildlife and humans in form of reduction in plastic pollution (tonnes avoided) | 22 048 | 22 048 | 22 048 |
Table e8 note(s)
|
|||
| Impacts | $15 (central case) | $20 | $30 |
|---|---|---|---|
| Total costs (millions of dollars) | $1 990 | $1 990 | $1 990 |
| Total monetized benefits (millions of dollars) | $616 | $800 | $1 197 |
| Net monetized impact — net costs (millions of dollars) | $1 374 | $1 190 | $793 |
| Net non-monetized impact: benefits to wildlife and humans in form of reduction in plastic pollution (tonnes avoided) | 22 048 | 22 048 | 22 048 |
Small business lens
Analysis under the small business lens concluded that the Regulations will impact small businesses that will be prohibited from manufacturing, importing, or selling any of the six categories of SUPs, with limited exemptions as presented in the “Description” section. The Regulations will impact an estimated 242 000 businesses that sell or offer these SUPs, 64 businesses that manufacture them, and 43 businesses that import them. Additional flexibility to limit the burden on small businesses is not appropriate, as the environmental objective of the Regulations could not be met unless all SUPs subject to the Regulations are prohibited.
The administrative costs incurred by small businesses include those presented in the “Administrative costs” subsection of the “Benefits and costs” section. All of the 242 107 small businesses will incur costs related to familiarization with the administrative requirements, while the 107 small businesses that manufacture or import any of the six categories of SUPs will also incur costs related to responding to information requests from the Department.
The Regulations are not expected to result in any direct compliance cost to small businesses that sell or import any of the six categories of SUPs, since substitution costs will be expected to be ultimately absorbed by consumers and since importers can import other products, including substitutes to the six categories of SUPs.
The Regulations could result in compliance costs for small businesses that manufacture any of the six categories of SUPs, depending on the business decisions made as a result of the Regulations. Compared to the baseline scenario, small businesses that manufacture any of the six categories of SUPs will face a decrease in demand for these products under the Regulations. However, some may decide to retool their production lines to manufacture plastic items that will not be prohibited under the Regulations. The costs associated with transitioning to other product lines will be different for each business and some may be more impacted than others and face higher costs. The temporary exemption on manufacture for export will provide businesses time to adjust to the changing requirements while maintaining some production.
The estimate of forgone profit opportunity in the “Impacts to manufacturers of the six categories of SUPs” subsection of the “Benefits and costs” section affects small businesses. However, the proportion of the forgone profit opportunity costs that is attributable to small businesses is not known. Some small businesses that manufacture any of the six categories of SUPs may experience more forgone profit than others as a result of the prohibition on manufacture and the expiry of the exemption on manufacture for the purpose of export.
In its submission to the Department during 70-day consultation period, the Canadian Federation of Independent Businesses shared the results of a survey it conducted with its members (small businesses). The survey showed that 44% of small businesses supported the ban, both in principle and in practice in 2022, which is a decrease in support (compared to 67% in 2019). In addition, 26% supports the ban in principle, but not in practice due to cost and timing. According to this survey, almost three in ten (29%) small businesses continued to use single-use plastics as of February 2022. While some small businesses stopped using them before the federal ban was announced, an additional four percent have stopped since the ban was announced.
Inputs into the calculation and relevant assumptions for administrative costs, including for small businesses, are presented in the “Administrative costs” subsection and the “Distributional analysis” subsection of the “Benefits and costs” section.
Small business lens summary
- Number of small businesses impacted: 242 107
- Number of years: 10 (2023 to 2032)
- Base year for costing: 2021
- Present value base year: 2022
- Discount rate: 3%
| Description of cost | Annualized value | Present value |
|---|---|---|
| Compliance cost | $0 | $0 |
| Administrative cost | $128 542 | $1 096 490 |
| Total costs | $128 542 | $1 096 490 |
| Average cost per small business | $0.53 | $4.53 |
One-for-one rule
The one-for-one rule applies since there is an incremental increase in the administrative burden on business as a result of a new regulatory title being introduced. The administrative costs to business include familiarization with the administrative requirements and responding to information requests from the Department. Inputs into the calculation and relevant assumptions are presented in the “Administrative costs” subsection of the “Benefits and costs” section. These costs were adjusted from 2021 dollars to 2012 dollars for the purpose of calculating the increase in the administrative burden under the one-for-one rule. Using 2012 constant dollars, with 2012 as the base year, a 10-year timeframe from the year of registration (i.e., 2022 to 2031), and a 7% discount rate, the annualized average increase in the administrative burden on businesses is estimated at $ 63 357 or an average of $0.25 per business, as calculated using the Treasury Board Secretariat’s Regulatory Cost Calculator tool.
Regulatory cooperation and alignment
Aligning with current best practices
Plastic waste and plastic pollution is a global issue, while markets for SUPs are highly integrated globally, particularly between Canada and the United States. Recognizing these important considerations, the Department consulted extensively with government officials in other Canadian jurisdictions and international jurisdictions (United States, United Kingdom and the European Union) on their respective approaches to banning or restricting SUPs.
According to the United Nations, out of 192 countries reviewed, 127 have adopted some type of measure to regulate plastic bags including restrictions on the manufacture, distribution, trade, free retail distribution, or taxation. Twenty-seven countries have implemented legislation prohibiting either specific single-use products (e.g., plates, cups, straws) or materials (e.g., polystyrene) or limiting production levels. About 30 countries have instituted taxes on either the manufacture of plastic bags, on the distribution of plastic bags to consumers, on SUPs broadly through environmental tax or a combination of taxation methods. In 2019, the European Union enacted a SUPs directive, which included a list of SUPs to be banned by member states by 2021, and the United Kingdom enacted a similar measure in 2020.
There are currently no policy measures in place in the United States to restrict or eliminate the use of SUPs at the federal level, but several states including the states of California, Connecticut, Delaware, Maine, New Jersey, New York, Vermont, Oregon, and Washington have already enacted prohibitions on SUP checkout bags. California, Washington, New Jersey and Hawaii also have bans on SUP cutlery, while New Jersey, Vermont, Hawaii, Maryland and Maine have enacted bans on SUP foodservice ware. In addition, over 100 SUP bans at the municipal level either exist or are in development across the United States, including 58 on SUP checkout bags across Massachusetts and 12 on SUP straws across Florida. Although no government action on SUPs has been taken at the federal level, private-sector initiatives such as the United States Plastics Pact will influence the market. Launched in 2020, the Pact commits a number of major brand owners to reducing problematic plastic packaging and improving the recyclability of other plastic packaging, among other things. Most relevant to these Regulations, the Pact has identified SUP cutlery, straws and stirrers as well as non-detectable pigments such as carbon black, oxo-degradable additives, polystyrene (including expanded polystyrene), polyethylene terephthalate glycol in rigid packaging, and polyvinyl chloride (including polyvinylidene chloride) as problematic and unnecessary materials that to be eliminated by 2025, with some exceptions.
While the prohibitions on manufacture for export render the Regulations more stringent than those enacted thus far in peer jurisdictions, such prohibitions are in-line with numerous existing and upcoming prohibitions at the US state and local levels targeting many of the same SUPs as the Regulations. By prohibiting manufacture for export, the Regulations could demonstrate that Canada is a global leader on addressing the issue of plastic waste and pollution. This stance aligns with the intent of the 2022 resolution adopted by the United Nations Environment Assembly to work toward an international legally binding instrument to end plastic pollution. It could also help encourage national, regional, and local actions to reduce pollution stemming from other countries (e.g., from the US into the Great Lakes). It could further strengthen the market signal sent by the Regulations that harmful SUPs are not viable products over the long term, which could lead to change in certain export markets. For example, some importers of Canadian-made SUPs may choose to switch to substitutes rather than find another jurisdiction to continue supplying them with SUPs.
The information gathered throughout engagement activities informed the policy design and implementation approach of the Regulations to minimize regulatory differences with key trading partners and provinces and territories; align with existing standards and best practices; and build upon lessons learned from other jurisdictions, so as to minimize regulatory differences to the extent practicable. As an example, the Department consulted reusable bag vendors and gathered information from officials from the State of California to inform the development of performance thresholds for SUP checkout bags that align with the certification requirements for reusable bags in California, which is considered a North American industry standard. This approach will help minimize the cumulative regulatory burden on businesses operating in both the United States and Canada.
Cooperating with provinces, territories, and municipalities
Preventing plastic waste and pollution are matters of shared jurisdiction between the federal, provincial and territorial governments. Provinces and territories are key partners in addressing plastic waste and plastic pollution from SUPs. As of February 2022, several provinces and territories have measures in place that specifically address SUPs:
- Nova Scotia, Prince Edward Island, Newfoundland and Labrador and Yukon Territory banned SUP checkout bags;
- British Columbia enacted a regulation that empowers local governments to institute bans on plastic bags and other SUPs without provincial approval and amended its environmental protection legislation to allow it to develop province-wide bans;
- the Northwest Territories put in place a bag fee program for all types of single-use checkout bags (plastic and paper); and
- Quebec, Ontario, Alberta, British Columbia and New Brunswick have developed or are in the process of developing or amending extended producer responsibility policies to include SUPs, while Saskatchewan, Nova Scotia and Manitoba announced their intentions to do the same.
In addition, 125 local governments in Canada have enacted bylaws to prohibit, or restrict SUP checkout bags, though at least 17 of these laws were not yet in force as of February 2022. Some local governments have also enacted bylaws prohibiting, or restricting other SUPs, such as SUP straws (13 local governments), expanded polystyrene SUP takeout containers (10 local governments) and SUP cutlery (5 local governments).The Regulations will have implications for many of these provincial, territorial and municipal measures. Currently, the existing bans on SUPs function as a patchwork of rules that seek to address issues that are, in essence, national and international in scope. SUPs are typically sold into regional or national markets that are beyond the reach of provincial, territorial, or municipal bans. Only federal measures are capable of effectively preventing pollution and waste from the six categories of SUPs subject to the Regulations. The Regulations will also help rationalize and simplify the existing patchwork of measures that broadly align in terms of objectives (i.e., preventing waste and pollution), but also create many inconsistencies (e.g., what constitutes a reusable plastic checkout bag). The Regulations will address this patchwork by creating a single set of rules that are national in scope, reducing duplicative compliance and reporting obligations from multiple jurisdictions. This will help achieve many of the same objectives as the provincial, territorial, and municipal bans, while increasing regulatory certainty for business, in particular those operating in more than one Canadian jurisdiction. In addition, the Department is not expecting it to cause any conflicts with existing measures, as the Regulations have been designed to align with as many existing municipal and provincial measures as possible.
For straws, however, local government bylaws prohibiting or restricting certain SUP straws could be impacted if, for example, they allow or require restaurants to provide single-use plastic straws to customers upon request.
Provinces that have included SUPs in proposed or existing extended producer responsibility policies may see a reduction in the number of SUP items recovered. However, given that the Regulations will target SUP items that are both environmentally problematic and difficult to recycle, the effect on provincial extended producer responsibility policies is likely to be positive. Among other things, the removal of SUP items that are difficult to recycle from the waste stream will:
- shift demand to substitutes that can more easily be recovered through strategies such as recycling and composting;
- improve the efficiency of sorting and recycling processes by removing items that hamper machinery or fall into residual waste sent to landfill; and
- improve plastic recycling rates by eliminating many SUP items that are placed on the market but not successfully collected, sorted, or recycled.
Coordination efforts such as those described above will help minimize the cumulative regulatory burden on businesses associated with the Regulations.
International trade
The Government of Canada is committed to respecting its commitments in relation to international trade. The Department worked closely with other federal departments and agencies, including the Department of Foreign Affairs, Trade and Development, to ensure the Regulations comply with Canada’s existing trade obligations, including those under the Canada-United States-Mexico Agreement (CUSMA) and those under World Trade Organization agreements.
Strategic environmental assessment
Purpose of a strategic environmental assessment
In accordance with the Cabinet Directive on the Environmental Assessment of Policy, Plan and Program Proposals, a strategic environmental assessment (SEA) was completed for the Regulations in 2021. Among other things, a SEA:
- assesses the scope and nature of the potential environmental effects of a proposed policy, plan or program;
- identifies areas for mitigation or enhancement of negative or positive environmental effects;
- analyzes residual effects that may remain after mitigation; and
- proposes follow-up measures to monitor the environmental effects.
Approach taken to assess potential environmental effects
The SEA examined the potential environmental effects that could result from the restriction or elimination of the six categories of SUPs from the Canadian market. This included examining both the potential direct effects of reduced plastic waste and pollution, as well as potential effects at different points in the value chain that may be caused by increased consumption of substitutes, such as those made from substitute plastics, wood or paper. The Department drew from a broad range of evidence sources to conduct its analysis. This followed guidance issued by UNEP on life cycle approaches to addressing SUP products pollution. UNEP’s guidance states that “[life cycle assessment] provides important insights for policymakers, but these need to be supplemented with a range of additional studies and knowledge.” The Department therefore drew from available LCAs for the six categories of SUPs subject to the Regulations, as well as from litter data, scientific studies, the 2019 Deloitte Study, other reports on the environmental and value-recovery outcomes of the six categories of SUPs, and the Science Assessment of Plastic Pollution, among other sources. Figure 8 below shows the life cycle of SUPs and other single-use items.
| Life cycle stage | Description |
|---|---|
| First stage: Upstream stage |
|
| Second stage: Use stage | Intended use |
| Third stage: Downstream stage |
|
The approach taken in the SEA identified the six categories of SUPs subject to the Regulations, as well as substitute products that could feasibly be adopted in Canada at scale, and for which sufficient data was available to conduct an analysis. The substitute products analyzed in the SEA are described in Table 26.
| SUP product | Substitutes analyzed in the SEA table f2 note a table f2 note b |
|---|---|
| Checkout bags |
|
| Cutlery |
|
| Foodservice ware made from or containing problematic plastics |
|
| Ring carriers |
|
| Stir sticks |
|
| Straws |
|
Table f2 note(s)
|
|
The Department then drew from available LCAs to scope the various categories of environmental effects that could be analyzed at three stages in a product’s life cycle:
- the upstream stage (encompassing all activities before the end user);
- the use stage (encompassing all activities during a product’s use by the end user); and
- the downstream stage (encompassing all activities after a product’s use by the end user).
| Life cycle stage | Activities included | Environmental effects considered |
|---|---|---|
| Upstream stage |
|
|
| Use stage |
|
|
| Downstream stage |
|
|
The Department then applied the available evidence to assess potential environmental effects, positive and negative, that could result from the elimination or restriction of each of the categories of SUPs subject to the Regulations.
The assessment considered information available on potential environmental effects that will result from a reduction in the current levels of the six SUPs in commerce and a resulting increase in substitutes. This analysis was applied at each of the three stages mentioned above and was largely qualitative in nature, in particular due to inconsistencies between available LCAs, such as the substitutes analyzed, parameters pertaining to the data used and the environmental effects assessed. In addition, available litter data from different sources (e.g., shoreline clean-up data versus municipal litter audits) use different methodologies, categorizations and data standards, precluding quantitative analysis. LCAs were done for different jurisdictions, mostly non-domestic. Due to these inconsistencies, as well as other variables such as humidity, weight ratios, and the use of recycled materials, it was not feasible to determine the extent or magnitude of the environmental effects.
Findings
At the upstream stage, available LCAs are the main source of evidence, though some additional evidence sources were also consulted, in particular the 2019 Deloitte Study and some meta-analyses of LCAs.
| Environmental effects | Summary of findings on the net environmental effects of eliminating or restricting the SUP items subject to the Regulations | Conclusion |
|---|---|---|
| Climate change | Depending on the weight difference between the SUP and a substitute, substitutes typically have higher climate change impacts, due to the scale at which SUPs are produced, as well as natural resource inputs (e.g., logging), electricity sources (e.g., reusable bags made in other countries may depend on coal-generated electricity), and unit weight affecting GHG emissions during transportation. | Some minor negative environmental effects |
| Air quality | Production of substitutes, in particular non-plastic substitutes made from wood, paper, or cotton, may affect air quality, including through higher amounts of particulate matter, sulphur dioxide, and nitrogen oxides, creating a higher risk of smog and acid rain. | Some negative environmental effects |
| Water quality | Production of substitutes may affect water quality in both the marine and freshwater environments, including eutrophication (e.g., increased production of algae) and acidification from releases of nitrogen or phosphorus into the water in the extraction of natural resources (e.g., cotton) and the manufacturing process. | Some negative environmental effects |
| Water quantity | Production of substitutes typically uses or consumes more water than production of SUPs, either in the production of inputs (e.g., watering crops) or in the manufacturing process itself. | Some negative environmental effects |
| Terrestrial environmental quality | Substitutes may affect environmental quality on land through acidification, as well as natural resource depletion (e.g., logging). | Some negative environmental effects |
At the use stage, the only environmental effect identified in LCAs related to water usage (i.e., to wash reusable products), but the Department has concluded that increases in water usage will likely be minimal. Reusable products will be expected to be washed alongside other articles. For example, a reusable woven polypropylene bag will be washed alongside clothes in a washing machine, or a reusable metal spoon will be washed alongside other dishes, cups, and glasses. This water will be used regardless of whether the Regulations were in place or not.
At the downstream stage, environmental effects relate to waste (i.e., how SUPs and their substitutes are managed at end-of-life) and pollution (i.e. the extent to which SUPs and their substitutes enter the environment and pose a threat to wildlife) were evaluated. In terms of available evidence, LCAs provide some information, but analysis and findings are inconsistent, qualitative, do not apply the waste management hierarchy in assessing end-of-life outcomes, and consider the ecological impacts of litter only qualitatively. As a result, analysis at the downstream stage of this SEA relied more on other evidence sources, including litter data, scientific studies on physical harm caused by litter, data, and information on end-of-life outcomes, and the science assessment.
In terms of end-of-life outcomes at the downstream stage, each of the categories of SUPs targeted by the Regulations has low or very low recycling rates (less than 15%), as well as barriers to increasing their recycling rate. They are also expected to have no potential for other forms of value recovery, such as reuse, repair, remanufacture, or refurbishment. By contrast, substitutes have high potential for value recovery through recycling (e.g., products made from paper) or reuse (e.g., reusable bags, cutlery, and straws that meet the performance standards established in the Regulations).
In terms of environmental effects, the following table summarizes potential environmental effects for each of the categories scoped for consideration at the downstream stage.
| Environmental effects | Summary of findings on the net environmental effects of eliminating or restricting the SUP items subject to the Regulations | Conclusion |
|---|---|---|
| Climate change | Some substitutes such as those made from paper may produce GHGs such as methane in certain conditions (e.g., when decomposing in landfills). GHGs may also result from transporting waste substitutes (e.g., to landfill or recycling facilities). Substitutes with higher recycling rates (e.g., paper products) will result in lower GHG emissions due to avoided emissions from displacing virgin materials. | No significant environmental effects |
| Air quality | Air quality effects depend on end-of-life management methods — incineration (with or without electricity generation) of either SUPs or substitutes may affect air quality. However, given that substitutes are typically more recyclable, or have significantly longer lifespans, incineration is not expected to be a major end-point for substitutes in the downstream stage of the life cycle. | Potential negative or positive environmental effects |
| Water quality | The science assessment shows that water quality will be impacted by plastic pollution through, among other things, the release of micro- and macroplastic particles, including from SUPs as they fragment and degrade in the natural environment. Removing SUP items as a source of plastic pollution will eliminate their impact on water quality. | Significant positive environmental effects |
| Water quantity | More recyclable substitutes could use water as part of the recycling process, including to wash or sort materials, but this is not expected to be significant in the context of increasing recycling activity through other instruments such as extended producer responsibility being implemented in provinces and territories. | Potential negative or positive environmental effects |
| Terrestrial environmental quality | The science assessment shows that, among other things, plastic particles are retained in the soil for long periods of time, and that macroplastics can harm vegetation through effects such as smothering. Littered SUPs will be expected to contribute to such environmental harm more than reusable plastic substitutes, and much more than non-plastic substitutes. | Significant positive environmental effects |
| Biodiversity | SUPs are more prevalent in the environment than any substitute and pose a greater threat to wildlife than any substitute. All evidence sources showed that substitutes to SUPs are significantly better for wildlife in terms of the threats of harm posed by litter. Elimination or restriction of the six categories of SUPs will remove a significant threat of harm. | Significant positive environmental effects |
Mitigation and enhancement
The SEA identified a range of mitigation opportunities to reduce or eliminate the negative environmental effects identified at the upstream stage that may be caused by increased consumption of substitutes:
- rules for reusable products: Many LCAs conclude that a reusable substitute must be used many times before its environmental impacts equal or become less than that of SUPs. The Regulations will mandate minimum performance standards for reusable plastic checkout bags, cutlery, and straws. The performance standards will ensure that reusable substitutes made of plastic could be reused enough times to minimize or negate many of the negative environmental effects identified at the upstream stage of the product lifecycle;
- measures in place or under development: Many of the negative effects identified in the SEA (e.g. effects on air quality, water quality, and terrestrial environmental quality) will be mitigated by existing or proposed environmental protection measures. For example, the Government of Canada announced, through its strengthened climate plan, its intention to develop new federal regulations to increase the number of landfills that collect and treat their methane.footnote 72 This will reduce methane emissions caused by paper bags that enter landfills;
- innovation and scaling up new technologies and business practices: Many of the negative environmental effects identified in the upstream stage could be mitigated or negated through more circular technologies and business practices, if adopted at scale. For example, the Government of Canada’s estimates on the short-term potential for the adoption of reuse systems for foodservice ware is relatively low, meaning businesses are expected to switch to single-use substitutes to the prohibited products. The Government of Canada is working to support business models for adopting reusable and refillable substitutes, which could minimize or negate any negative environmental effects. These kinds of systems are beginning to be trialled in parts of Canada, such as a system being offered by a partnership between companies Loop and Loblawsfootnote 73 that provides consumers with reusable packaging for certain grocery items; and
- consumer education and promoting low-waste lifestyles: While the Regulations will mandate performance standards for reusable checkout bags, cutlery and straws, some studies have shown that reusable products may not be used to their fullest extent by consumers (e.g., 15 to 20 uses rather than 100 or more uses).footnote 74 The Government of Canada will work with partners and stakeholders to educate consumers on the reuse potential of their reusable bags, cutlery and straws, as well as promote low-waste consumption behaviours more generally to encourage reuse. By increasing reuse, the environmental impacts of reusable products will be considerably reduced.
Other effects and conclusions
The SEA determined that the Regulations will contribute to a number of goals outlined in the Federal Sustainable Development Strategy (FSDS), including: Greening government, Clean growth, Healthy coasts and oceans, Pristine lakes and rivers, Healthy wildlife populations, Clean drinking water, Connecting Canadians with nature, and Safe and healthy communities. There will also be a contribution to many of the United Nations Sustainable Development Goals corresponding with each of these FSDS goals.
Given the mitigation and enhancement measures, the positive effects of the Regulations are likely to be significant in terms of reduced plastic waste, reduced plastic pollution, and reduced threats of harm to wildlife, and greatly exceed any negative environmental effects.
Follow-up and monitoring
The Government of Canada will continue to draw from a range of evidence sources to monitor environmental effects and follow-up on the state of knowledge with regard to the relative environmental effects of SUPs and their substitutes. This will include
- developments in life cycle assessment: International organizations such as UNEP, as well as academics and practitioners of LCA, have highlighted the shortcomings of LCAs in analyzing downstream environmental effects, and some are beginning to propose standardized methods for assessing effects, such as those from marine litter. The Government of Canada will continue to monitor developments in this field;
- litter data: The Government of Canada will continue to draw from Canadian litter data as it becomes available from a range of sources, including shoreline cleanups and litter audits or surveys conducted by different jurisdictions; and
- science: The Government of Canada will continue to monitor the development of scientific understandings of the impacts of plastic pollution and other forms of pollution in the natural environment. This includes supporting science through Canada’s Plastics Science Agenda, which is meant to amplify the impact of Canadian plastics science by providing a framework that identifies gaps in current knowledge and the science needed to fill them, as well as policy-relevant areas of focus.
Gender-based analysis plus
A gender-based analysis plus (GBA+) was conducted for the Regulations and it determined that, while it will affect all Canadians to a certain extent, certain demographic groups may be disproportionately impacted. As a result, the Department determined that mitigation measures were needed in the Regulations to abate these impacts.
People with physical, learning or age-related disabilities
The GBA+ analysis showed that certain persons with disabilities require SUP flexible straws. SUP flexible straws may be repositioned, are lightweight, disposable and inexpensive. Persons with temporary, sporadic, or permanent disabilities often rely on SUP flexible straws with these characteristics to eat and drink safely. Specific groups that have identified this need via consultation processes include persons with age-related physical restrictions, arthritis, autoimmune disease, autism, cerebral palsy, dental and oral conditions, multiple sclerosis, muscular dystrophy, neurological disease, spinal cord injuries, and other illnesses and injuries, and persons who are recovering from a stroke or surgery.
Research shows that current substitutes for SUP flexible straws — including straws made from metal, silicone, glass, paper, bamboo, and pasta — do not meet accessibility needs. They cannot be repositioned and are not safe to use in cases of reduced mobility or impairment. They can pose choking hazards if the straw breaks (pasta, bamboo), may not be safe at high temperatures (metal, glass), are a food allergen risk (pasta), are not rigid enough (paper), or pose an injury risk (metal, glass). Reusable straw substitutes such as those made from silicone can also be difficult to clean and using one that has not been properly sanitized increases the risk of other health concerns, particularly for persons who are immunocompromised. A full prohibition without accommodations on SUP straws could create social barriers for persons with disabilities in terms of fully participating in public life (e.g., going to restaurants).
The Regulations will therefore continue to allow Canadians to purchase flexible straws in a pack of 20 or more in retail stores, which is in line with measures developed in other jurisdictions that restrict single-use plastic straws. A scan of the market showed that flexible straws are currently available at retail stores in packages above 20 (e.g., package of 100 or 200). Consultation with Industry indicated that SUP flexible straws will continue to be available at the retail level and no significant change in price for these products is expected as a result of the Regulations. The prevalence of disability in Canada increases by age group, with almost half of those individuals aged 75 years and over identifying themselves as having a disability. Therefore, the intersection that exists between age and disability means that any policy affecting persons with disabilities will also have a disproportionate impact on seniors in Canada. This is especially notable given that Canada’s senior population is expected to increase by 68% over the next 20 years.
Low-income households
As noted in the “Benefits and costs’’ section, the Regulations are expected to result in costs to Canadians. These costs could be felt more acutely by Canadians living with low income and limited disposable income, as the cost of implementing the ban for retailers will likely be passed onto consumers through increased prices for food, beverages, and merchandise. Marginalized communities in Canada are particularly likely to be living with low income due to race, gender, age, and disability status and the intersectionality between these characteristics. The Regulations may also impact individuals living with low income as a result of the loss of SUP checkout bags for secondary usage. The Department’s research and consultation process revealed that SUP checkout bags currently represent a cheaper substitute to trash bin liners, pet waste bags, and represent cost savings for people with low income. Individuals who live with low income and who may not have access to a personal vehicle have also reported concerns about a ban on SUP checkout bags, as it may be more difficult to carry multiple reusable bags on public transport to get to the grocery store, versus individuals who are able to leave their bags in a car. Further, individuals experiencing homelessness may also reuse SUP checkout bags to carry their belongings, and as protective rain gear for their shoes and clothing. The COVID-19 pandemic has disproportionately impacted low-income Canadians while also increasing the number of Canadians living in poverty. As a result, the impacts highlighted above will likely be felt by more Canadians now than would have been the case prior to the onset of the COVID-19 pandemic.
Women and single parents
The Department’s consultation process revealed that an indirect impact of the Regulations could be increased time and labour required to prepare and clean up meals using reusable containers where the regulated SUPs could have previously been used and disposed of without cleaning, which may disproportionately impact women and single parents. In 2014, single-parent families in Canada accounted for 20% of families with children aged less than 16, and single mothers accounted for 80% of these parents.footnote 75 Further, qualitative research highlights “women’s retention of ultimate responsibility” for the coordination of children’s lives and the smooth functioning of the household;footnote 76 for example, women are more likely than men to be responsible for meal preparation in Canadian households.footnote 77 SUPs have allowed Canadian lifestyles to become increasingly convenience-based and removed some burden on Canadian women and single parents when preparing and cleaning up after meals for their households. Consequently, the Regulations may cause women and single parents to clean a higher number of reusable substitutes. Impacts will be on time and labour, while disproportionate cost increases are not expected to be significant.
Mitigation measures
The GBA+ identified potential measures to mitigate negative impacts or enhance positive impacts. These include adapting prohibitions on SUP straws to allow persons with disabilities to continue to purchase and use SUP flexible straws, and further educating Canadians on how they can reduce plastic waste in their daily lives and consumer choices. All of these measures have either been adopted (e.g., accommodations for SUP flexible straws) or are being explored further with partners and stakeholders.
Implementation, compliance and enforcement, and service standards
Implementation
As outlined in the “Description” section, the various prohibitions set out in the Regulations will come into force at various times over the first 42 months following registration of the Regulations. These staggered coming into force provisions are intended to provide stakeholders with sufficient time to adapt to the regulatory requirements.
An intensive compliance promotion approach will be adopted by the Department within the first six months after the registration of the Regulations, to ensure their effective and efficient implementation. The Department will develop and distribute compliance promotion materials (e.g., a fact sheet and website material) to ensure that the regulated community is aware of the requirements within the Regulations. Working relationships have been established with industry and industry associations involved in the manufacture, import and sale of products covered by the Regulations, including for the purposes of export. The Department will work with these organizations to ensure that the appropriate information is available to affected parties. As the regulated community becomes more familiar with the requirements of the Regulations, these activities are expected to decline to a maintenance level.
Enforcement
The Regulations will be made under CEPA, so enforcement officers will, when verifying compliance with the Regulations, act in accordance with the Compliance and Enforcement Policy for CEPA, 1999.
Verification of compliance with the Regulations will include site visits, review of records, reusable product testing (if applicable), and review of written transit documents. Following an inspection or an investigation, if an enforcement officer discovers an alleged violation, the officer will choose the appropriate enforcement action based on the following factors, as outlined in the Compliance and Enforcement Policy for CEPA, 1999:
- Nature of the alleged violation: This includes consideration of the damage, the intent of the alleged violator, whether it is a repeat violation, and whether an attempt has been made to conceal information or otherwise subvert the objectives and requirements of CEPA;
- Effectiveness in achieving the desired result with the alleged violator: The desired result is compliance within the shortest possible time and with no further repetition of the violation. Factors to be considered include the violator’s history of compliance with CEPA, willingness to cooperate with enforcement officers, and evidence of corrective action already taken; and
- Consistency: Enforcement officers will consider how similar situations have been handled in determining the measures to be taken to enforce CEPA.
Subject to the enforcement officer’s discretion, the following responses are available to deal with alleged violations of CEPA and its regulations:
- warnings;
- directions;
- tickets;
- ministerial orders;
- environmental protection compliance orders;
- detention orders for ships;
- injunctions;
- prosecutions;
- environmental protection alternative measures; and
- court orders following convictions and civil suits by the Crown to recover costs.
More information on the Compliance and Enforcement Policy for CEPA (1999) is available on the Environment and Climate Change Canada website.
Performance measurement and evaluation
Performance measurement will evaluate how effective the Regulations are at achieving their objective, which is to reduce plastic waste and prevent plastic pollution by eliminating or restricting six categories of SUP manufactured items that pose a threat to the environment and have significant barriers to end-of-life value recovery. Achieving this objective will contribute to the Government of Canada’s plan to achieve zero plastic waste by 2030.
Quantitative indicators and targets, where applicable, have been defined and developed as part of the implementation strategy for the Regulations. Examples of performance indicators include the following: regulatory requirements are understood by affected stakeholders; prohibited and restricted products are not being manufactured, imported, or sold unless an exemption applies. Information gathered from various sources, such as surveys, Canada Border Services Agency import and export data, and Statistics Canada data will provide the performance information necessary to measure the indicators.
In terms of gathering data to measure the effectiveness of the Regulations at keeping prohibited and restricted SUPs out of the environment, the Department is developing a plastic pollution science framework that will, over time, improve the research and monitoring of plastic pollution in the environment. In the meantime, other sources of data, such as Canadian citizen science and civil society data on the SUPs most commonly found as litter on Canadian beaches and shorelines, as well as findings from waste audits, will be used to qualitatively assess this.
Once completed, the performance information collected will be summarized and reported on the Canada.ca website. Further, the Department will continue to report on the progress, performance, and overall effectiveness of the Regulations in CEPA annual reports and departmental performance reports.
Contacts
Matthew Watkinson
Director
Regulatory Analysis and Valuation Division
Environment and Climate Change Canada
200 Sacré-Cœur Boulevard
Gatineau, Quebec
K1A 0H3
Email: ravd-darv@ec.gc.ca
Tracey Spack
Director
Plastics Regulatory Affairs Division
Environment and Climate Change Canada
351 Saint-Joseph Boulevard
Gatineau, Quebec
K1A 0H3
Email: ec.plastiques-plastics.ec@ec.gc.ca