Canada Gazette, Part I, Volume 156, Number 36: Supplement 1
September 3, 2022
FEDERAL ELECTORAL BOUNDARIES COMMISSION FOR THE PROVINCE OF ONTARIO
Proposal of the Federal Electoral Boundaries Commission for the Province of Ontario
Overview of the Proposed Redistribution Plan
Redistribution of federal electoral boundaries is governed by the Electoral Boundaries Readjustment Act, which sets out the Commission’s mandate and rules to be applied in redrawing boundaries.
The legislation mandates that each electoral district shall, as close as reasonably possible, correspond to the Provincial Electoral Quota (“the Quota”). The Quota is the total population divided by the number of districts. In addition, the Commission is obliged to also consider communities of interest or communities of identity in, and the historical pattern of, electoral districts, and a manageable geographic size for districts in sparsely populated, rural or northern regions of the province.
Pursuant to this mandate, the Commission proposes many new electoral boundaries for Ontario.
These proposed boundary changes are necessary due to the allocation of one additional district (bringing the total number of districts in the province to 122); and to correct wide variations in voter equality that have emerged across the province over the past decade due to population changes.
Some boundary adjustments are significant.
The ridings in Northern Ontario have been reduced by one, from ten to nine.
The ridings in the City of Toronto have been reduced by one, from 25 to 24.
The ridings in Halton, Guelph, and Wellington have been increased by one, from six to seven.
The ridings in Brampton, Caledon, and Dufferin have been increased by one, from six to seven.
One additional riding has also been added to Central Ontario, Eastern GTA, and Northern GTA.
It is necessary to adjust the boundaries of many other districts and rename districts as a result.
The Commission is presenting its proposal by referencing 15 geographic pieces. For each of these, the report presents visual illustrations of the existing and proposed electoral districts. It also provides a description of the most significant changes. In addition, the Commission has included two tables for each geographic piece, with the districts listed in alphabetical order.
The first table (A) lists the existing electoral districts, their populations in 2011, and their deviations from the 2012 Provincial Electoral Quota (i.e., at the time they were created), followed by their populations in 2021 and the resulting deviations from the 2022 Provincial Electoral Quota. The bottom rows present summary data for those existing districts including, most notably, the average deviation from the Quota and the range in deviations from the Quota. The range indicates the total magnitude of deviation from the Quota between the least and most populous districts in a geographic piece. This first table thus reveals the variation from population equality within a geographic piece as well as the changes that have arisen since the last redistribution.
The second table (B) lists the proposed electoral districts, their 2021 populations and their deviations from the 2022 Provincial Electoral Quota. The bottom row presents summary data for the proposed districts, including the range in deviations from the 2022 Provincial Electoral Quota.
Detailed maps of each of the proposed electoral districts with legal descriptions can be reviewed online at redistribution2022.ca via the Map Viewer tool, which allows each user to enter a specific address and locate the applicable electoral district.
Background
The Electoral Boundaries Readjustment Act creates an independent non-partisan process for the review and, if necessary, revision of the federal electoral map following the most recent decennial census.
The assignment of seats to Ontario
The Chief Electoral Officer calculates the number of seats assigned to each province in accordance with the representation formula in the Constitution Act, 1867 (see redistribution2022.ca).
Pursuant to that formula, Ontario has been allocated 122 seats. There is one additional seat from the last redistribution plan prepared in 2012.
The population of Ontario and calculation of the Provincial Electoral Quota
On February 9, 2022, the Chief Statistician of Canada certified that the population of Ontario, as ascertained by the 2021 Census of Population, is 14,223,942.
The Quota, as previously described, is determined by dividing Ontario’s total population by the total number of seats. For 2022, the Quota is therefore 116,590.
The establishment of the Electoral Boundaries Commission
The Electoral Boundaries Readjustment Act provides that the Chair of the Commission for the province shall be appointed by the Chief Justice of that province and the other two members of the Commission shall be appointed by the Speaker of the House of Commons.
The Order in Council dated November 1, 2021, established the Ontario Commission. Madam Justice Lynne Leitch of the Superior Court of Justice serves as Chair. Dr. Karen Bird and Dr. Peter Loewen are the other members of the Commission. Dr. Bird and Dr. Loewen are Professors of Political Science at McMaster University and the University of Toronto, respectively.
Each Commission is assigned a geography specialist who assists the Commission in drawing proposed boundaries.
The legislative rules
The Commission is to prepare a report setting out its recommended boundaries for each electoral district, a description for each district, and a name for each district.
The Electoral Boundaries Readjustment Act provides that in preparing its report the Commission shall be governed by certain rules.
The population of each electoral district shall, as close as reasonably possible, correspond to the Quota.
In determining reasonable electoral district boundaries, the Commission shall consider the communities of interest or communities of identity in, and the historical pattern of, electoral districts, and a manageable geographic size for districts in sparsely populated, rural or northern regions of the province.
The right to vote is enshrined in the Canadian Charter of Rights and Freedoms. Section 3 states that “every citizen of Canada has the right to vote in an election of members of the House of Commons or of a legislative assembly and to be qualified for membership therein.”
The Supreme Court of Canada in the leading case, Reference Re Provincial Electoral Boundaries (Sask), [1991] 2 S.C.R. 158, concluded that “the right to vote enshrined in s. 3 of the Charter is not equality of voting power per se but the right to ‘effective representation’.” Effective representation entails voter parity as the primary concern, but deviations are permitted for reasons such as “geography, community history, community interests and minority representation” in order to “effectively represent the diversity of our social mosaic.” The Court noted that the right of a Commission to depart from voter parity is circumscribed by the reasons set forth in the Act and only to the extent that the special circumstances properly permit.
However, as required by the Electoral Boundaries Readjustment Act, absent extraordinary circumstances, the Commission must make every effort to ensure that the population of each electoral district in the province remains within 25 per cent more, or 25 per cent less, of the Quota.
The Commission’s Rationale for Its Proposed Redistribution Plan
This Commission was committed to achieving voter parity throughout the province as much as reasonably possible, as mandated by the Electoral Boundaries Readjustment Act. Historical patterns, communities of interest and identity, and manageable geographic size were also considered. However, the Commission has concluded that the effect of uneven population shifts across the province over the past decade requires adjustments to many existing district boundaries in order to address patterns of voter under-representation and over-representation. This has resulted in many important changes reflected in the proposed electoral map.
The Commission had the responsibility of creating one new electoral district, given that Ontario had been allocated 122 seats.
The Commission noted that there had been significant population growth in Ontario and the Quota had increased as a result. The Commission further noted that the population growth was uneven across the province, with significant growth in some areas and only modest growth in others.
As a result of this uneven population growth over the past decade, combined with relatively wide population disparities in the 2012 map, there are substantial population inequalities across electoral districts today. The Commission has sought to remedy this.
The Commission considered—and respected where possible—the historical pattern of electoral districts. However, a redrawing of the boundaries was often required in order to rectify the grave disparities from population equality across the province. In other words, the deviations from the 2022 Quota were not reasonable.
In determining population counts, data from the 2021 Census was used. The 2021 demographic data will not be released by Statistics Canada until after the preparation of this proposal. Therefore, the Commission has utilized the available demographic data, namely, from the 2016 Census.
In creating the proposed redistribution plan, the Commission endeavoured to limit the deviation from the Quota to no more than plus or minus 10 per cent.
The Commission achieved that result in all parts of the province other than Northern Ontario, where the proposed redistribution plan envisions eight electoral districts with populations within or close to within plus or minus 15 per cent of the Quota, and one riding where the Commission found “extraordinary circumstances.” The Commission concluded that the sparse population throughout this remote and expansive area, and the Indigenous communities of interest that are predominant in this part of Northern Ontario, justified this one proposed “extraordinary circumstances” district. The eight other proposed districts in this geographic piece are all of manageable geographic size and accessible via major roadways.
In drawing the boundaries of each electoral district, the Commission referenced major geographical features such as highways, main roads, rail lines, rivers, lakes and other bodies of water, escarpments, and municipal boundaries.
The Commission concluded that the municipal boundaries could not always serve as an electoral boundary, considering the legislative rules the Commission is obliged to apply. For example, municipal boundaries could not be used as electoral boundaries for a number of mid-sized and larger cities whose populations have grown to exceed the Quota and where continued population growth is expected.
The Commission considered the location of all First Nations reserves and communities and has sought to ensure that no such community would be arbitrarily divided by an electoral district boundary.
If an electoral district included a First Nations reserve that had not participated in the census, the Commission considered the population data available from the Indian Registration System as reported by Crown-Indigenous Relations and Northern Affairs Canada (CIRNAC) in proposing the boundary for that electoral district.
Where a community of Francophones represented a substantial percentage of an electoral district, proposed boundaries ensure that such representation is not diminished.
The Commission also strived to respect urban and rural communities of interest.
Where possible, the Commission implemented many very helpful suggestions arising from the submissions made following the invitation for early public input.
The proposed redistribution plan was compared against projected growth in population based on applying the Ontario Ministry of Finance’s Ontario Population Projections (https://www.ontario.ca/page/ontario-population-projections#section-6) (published June 23, 2021) to ensure as much as possible that the populations of the new electoral districts would not vary substantially in size over the period of time to the next census.
A number of minor technical adjustments, not affecting population, have also been made to the electoral boundaries, for example, to follow the correct alignment with roads, rail lines, rivers, ravines, etc. Boundaries have been updated where road or municipal boundaries have changed.
Finally, in proposing district names, the Commission sought to maintain the historical connection of communities to the electoral districts, while ensuring that names are inclusive, meaningful, and connote a clear sense of location or geographic reference. In some instances, the Commission has proposed Indigenous names.
Details of the Proposed Redistribution Plan
Part A – Geographic pieces in which the number of districts has changed
Northern Ontario
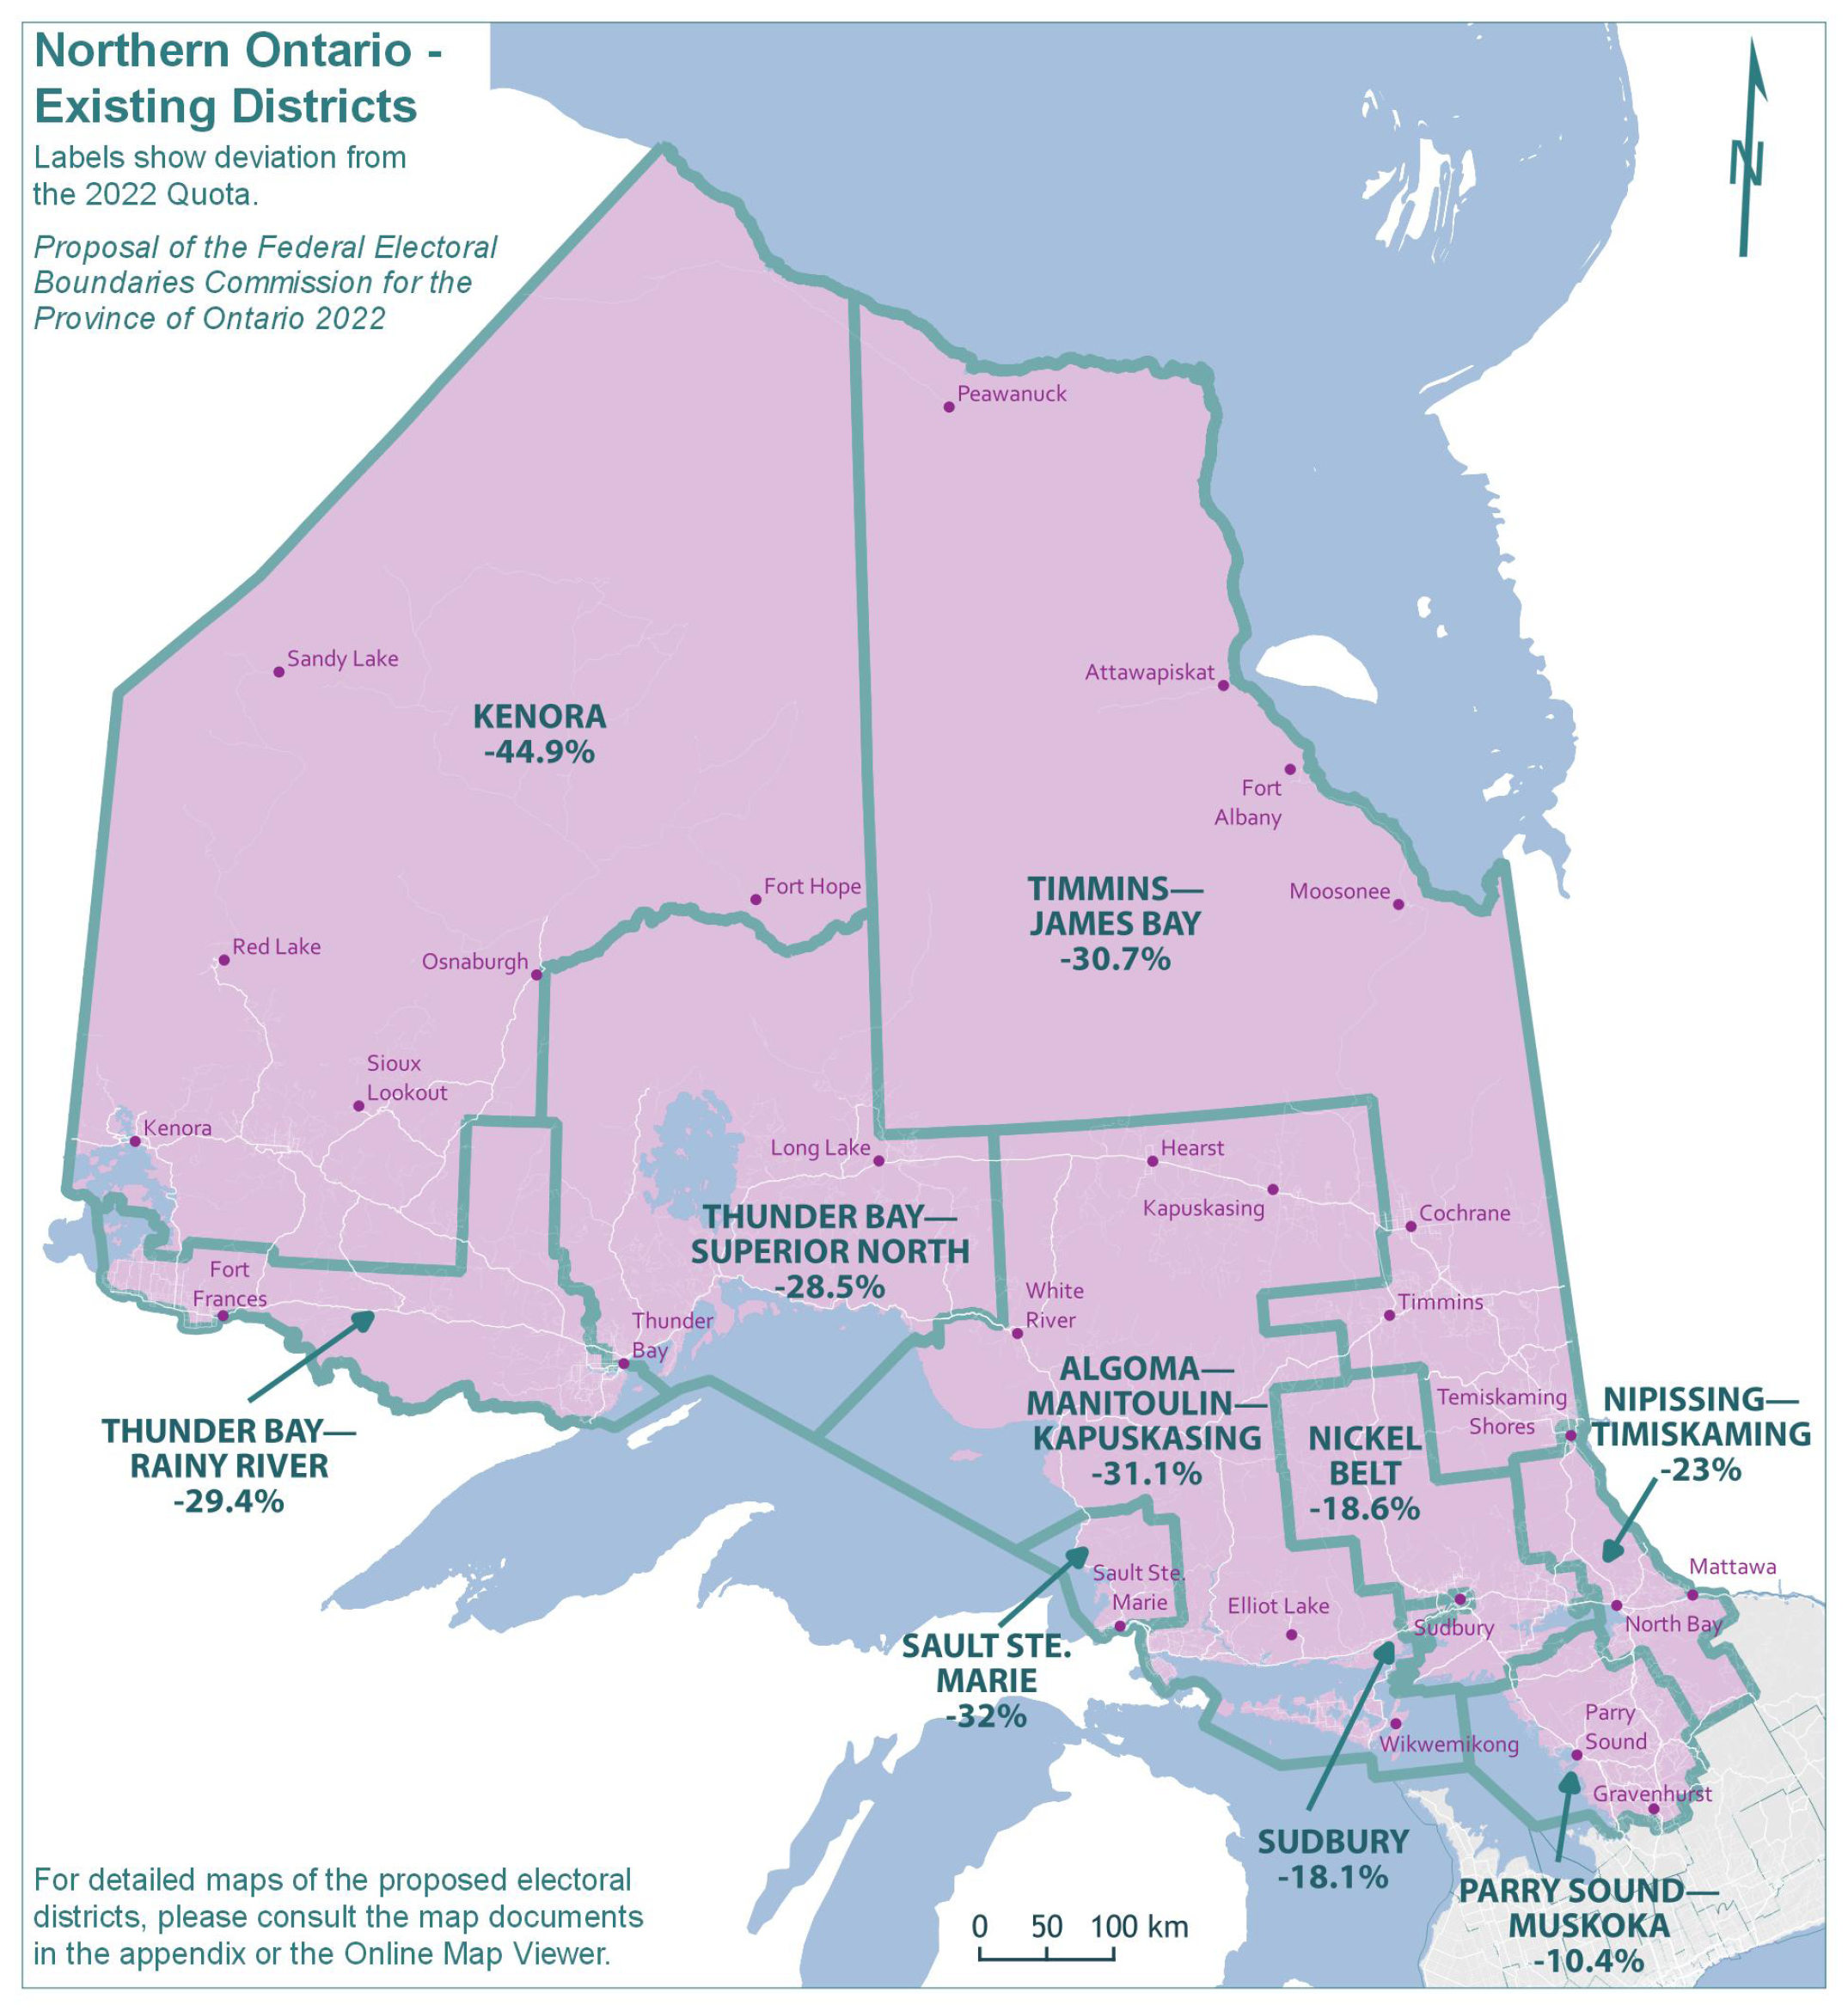
There was only modest population growth in Northern Ontario over the past decade.
The population of Northern Ontario grew by 2.8%, from 831,984 in 2011 to 855,138 in 2021. The remainder of Ontario grew by 11.2% in the same period.
The populations and deviations from the Quota for the 10 existing electoral districts in Northern Ontario are shown in Table 1A. These districts have an average 2021 population of 85,513—a figure that is 26.7% below the Quota of 116,590. While Kenora was deemed an “extraordinary circumstances” district in the 2012 electoral map, there are presently five additional districts with populations that fall more than 25 per cent below the 2022 Quota.
| Electoral Districts | Population – 2011 | Deviation from Quota – 2012 | Population – 2021 | Deviation from Quota – 2022 |
|---|---|---|---|---|
| Algoma—Manitoulin—Kapuskasing | 79,801 | -24.87% | 80,310 | -31.12% |
| Kenora (Extraordinary Circumstance) | 55,977 | -47.30% | 64,261 | -44.88% |
| Nickel Belt | 90,962 | -14.36% | 94,947 | -18.56% |
| Nipissing—Timiskaming | 90,996 | -14.33% | 89,781 | -22.99% |
| Parry Sound—Muskoka | 91,233 | -14.10% | 104,494 | -10.37% |
| Sault Ste. Marie | 82,052 | -22.75% | 79,331 | -31.96% |
| Sudbury | 92,048 | -13.34% | 95,537 | -18.06% |
| Thunder Bay—Rainy River | 82,984 | -21.87% | 82,357 | -29.36% |
| Thunder Bay—Superior North | 82,827 | -22.02% | 83,325 | -28.53% |
| Timmins—James Bay | 83,104 | -21.76% | 80,785 | -30.71% |
| Average | 83,198 | -21.67% | 85,513 | -26.65% |
| Range (most populous to least populous) | 36,071 | 33.96 pp | 40,233 | 34.51 pp |
| Average – Excluding Extraordinary Circumstance | 86,223 | -18.82% | 87,874 | -24.63% |
| Range – Excluding Extraordinary Circumstance | 12,247 | 11.53 pp | 25,163 | 21.59 pp |
pp = percentage points
Given these extreme disparities from population equality and the distinctive challenges of representation in the North, the Commission discussed at great length the meaning of ’effective representation’ and the challenges of balancing the considerations set forth under the Electoral Boundaries Readjustment Act.
The Commission noted that in 2016 the province of Ontario established the Far North Electoral Boundaries Commission to make recommendations regarding the creation of at least one, and no more than two, new provincial electoral districts from the geography of the current provincial electoral districts of Kenora—Rainy River and Timmins—James Bay.
This Commission further noted the distinctions between its own mandate as set out in the rules prescribed by the federal Electoral Boundaries Readjustment Act and the legislative mandate of the Ontario Far North Electoral Boundaries Commission. Our Commission is constrained by its mandate and by the smaller number of districts to be created.
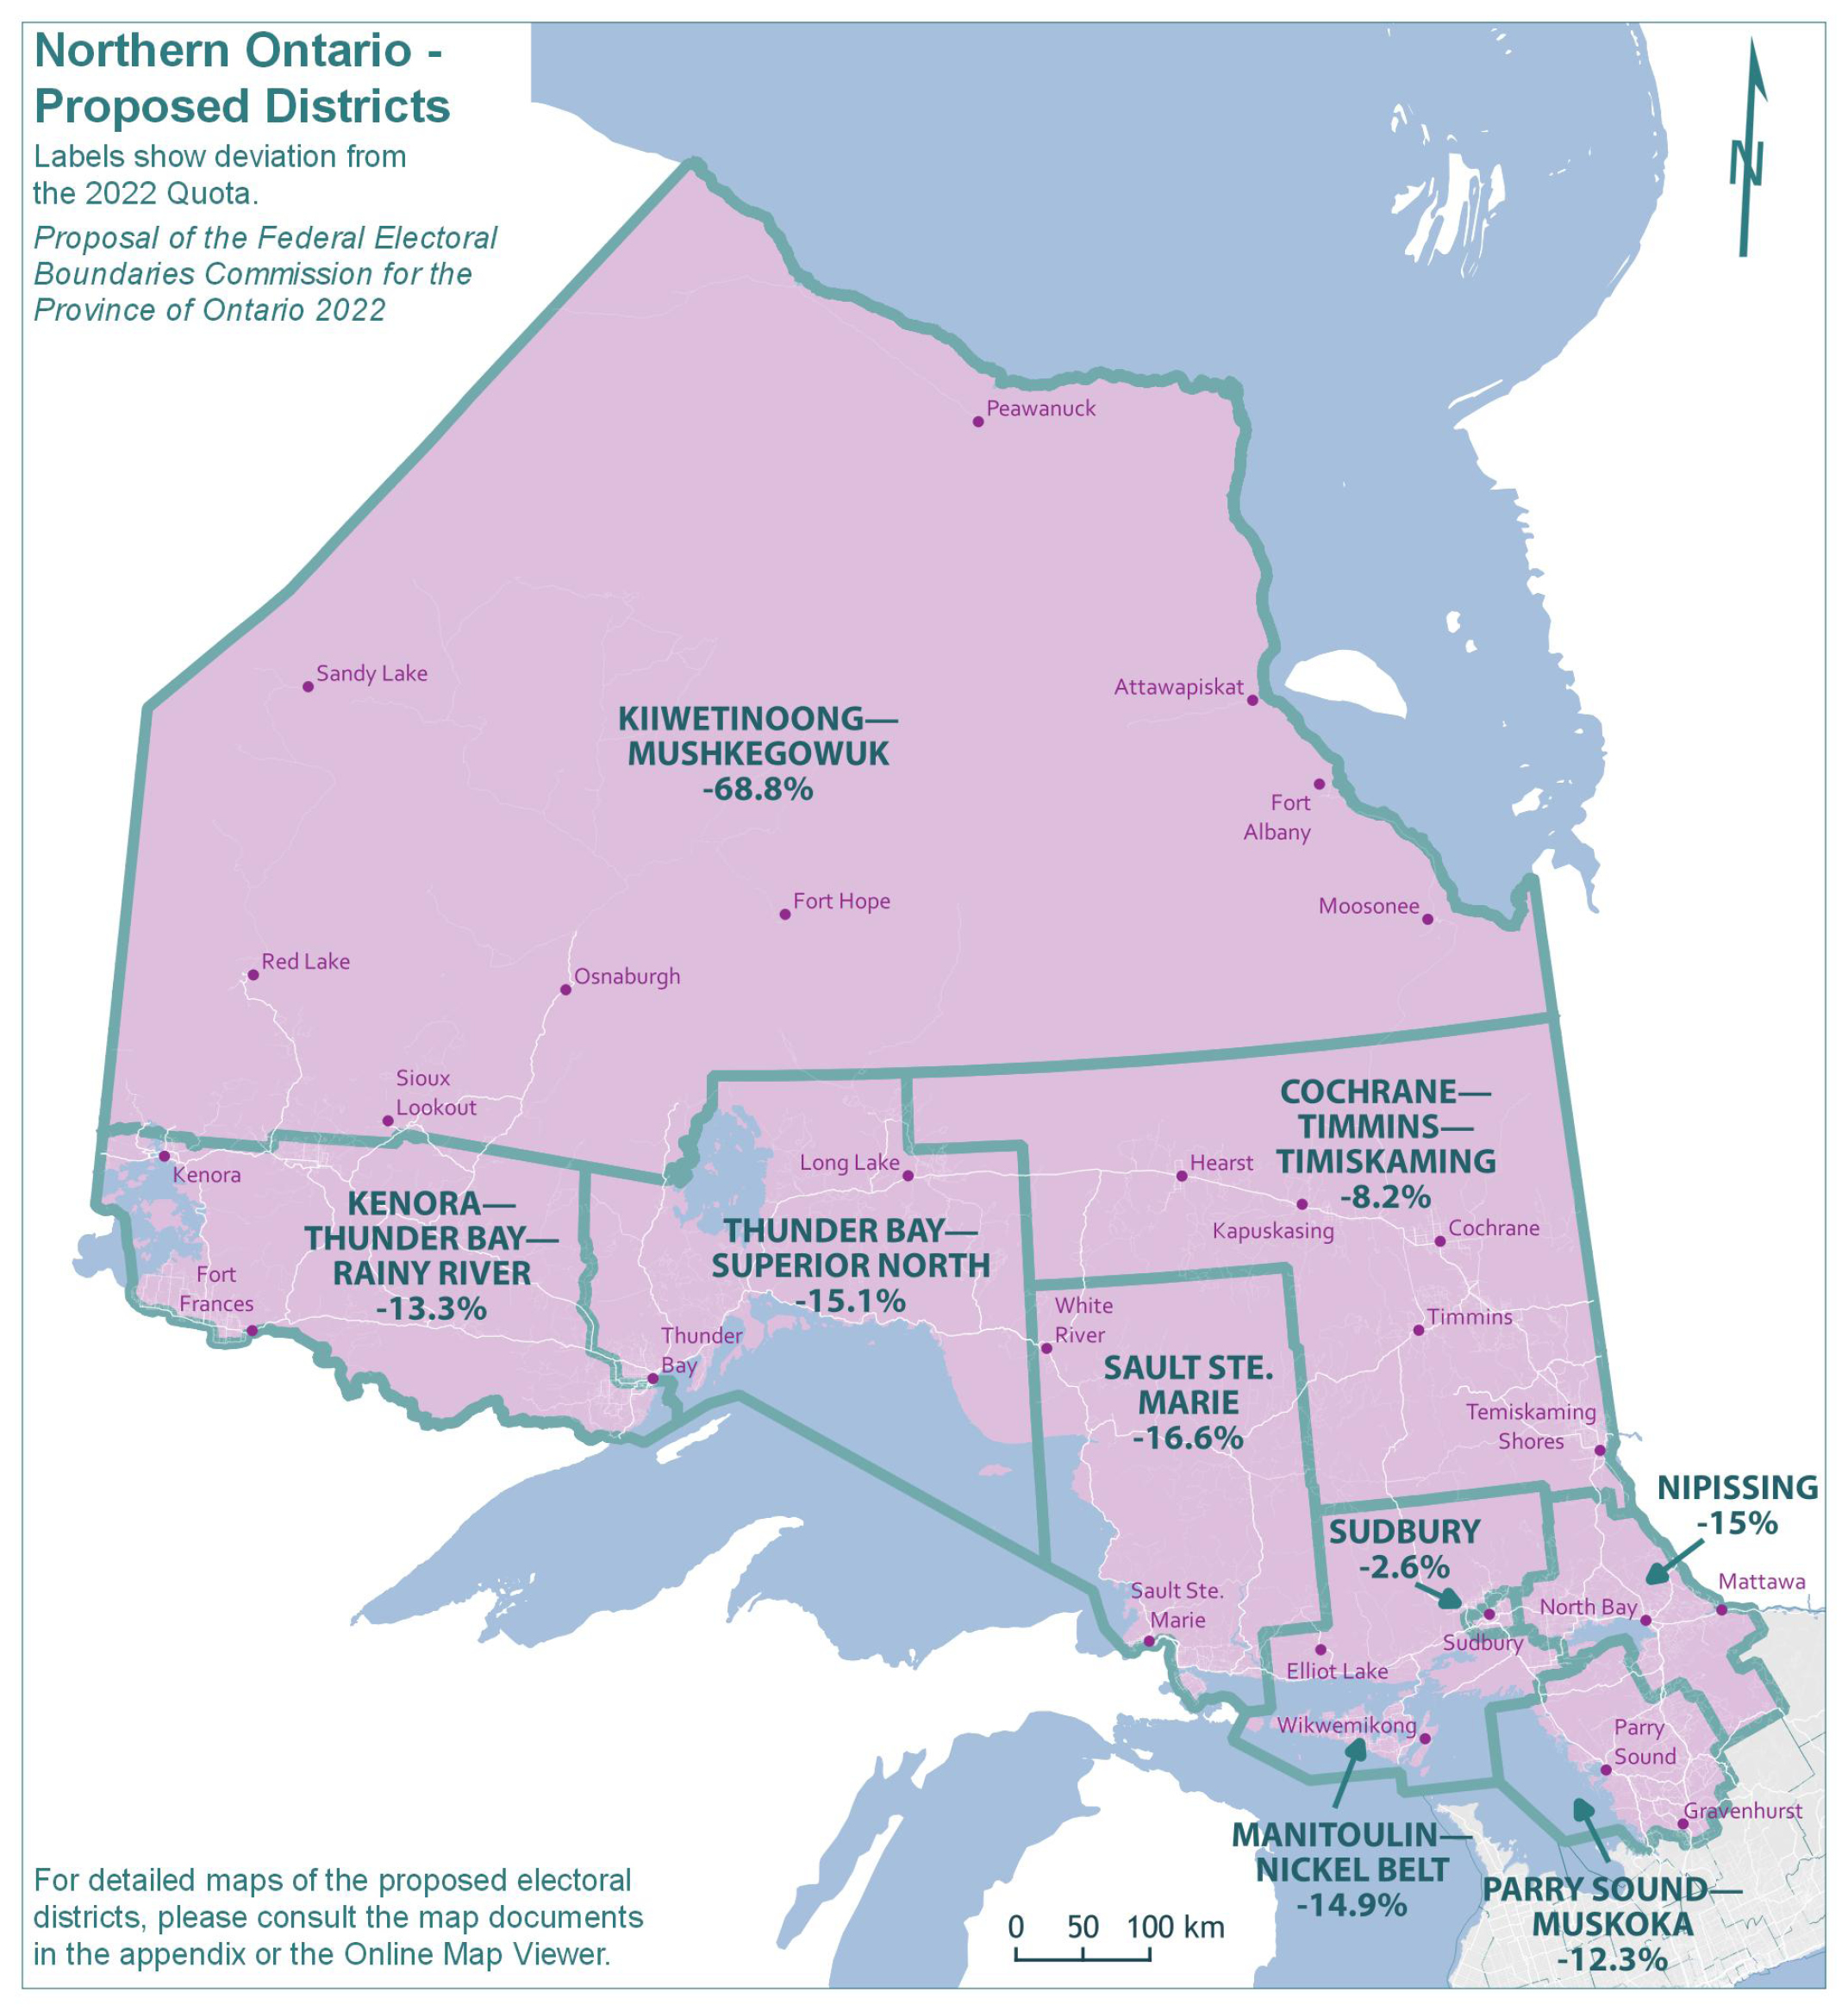
The census population data and mandate respecting voter parity revealed the potential for a reduction of two electoral districts in Northern Ontario. The Commission considered this possibility but decided to propose a reduction of one district, thus resulting in nine districts in total, including one “extraordinary circumstances” district. The Commission acknowledged that most of the eight non-extraordinary districts in Northern Ontario have significant deviations from the Quota (see Table 1B). However, the Commission concluded that any further reduction in the number of districts in the North would imperil the principle of effective representation in this part of the province, considering its widely dispersed population and communities of interest.
The proposed redistribution plan establishes one “extraordinary circumstances” district which encompasses and reflects the exceptional nature of the far North—an isolated and geographically substantial area, in large part not accessible by road, in which the majority of the population is Indigenous. While geographically vast (520,307 square kilometers), the proposed district of KIIWETINOONG—MUSHKEGOWUK would not be the largest in Canada and, furthermore, is accessible via regular flight routes (from the Timmins hub along the James Bay coast and from hubs in Thunder Bay, Sioux Lookout and Winnipeg serving the western portion).
The eight other proposed electoral districts in Northern Ontario are of manageable geographic size, and accessible via the well-established roadway network anchored by Highways 11 and 17. Their boundaries have also been redrawn to reduce the large deviations from the Quota.
As previously noted, where a community of Francophones represented a substantial percentage of a riding, the proposed boundaries ensure that their representation is not diluted or diminished within this redistribution plan.
In addition to the proposed riding name of KIIWETINOONG—MUSHKEGOWUK, other reconfigured districts have been renamed to reflect the communities comprising them.
The new deviations from the Quota in the proposed redistribution plan are shown in Table 1B.
| Electoral Districts | Population – 2021 | Deviation from Quota – 2022 |
|---|---|---|
| Cochrane—Timmins—Timiskaming | 107,092 | -8.15% |
| Kenora—Thunder Bay—Rainy River | 101,097 | -13.29% |
| Kiiwetinoong—Mushkegowuk (Extraordinary Circumstance) | 36,325 | -68.84% |
| Manitoulin—Nickel Belt | 99,268 | -14.86% |
| Nipissing | 99,149 | -14.96% |
| Parry Sound—Muskoka | 102,255 | -12.30% |
| Sault Ste. Marie | 97,299 | -16.55% |
| Sudbury | 113,618 | -2.55% |
| Thunder Bay—Superior North | 99,035 | -15.06% |
| Average | 95,015 | -18.51% |
| Range (most populous to least populous) | 77,293 | 66.29 pp |
| Average – Excluding Extraordinary Circumstance | 102,352 | -12.22% |
| Range – Excluding Extraordinary Circumstance | 16,319 | 14.00 pp |
pp = percentage points
City of Toronto
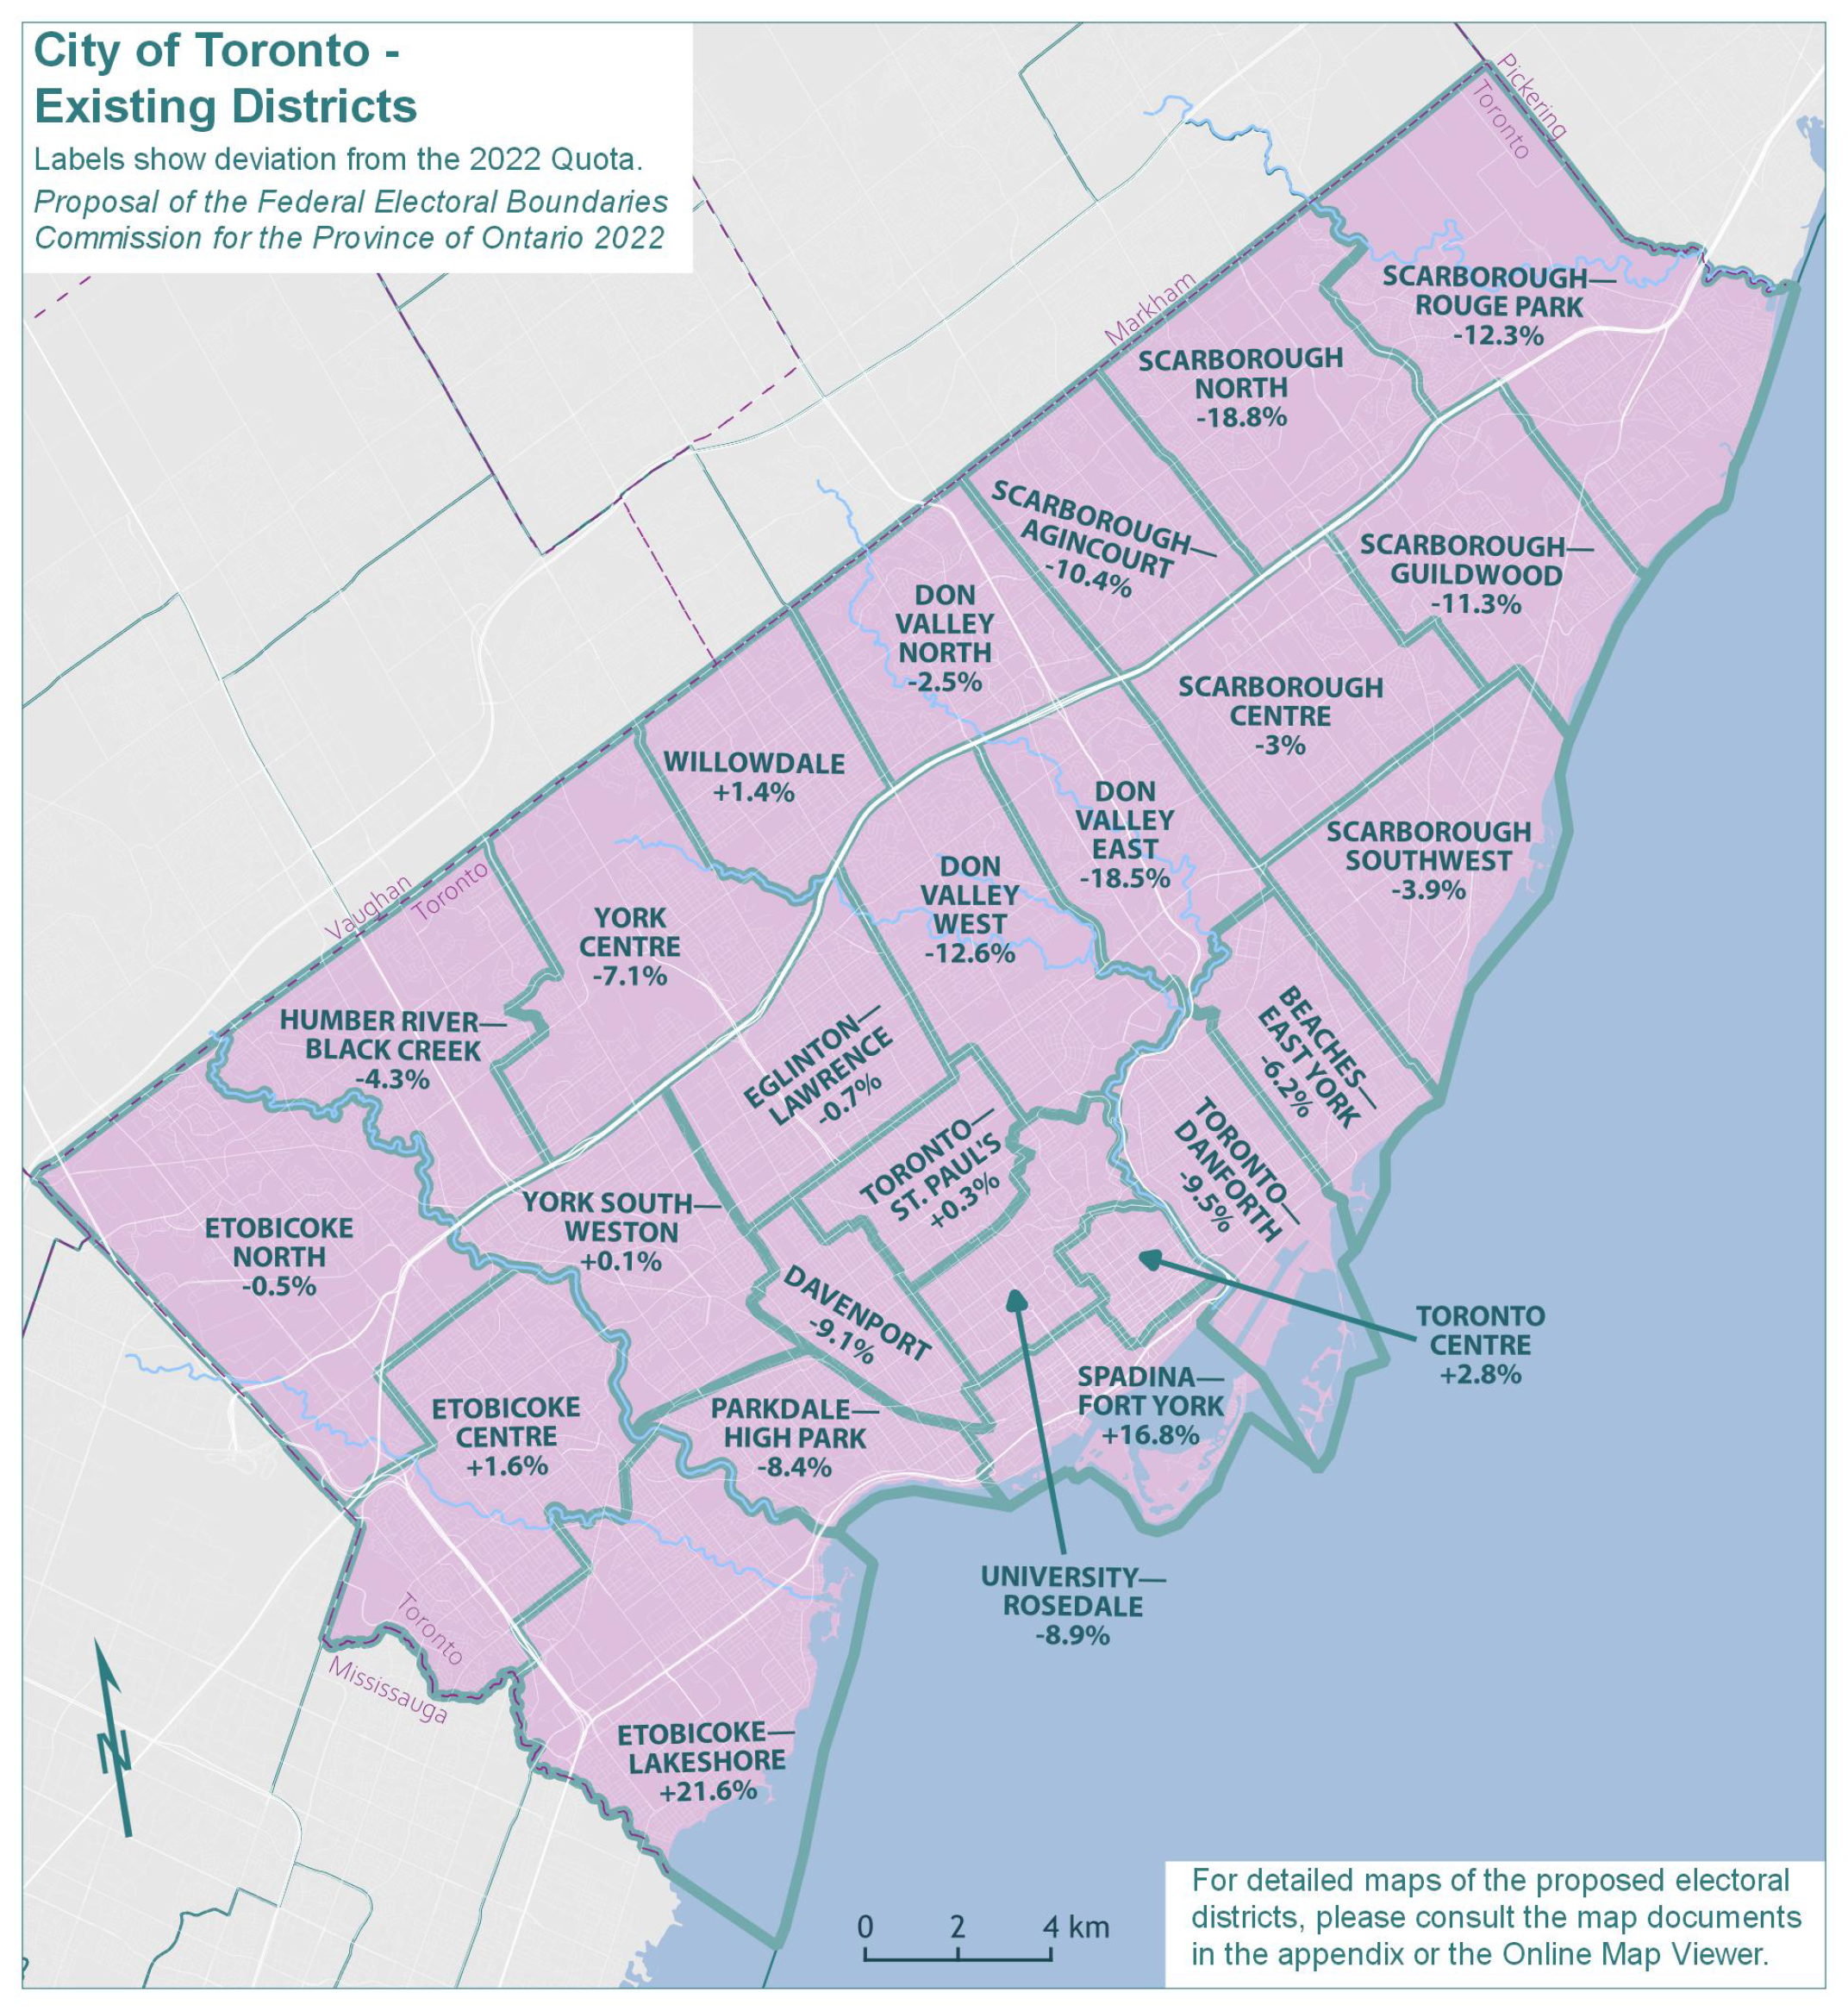
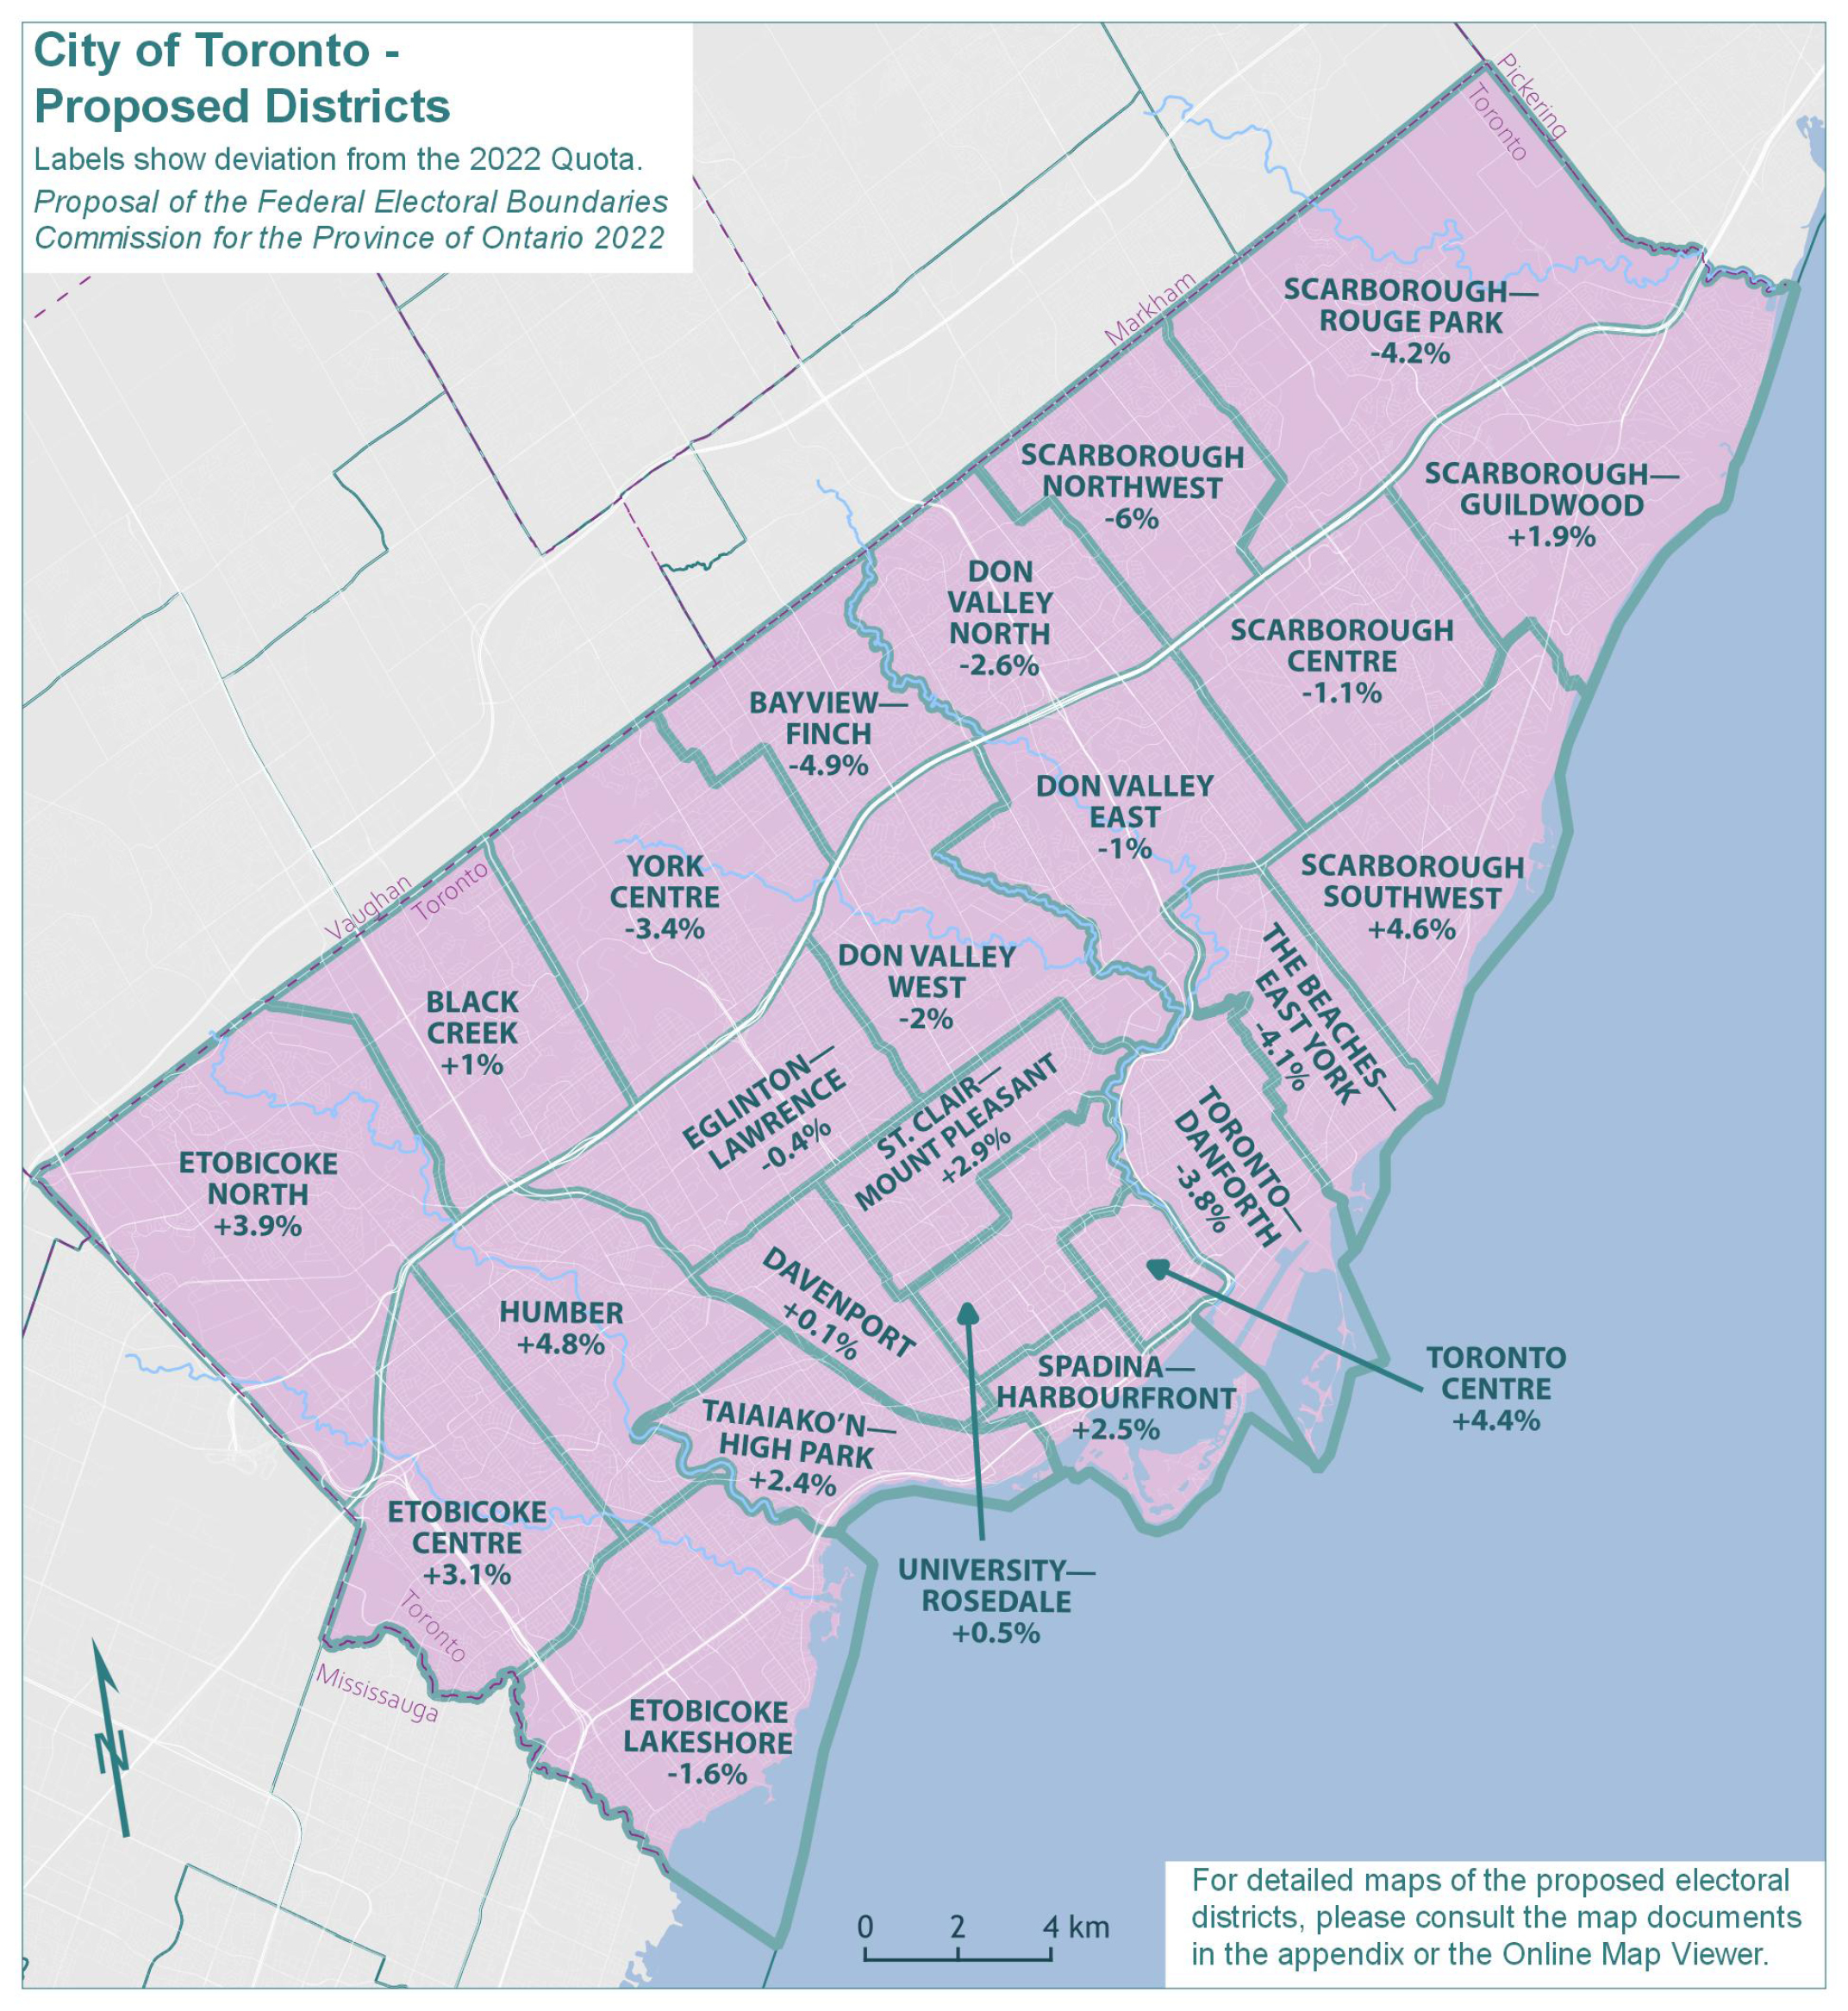
The population of Toronto grew by 6.9%, from 2,615,060 in 2011 to 2,794,356 in 2021. The remainder of Ontario grew by 11.7% in the same period.
The existing 25 electoral districts in Toronto would have an average 2021 population of 111,774—a figure that falls 4.1% below the Quota of 116,590. Furthermore, as indicated by the range of deviations relative to the 2022 Quota (40.3 percentage points), there are substantial disparities in the population size of districts across the City of Toronto. The populations and deviations from the Quota for the existing electoral districts are shown in Table 2A.
| Electoral Districts | Population – 2011 | Deviation from Quota – 2012 | Population – 2021 | Deviation from Quota – 2022 |
|---|---|---|---|---|
| Beaches—East York | 107,084 | 0.82% | 109,359 | -6.20% |
| Davenport | 102,360 | -3.63% | 105,946 | -9.13% |
| Don Valley East | 93,007 | -12.43% | 95,039 | -18.48% |
| Don Valley North | 103,073 | -2.96% | 113,663 | -2.51% |
| Don Valley West | 99,820 | -6.02% | 101,959 | -12.55% |
| Eglinton—Lawrence | 113,150 | 6.53% | 115,832 | -0.65% |
| Etobicoke Centre | 114,910 | 8.19% | 118,483 | 1.62% |
| Etobicoke—Lakeshore | 115,437 | 8.68% | 141,751 | 21.58% |
| Etobicoke North | 117,601 | 10.72% | 116,003 | -0.50% |
| Humber River—Black Creek | 108,198 | 1.87% | 111,593 | -4.29% |
| Parkdale—High Park | 105,103 | -1.05% | 106,750 | -8.44% |
| Scarborough—Agincourt | 104,499 | -1.61% | 104,423 | -10.44% |
| Scarborough Centre | 108,826 | 2.46% | 113,104 | -2.99% |
| Scarborough—Guildwood | 101,914 | -4.05% | 103,449 | -11.27% |
| Scarborough North | 101,080 | -4.83% | 94,717 | -18.76% |
| Scarborough—Rouge Park | 102,646 | -3.36% | 102,254 | -12.30% |
| Scarborough Southwest | 106,733 | 0.49% | 111,994 | -3.94% |
| Spadina—Fort York | 82,480 | -22.35% | 136,213 | 16.83% |
| Toronto Centre | 93,971 | -11.53% | 119,901 | 2.84% |
| Toronto—Danforth | 104,017 | -2.07% | 105,472 | -9.54% |
| Toronto—St. Paul’s | 103,983 | -2.10% | 116,953 | 0.31% |
| University—Rosedale | 98,605 | -7.16% | 106,216 | -8.90% |
| Willowdale | 109,680 | 3.26% | 118,218 | 1.40% |
| York Centre | 100,277 | -5.59% | 108,307 | -7.10% |
| York South—Weston | 116,606 | 9.78% | 116,757 | 0.14% |
| Average | 104,602 | -1.52% | 111,774 | -4.13% |
| Range (most populous to least populous) | 35,121 | 33.07 pp | 47,034 | 40.34 pp |
pp = percentage points
The Commission noted that the overrepresentation in Toronto has emerged due to uneven population growth between Toronto and surrounding areas, which is expected to continue or increase in the future.
As a result, the Commission concluded that the districts in Toronto be reduced by one.
This reduction, together with the obligation to address the wide population disparities of electoral districts within the City of Toronto, has required shifting many boundaries. The most significant proposed changes fall in the eastern portion of the City of Toronto, particularly around Scarborough, where deviations below the Quota were most pronounced. This area, broadly described as lying to the east of Victoria Park Avenue, has been reduced from six districts to five.
Proposed new electoral boundaries are formed by City of Toronto boundaries and, for the most part, follow the contours of major highways, roads, rail lines, ravines, and rivers.
Several district names have been changed to better describe their locations or reflect the neighbourhoods and communities that comprise these reconfigured districts.
With 24 districts, the average population in each district becomes 116,432. The maximum deviation from the Quota is 6%. The new deviations from the Quota in the proposed redistribution plan are shown in Table 2B.
| Electoral Districts | Population – 2021 | Deviation from Quota – 2022 |
|---|---|---|
| Bayview—Finch | 110,908 | -4.87% |
| Black Creek | 117,740 | 0.99% |
| Davenport | 116,728 | 0.12% |
| Don Valley East | 115,456 | -0.97% |
| Don Valley North | 113,537 | -2.62% |
| Don Valley West | 114,229 | -2.03% |
| Eglinton—Lawrence | 116,139 | -0.39% |
| Etobicoke Centre | 120,157 | 3.06% |
| Etobicoke Lakeshore | 114,714 | -1.61% |
| Etobicoke North | 121,107 | 3.87% |
| Humber | 122,220 | 4.83% |
| Scarborough Centre | 115,260 | -1.14% |
| Scarborough—Guildwood | 118,754 | 1.86% |
| Scarborough Northwest | 109,568 | -6.02% |
| Scarborough—Rouge Park | 111,713 | -4.18% |
| Scarborough Southwest | 121,947 | 4.59% |
| Spadina—Harbourfront | 119,497 | 2.49% |
| St. Clair—Mount Pleasant | 119,935 | 2.87% |
| Taiaiako’n—High Park | 119,421 | 2.43% |
| The Beaches—East York | 111,805 | -4.10% |
| Toronto Centre | 121,703 | 4.39% |
| Toronto—Danforth | 112,119 | -3.83% |
| University—Rosedale | 117,119 | 0.45% |
| York Centre | 112,580 | -3.44% |
| Average | 116,432 | -0.14% |
| Range (most populous to least populous) | 12,652 | 10.85 pp |
pp = percentage points
Halton, Guelph, and Wellington
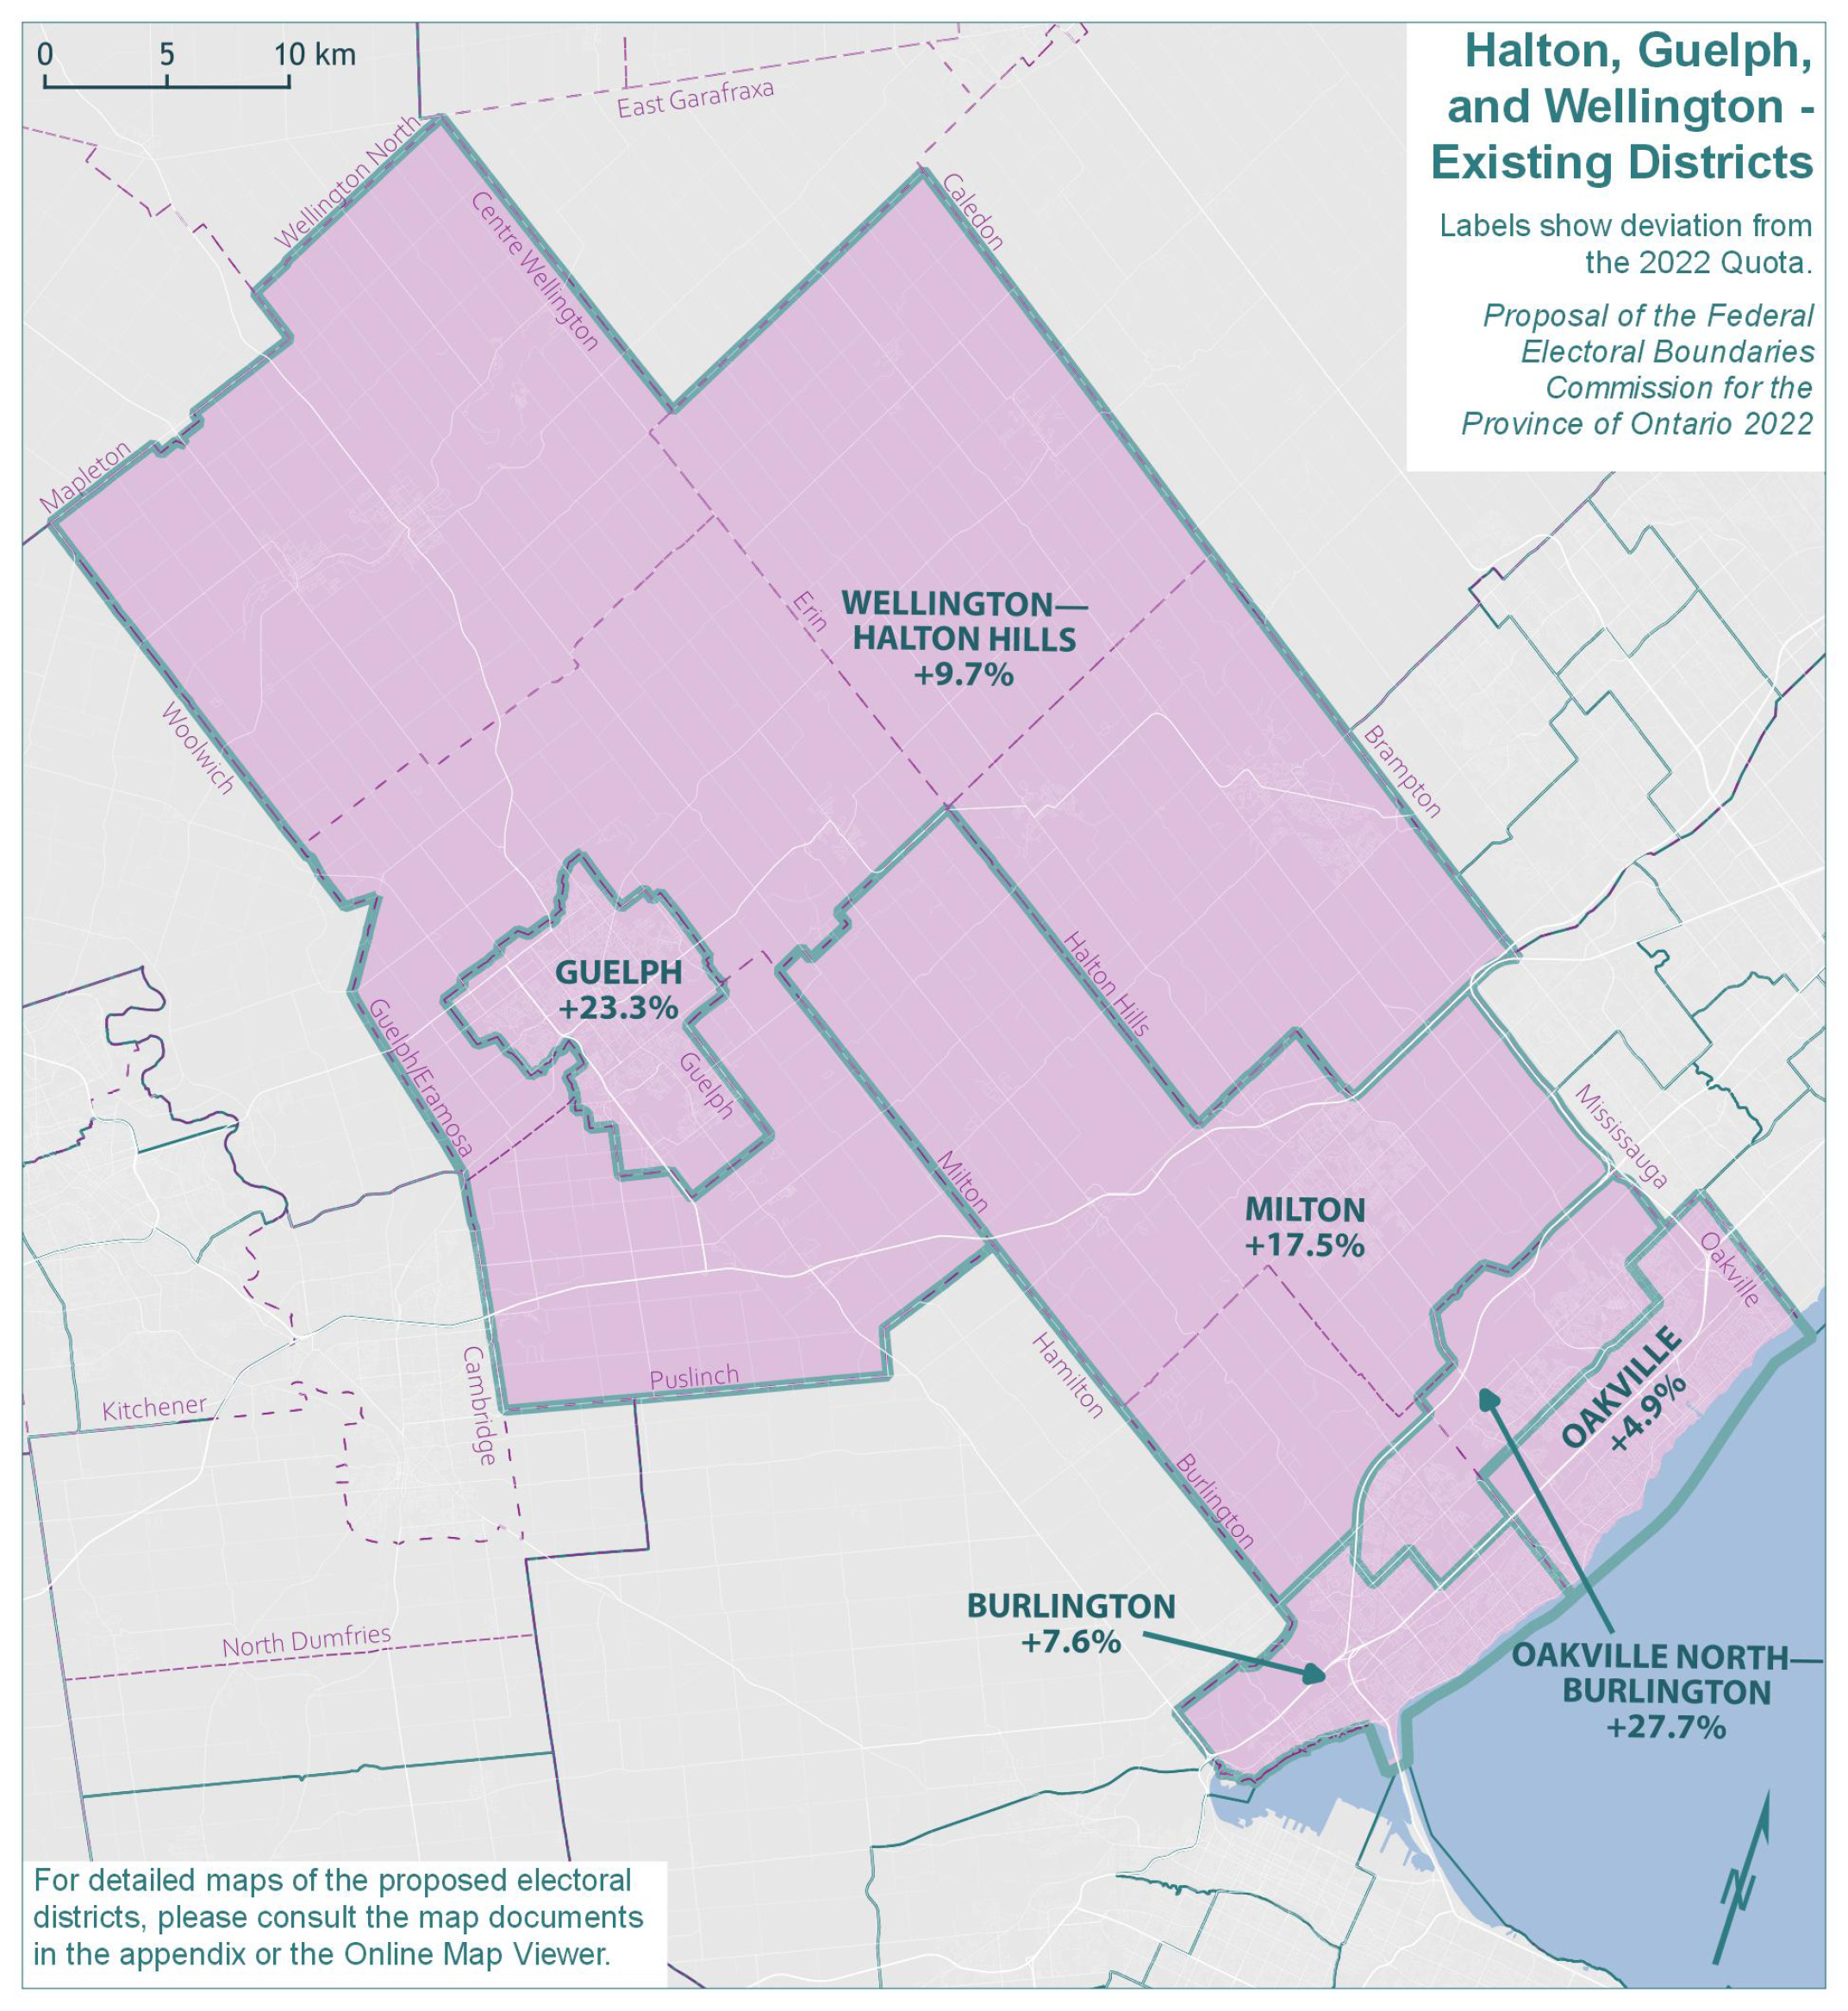
The population of Halton, Guelph, and Wellington grew by 18.4%, from 680,234 in 2011 to 805,299 in 2021. The remainder of Ontario grew by 10.2% in the same period.
The six electoral districts in this geographic piece would have an average 2021 population of 134,217 and an average deviation of 15.1% above the Quota. The existing districts of Oakville North—Burlington, Guelph and Milton are at the highest end for population size across the province, with populations that are, respectively, 27.7%, 23.3% and 17.5% above the Quota. The populations and deviations from the Quota for the existing electoral districts are shown in Table 3A.
| Electoral Districts | Population – 2011 | Deviation from Quota – 2012 | Population – 2021 | Deviation from Quota – 2022 |
|---|---|---|---|---|
| Burlington | 120,569 | 13.52% | 125,435 | 7.59% |
| Guelph | 121,688 | 14.57% | 143,740 | 23.29% |
| Milton | 88,065 | -17.09% | 136,993 | 17.50% |
| Oakville | 119,649 | 12.65% | 122,322 | 4.92% |
| Oakville North—Burlington | 114,378 | 7.69% | 148,936 | 27.74% |
| Wellington—Halton Hills | 115,885 | 9.11% | 127,873 | 9.68% |
| Average | 113,372 | 6.74% | 134,217 | 15.12% |
| Range (most populous to least populous) | 33,623 | 31.66 pp | 26,614 | 22.82 pp |
pp = percentage points
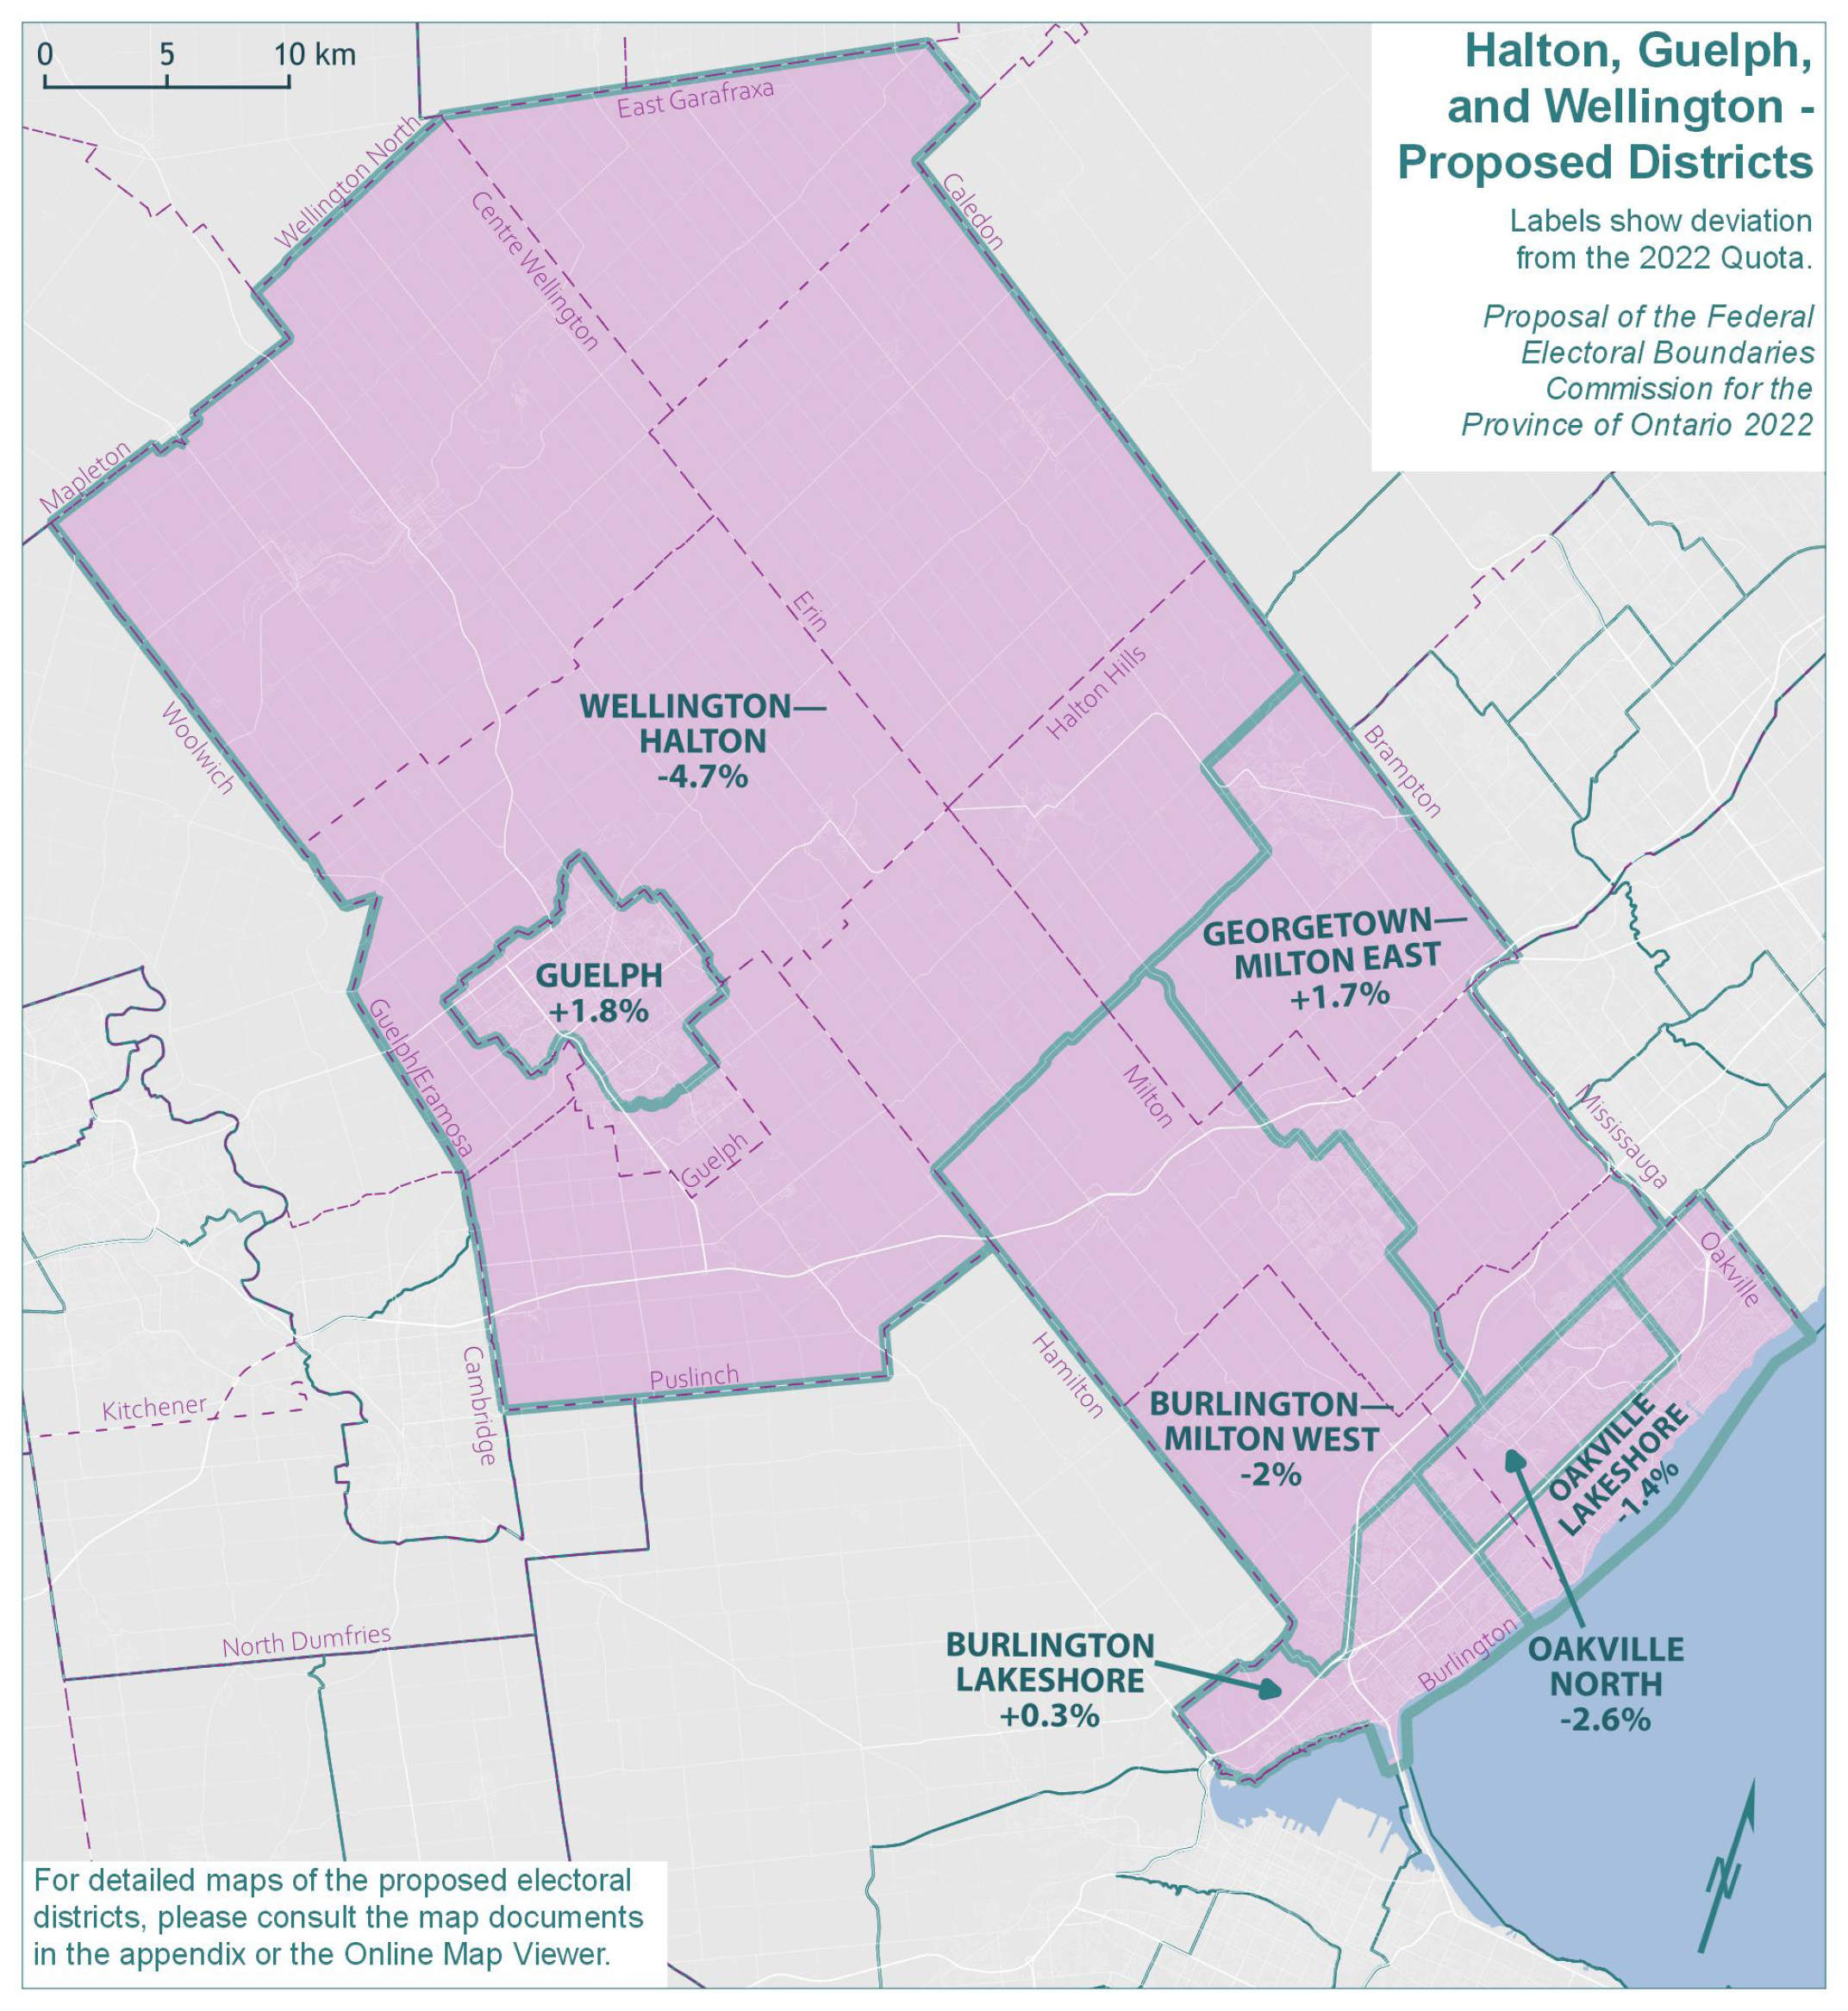
The Commission proposes a new electoral district to resolve the underrepresentation in these districts, considering the current population and anticipated population growth.
This proposal sees five districts in the southernmost part of this geographic piece, where there were previously four. These southernmost districts are now much more balanced in population size and correspond more closely with the boundaries of Halton Region. In the northern part of this geographic piece, the revised district of WELLINGTON—HALTON picks up portions of Guelph, thus bringing the population of the district of GUELPH much closer to the provincial quotient.
The new deviations from the Quota in the proposed redistribution plan are shown in Table 3B.
| Electoral Districts | Population – 2021 | Deviation from Quota – 2022 |
|---|---|---|
| Burlington Lakeshore | 116,984 | 0.34% |
| Burlington—Milton West | 114,218 | -2.03% |
| Georgetown—Milton East | 118,559 | 1.69% |
| Guelph | 118,686 | 1.80% |
| Oakville Lakeshore | 114,917 | -1.43% |
| Oakville North | 113,574 | -2.59% |
| Wellington—Halton | 111,155 | -4.66% |
| Average | 115,442 | -0.98% |
| Range (most populous to least populous) | 7,531 | 6.46 pp |
pp = percentage points
Brampton, Caledon, and Dufferin
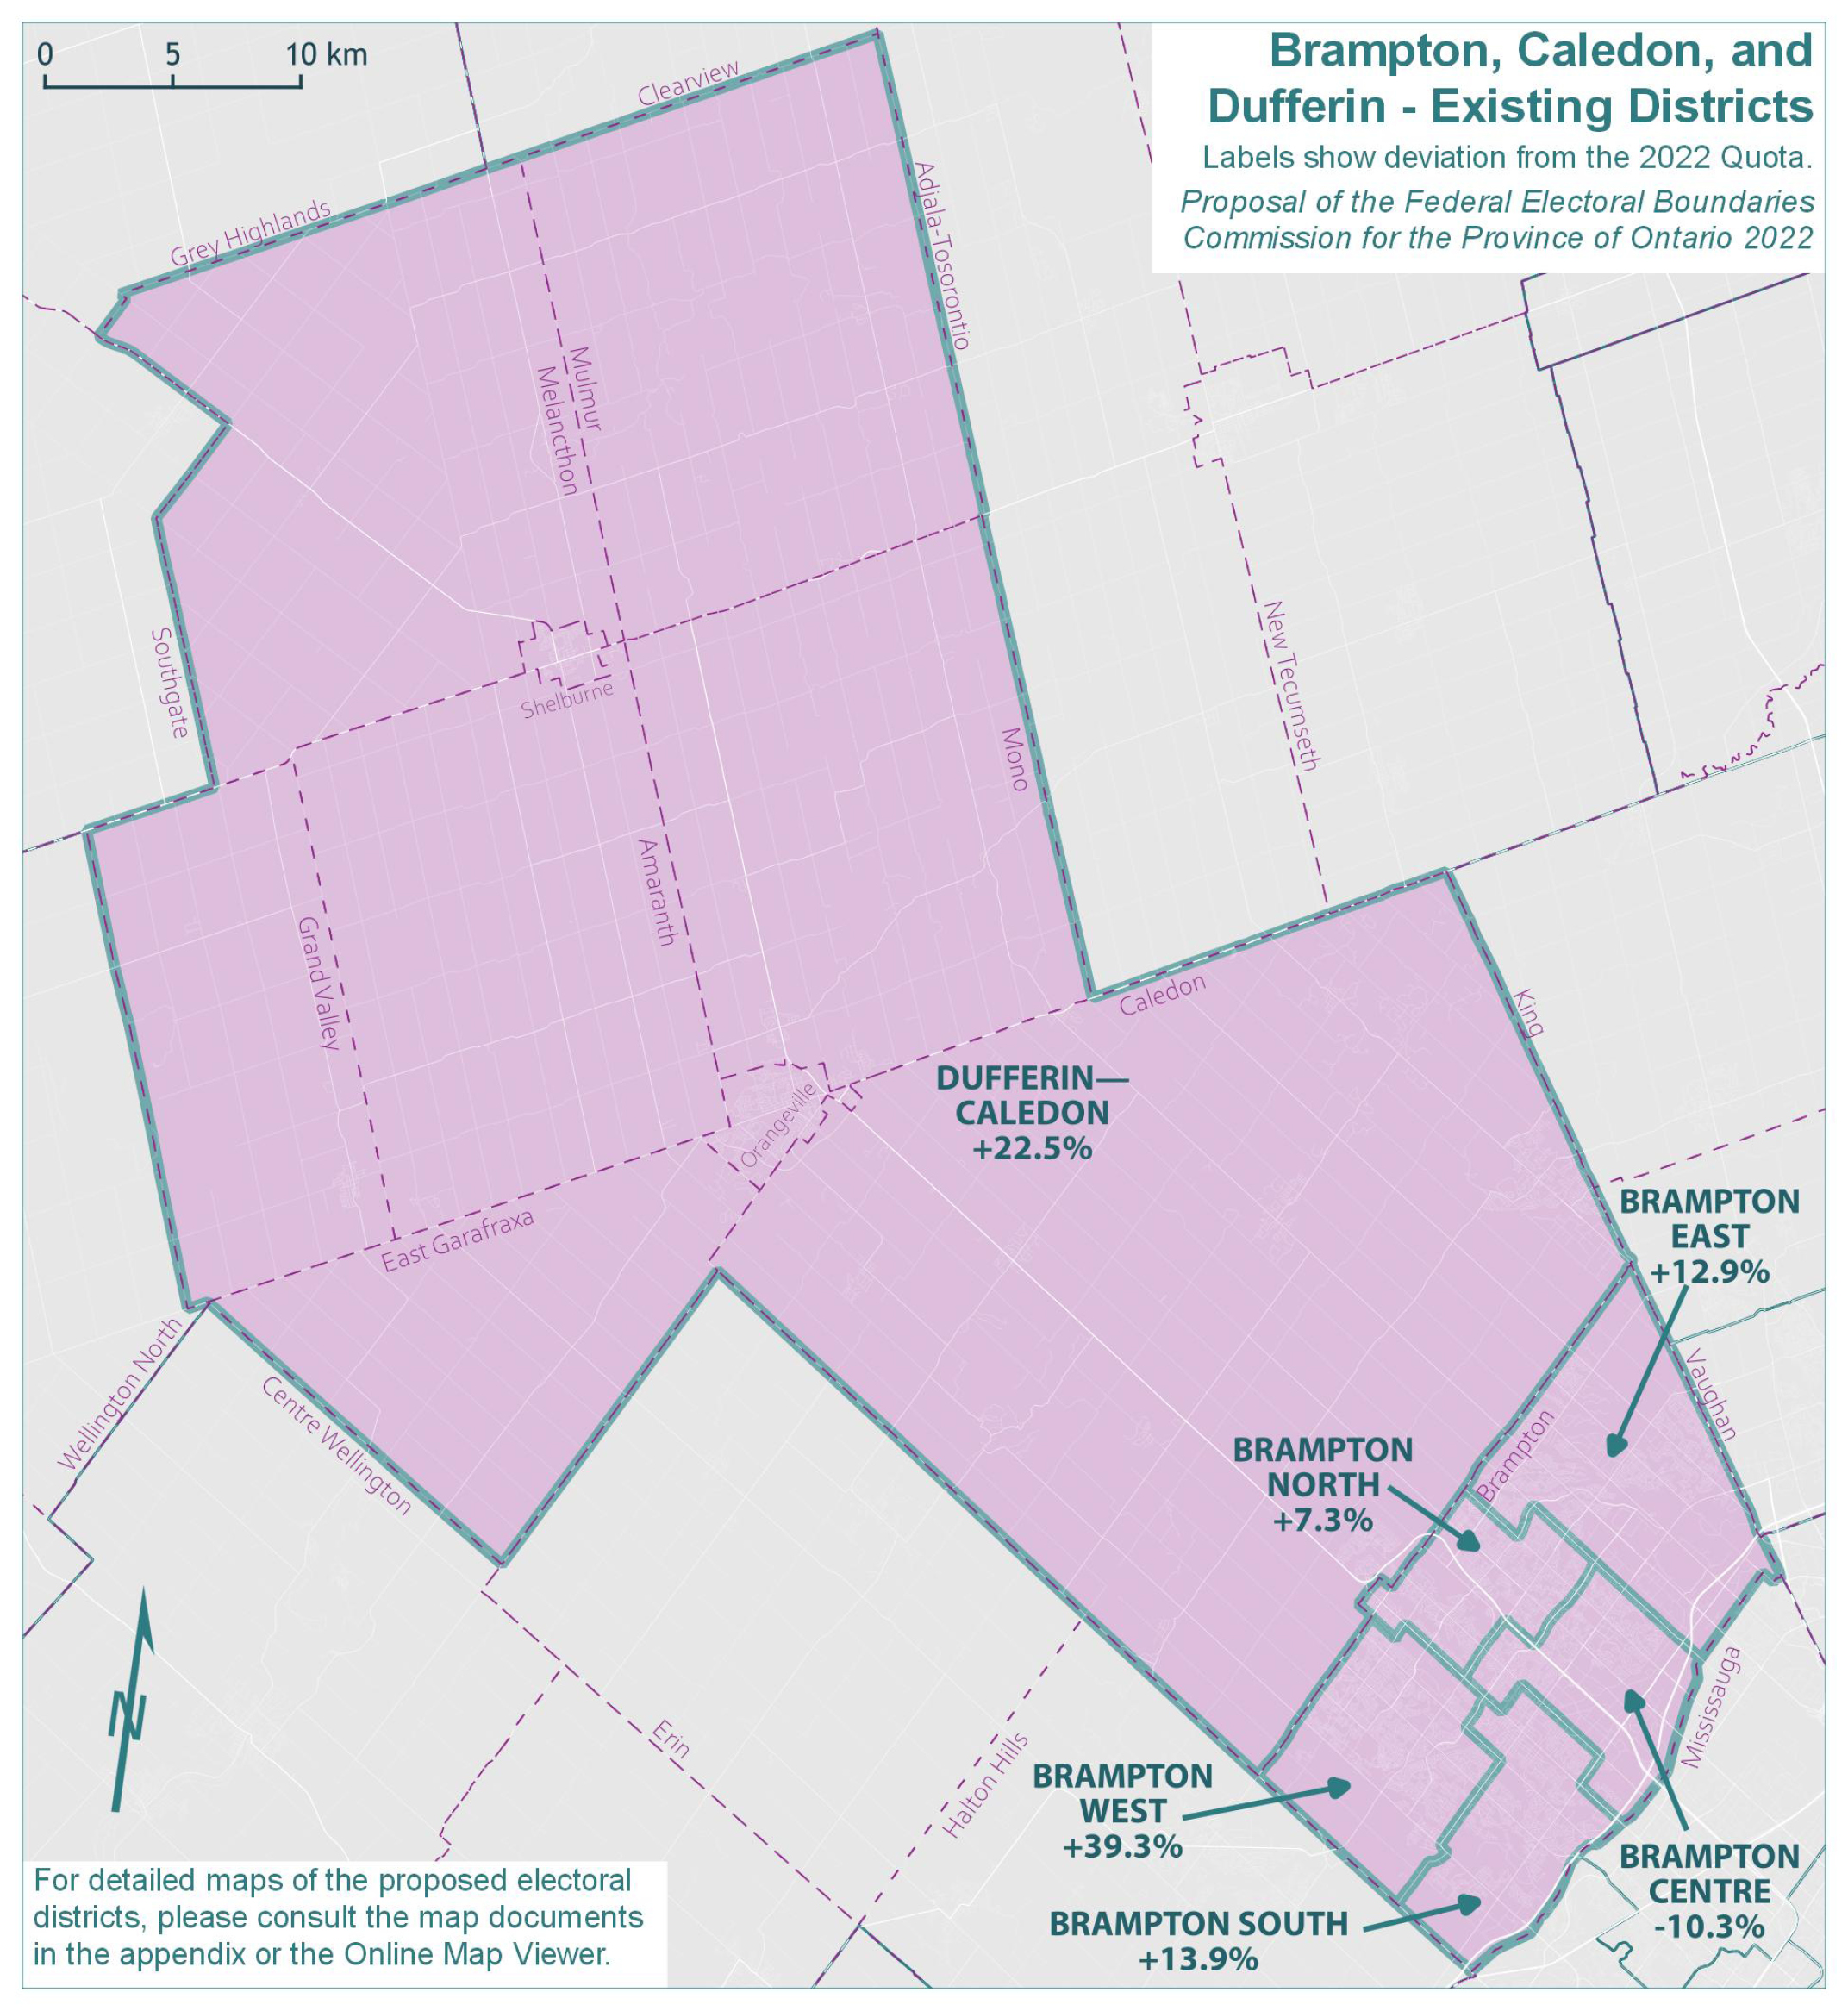
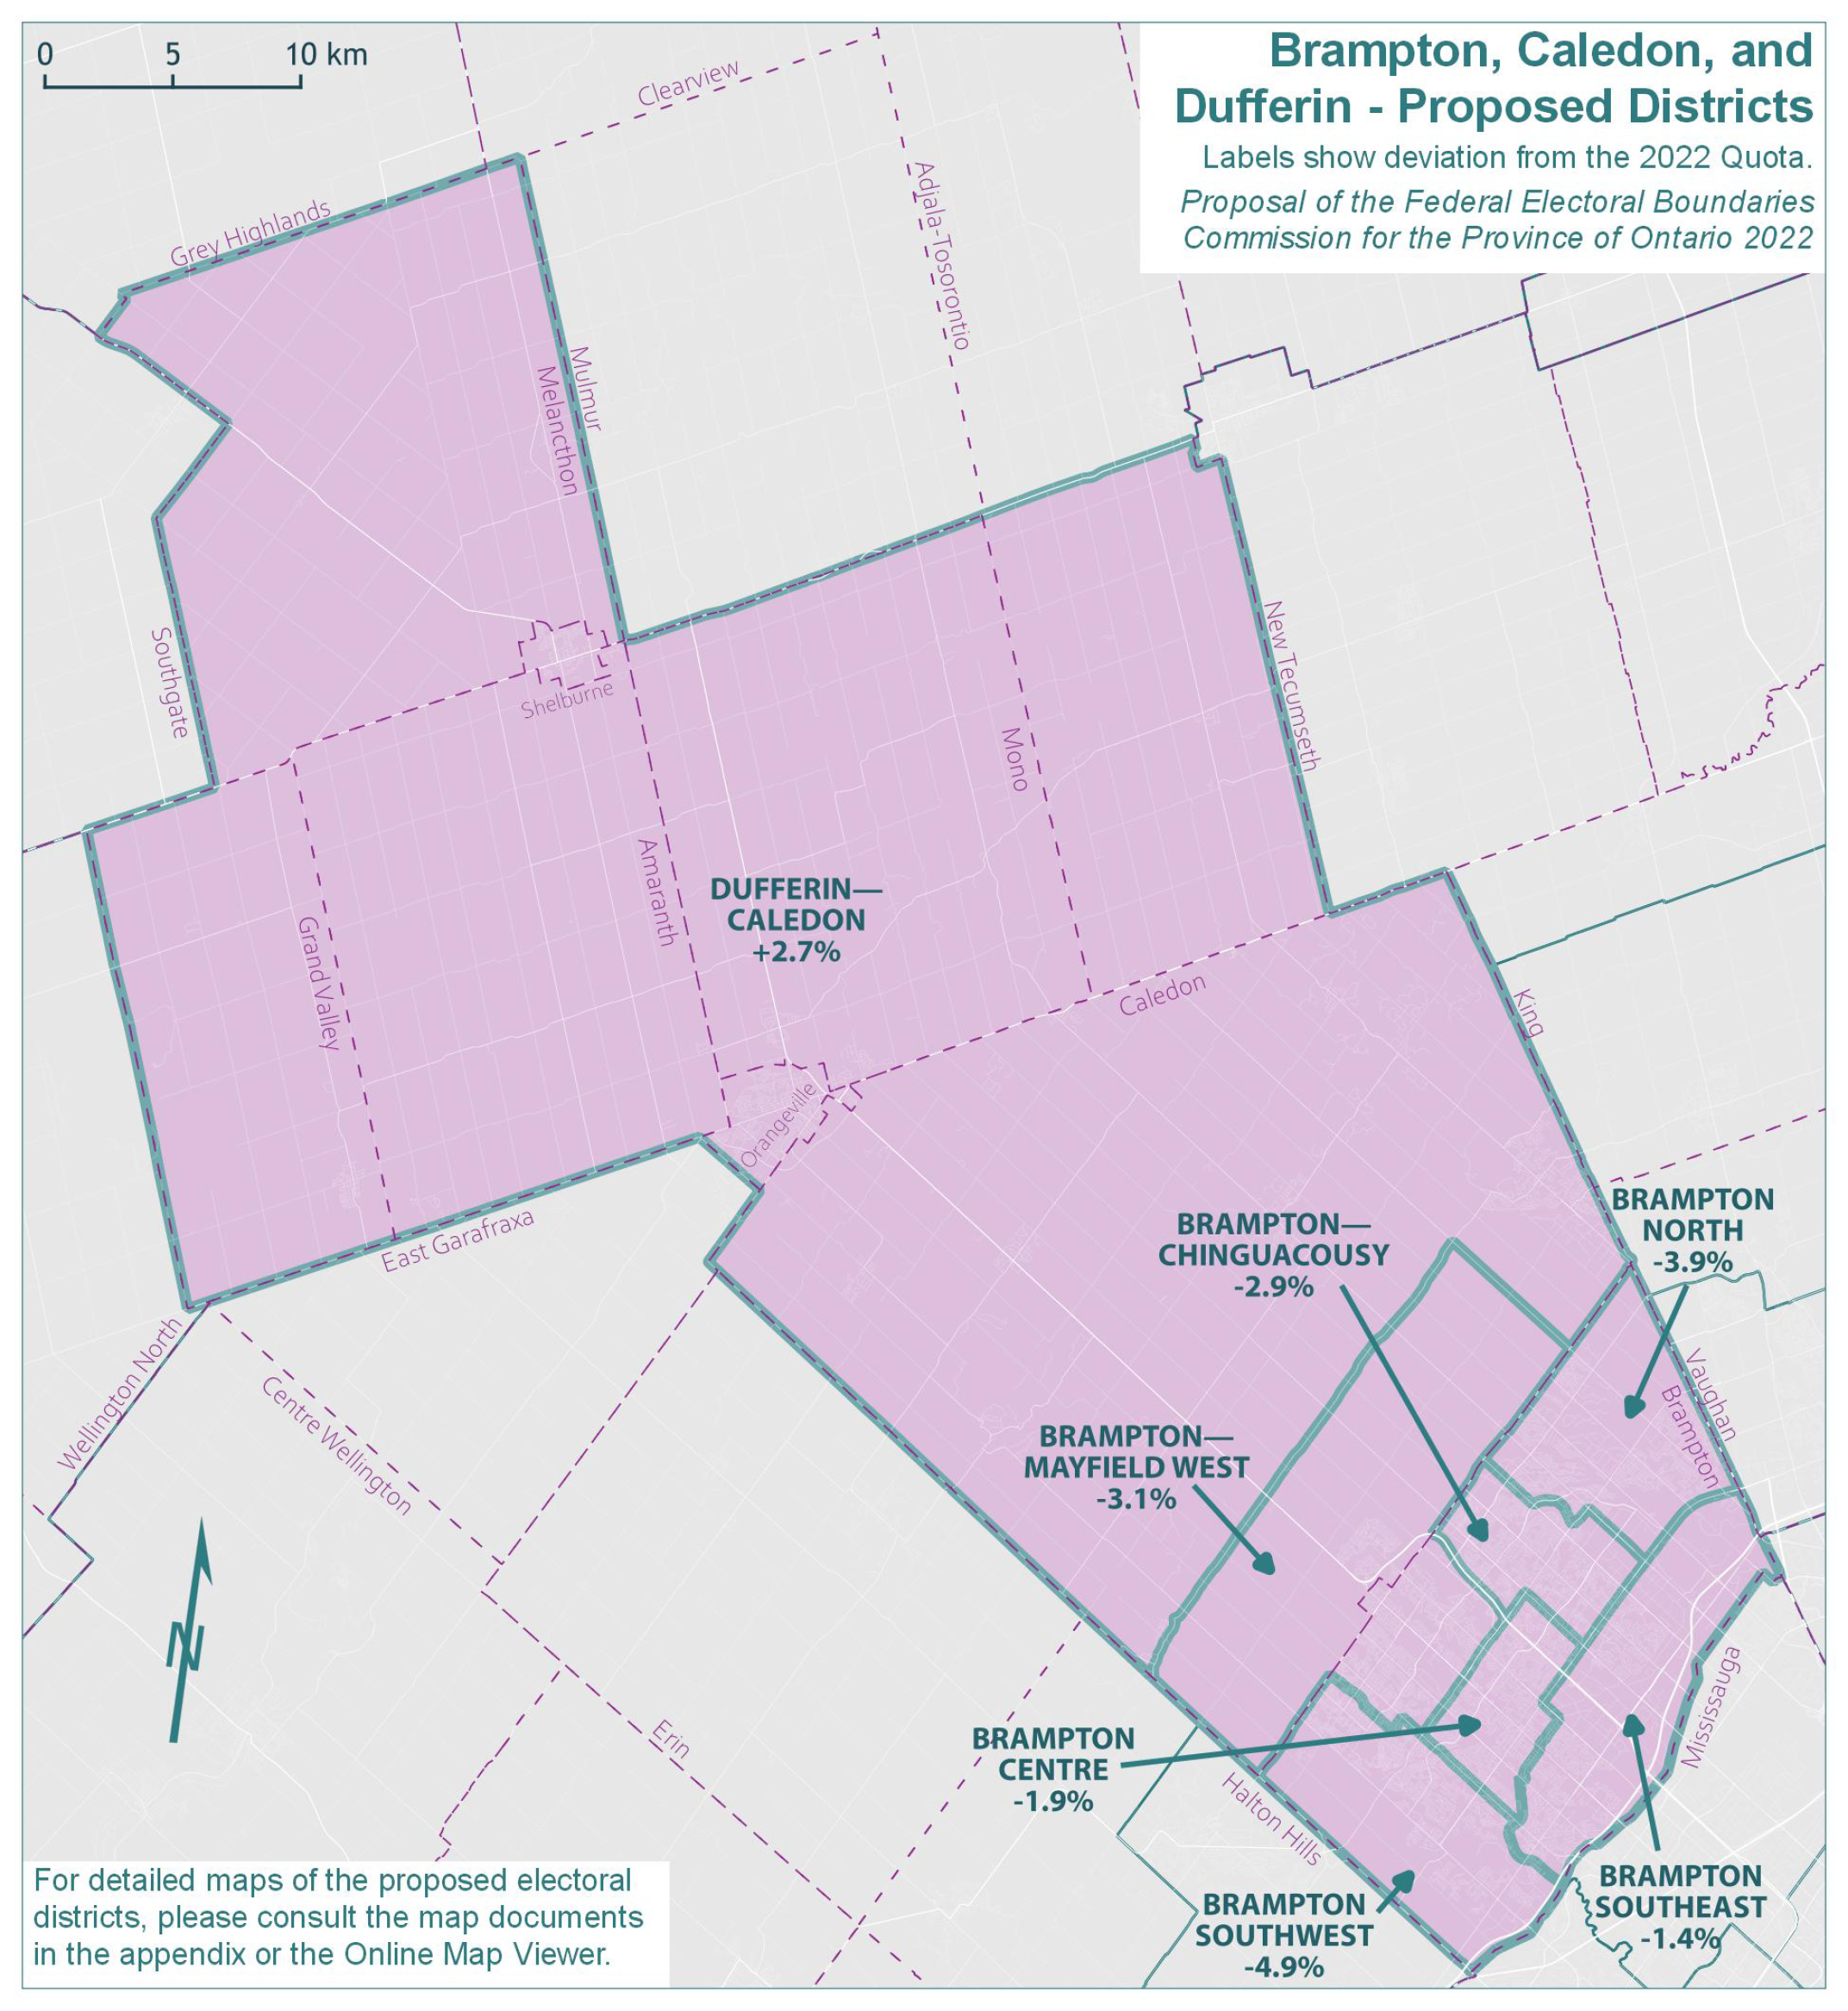
Brampton is another area that has seen considerable population growth over the past decade. The City of Brampton itself, with a current population of 656,480, has risen by 25.3% since 2011, with density spreading northward into Caledon and Dufferin County. This is the largest population growth of any Ontario city with a population over 100,000. Taken as a geographic piece, the population of Brampton, Caledon, and Dufferin grew by 24.8%, from 640,247 in 2011 to 799,318 in 2021. The remainder of Ontario grew by 9.9% in the same period.
The existing six electoral districts in this geographic piece would have an average 2021 population of 133,220, which falls 14.3% above the Quota. Brampton West (with 162,353 residents) currently has the highest population of all districts in the province, while Dufferin—Caledon also falls near the top. As indicated by the deviation range (49.6 percentage points) relative to the 2022 Quota, there are substantial disparities in population size between districts, particularly between the adjacent ridings of Brampton West and Brampton Centre. The populations and deviations from the Quota for the existing electoral districts are shown in Table 4A.
| Electoral Districts | Population – 2011 | Deviation from Quota – 2012 | Population – 2021 | Deviation from Quota – 2022 |
|---|---|---|---|---|
| Brampton Centre | 103,122 | -2.91% | 104,557 | -10.32% |
| Brampton East | 99,712 | -6.12% | 131,677 | 12.94% |
| Brampton North | 111,951 | 5.40% | 125,141 | 7.33% |
| Brampton South | 107,364 | 1.08% | 132,752 | 13.86% |
| Brampton West | 101,757 | -4.20% | 162,353 | 39.25% |
| Dufferin—Caledon | 116,341 | 9.53% | 142,838 | 22.51% |
| Average | 106,708 | 0.46% | 133,220 | 14.26% |
| Range (most populous to least populous) | 16,629 | 15.65 pp | 57,796 | 49.57 pp |
pp = percentage points
Given its population size and anticipated growth, the Commission concluded that this area requires a new electoral district.
The proposed addition of a seventh district, together with the obligation to address the wide population disparities described above, requires significant boundary reconfigurations, especially of those districts that lay within the City of Brampton.
These proposed district boundaries all align with historical boundaries between the City of Brampton and the City of Mississauga (to the south), the Regional Municipality of Halton (to the west), and the City of Vaughan and the Township of King (to the east). However, the proposed district of BRAMPTON—MAYFIELD WEST extends northward beyond the municipal boundary to pick up a portion of the neighbouring district of Dufferin—Caledon. These revised boundaries thus reduce the population of the DUFFERIN—CALEDON district, drawing it closer to the Quota.
Pursuant to the proposed redistribution plan, these seven districts in this geographic piece all have comparable populations and manageable geographic size and respect as much as possible distinctive historical communities.
The new deviations from the Quota in the proposed redistribution plan are shown in Table 4B.
| Electoral Districts | Population – 2021 | Deviation from Quota – 2022 |
|---|---|---|
| Brampton Centre | 114,422 | -1.86% |
| Brampton—Chinguacousy | 113,201 | -2.91% |
| Brampton—Mayfield West | 112,994 | -3.08% |
| Brampton North | 112,082 | -3.87% |
| Brampton Southeast | 114,952 | -1.40% |
| Brampton Southwest | 110,855 | -4.92% |
| Dufferin—Caledon | 119,767 | 2.72% |
| Average | 114,039 | -2.19% |
| Range (most populous to least populous) | 8,912 | 7.64 pp |
pp = percentage points
Central Ontario, Eastern Greater Toronto Area, & Northern Greater Toronto Area
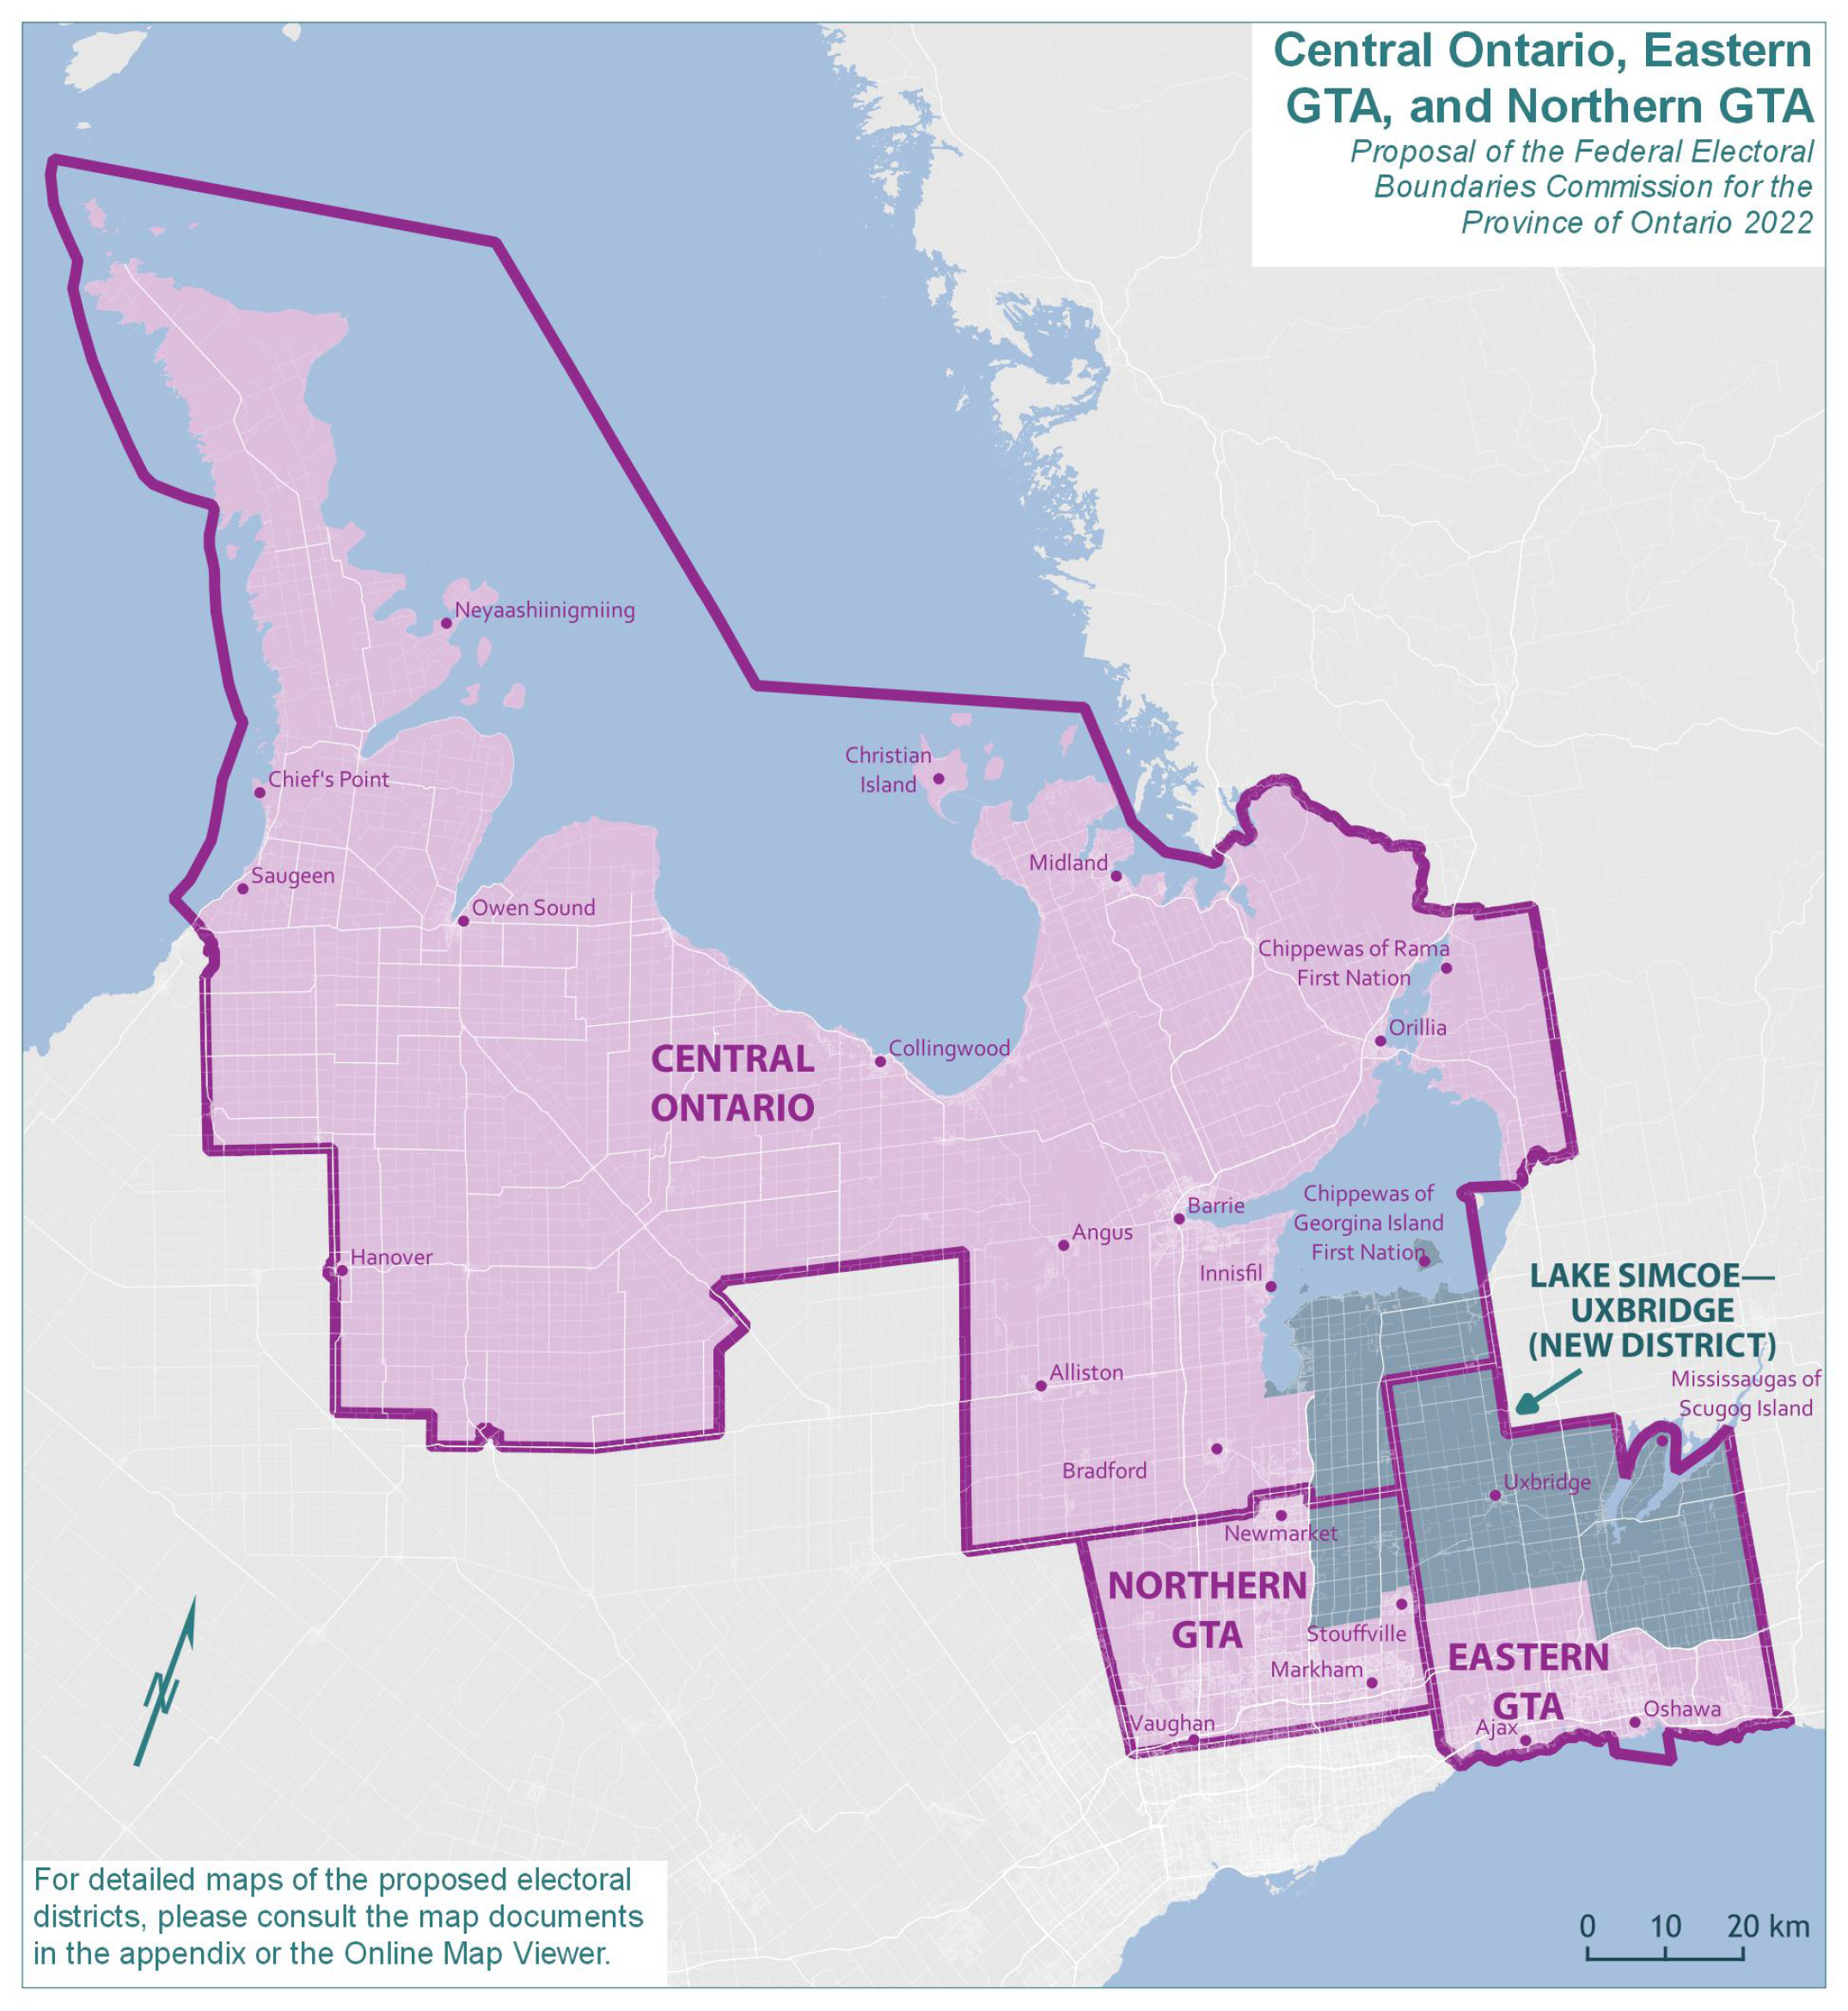
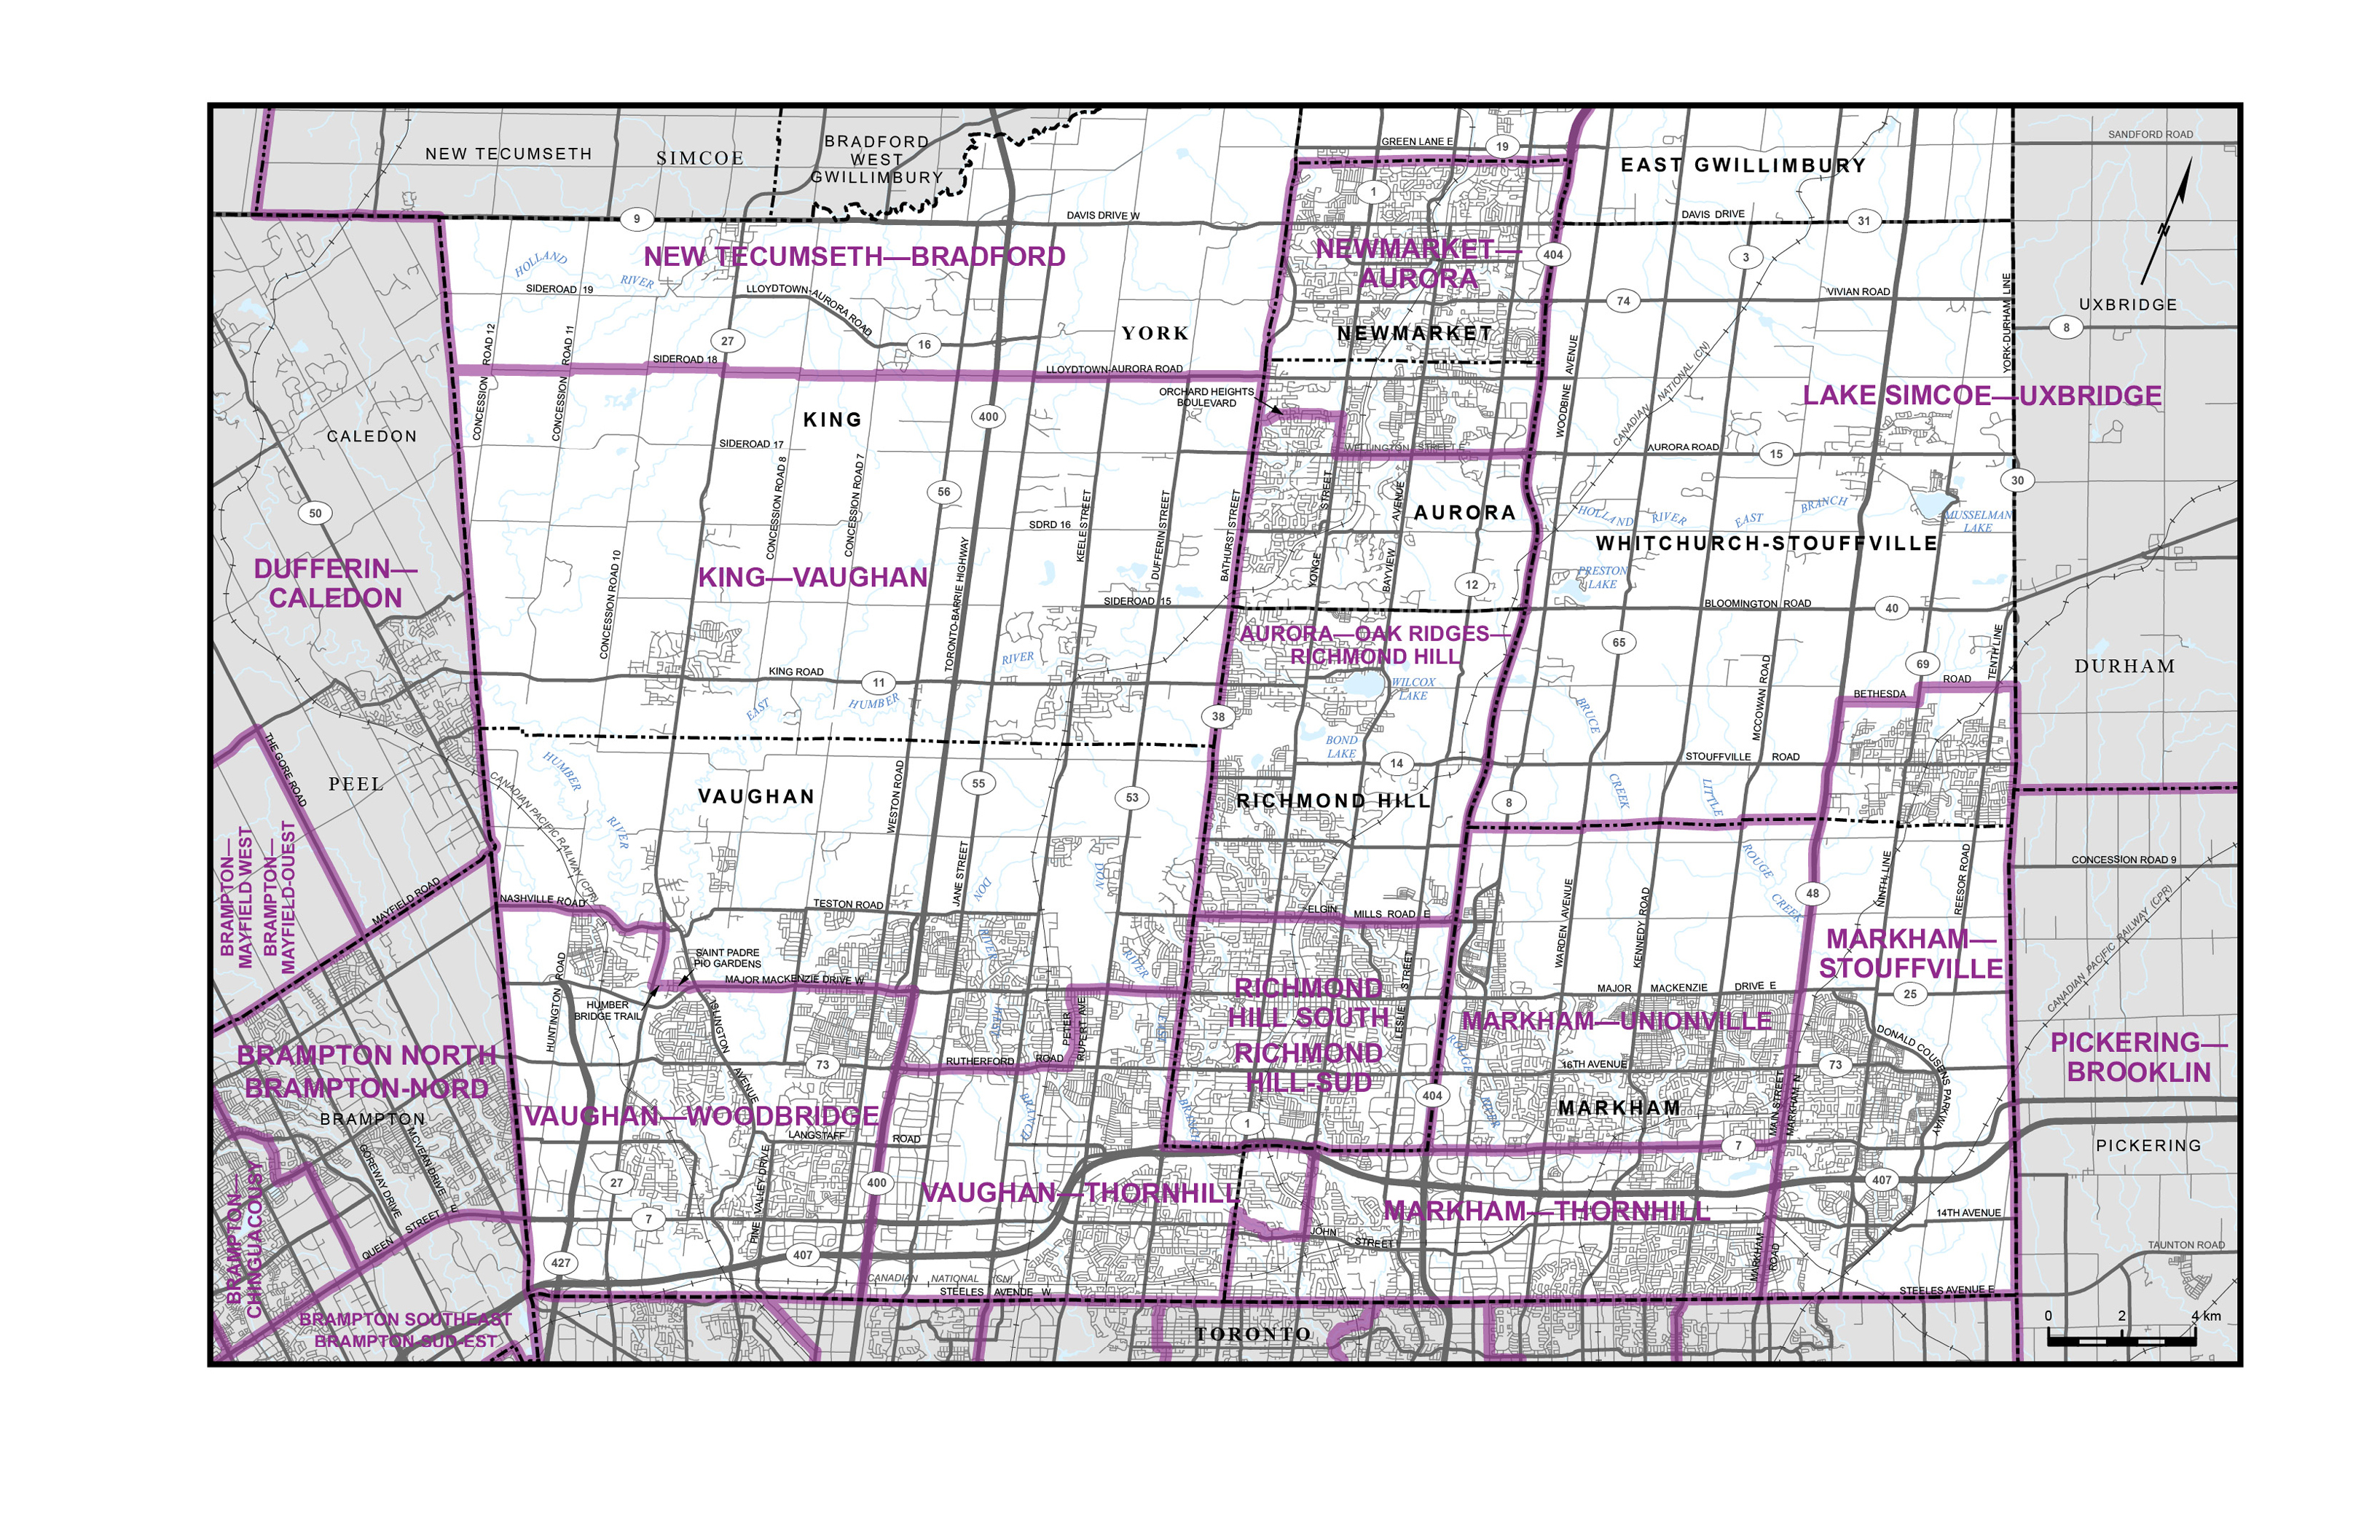
We turn next to the broad region fanning north from the Greater Toronto Area (GTA) towards Georgian Bay, Lake Simcoe, and Lake Scugog. The Commission proposes the addition of a single new electoral district, LAKE SIMCOE—UXBRIDGE, which lies at the geographic centre of this region and has implications cascading outward. We present this discussion in three geographic pieces, beginning with Central Ontario, moving down to Northern GTA, then across to Eastern GTA.
Central Ontario
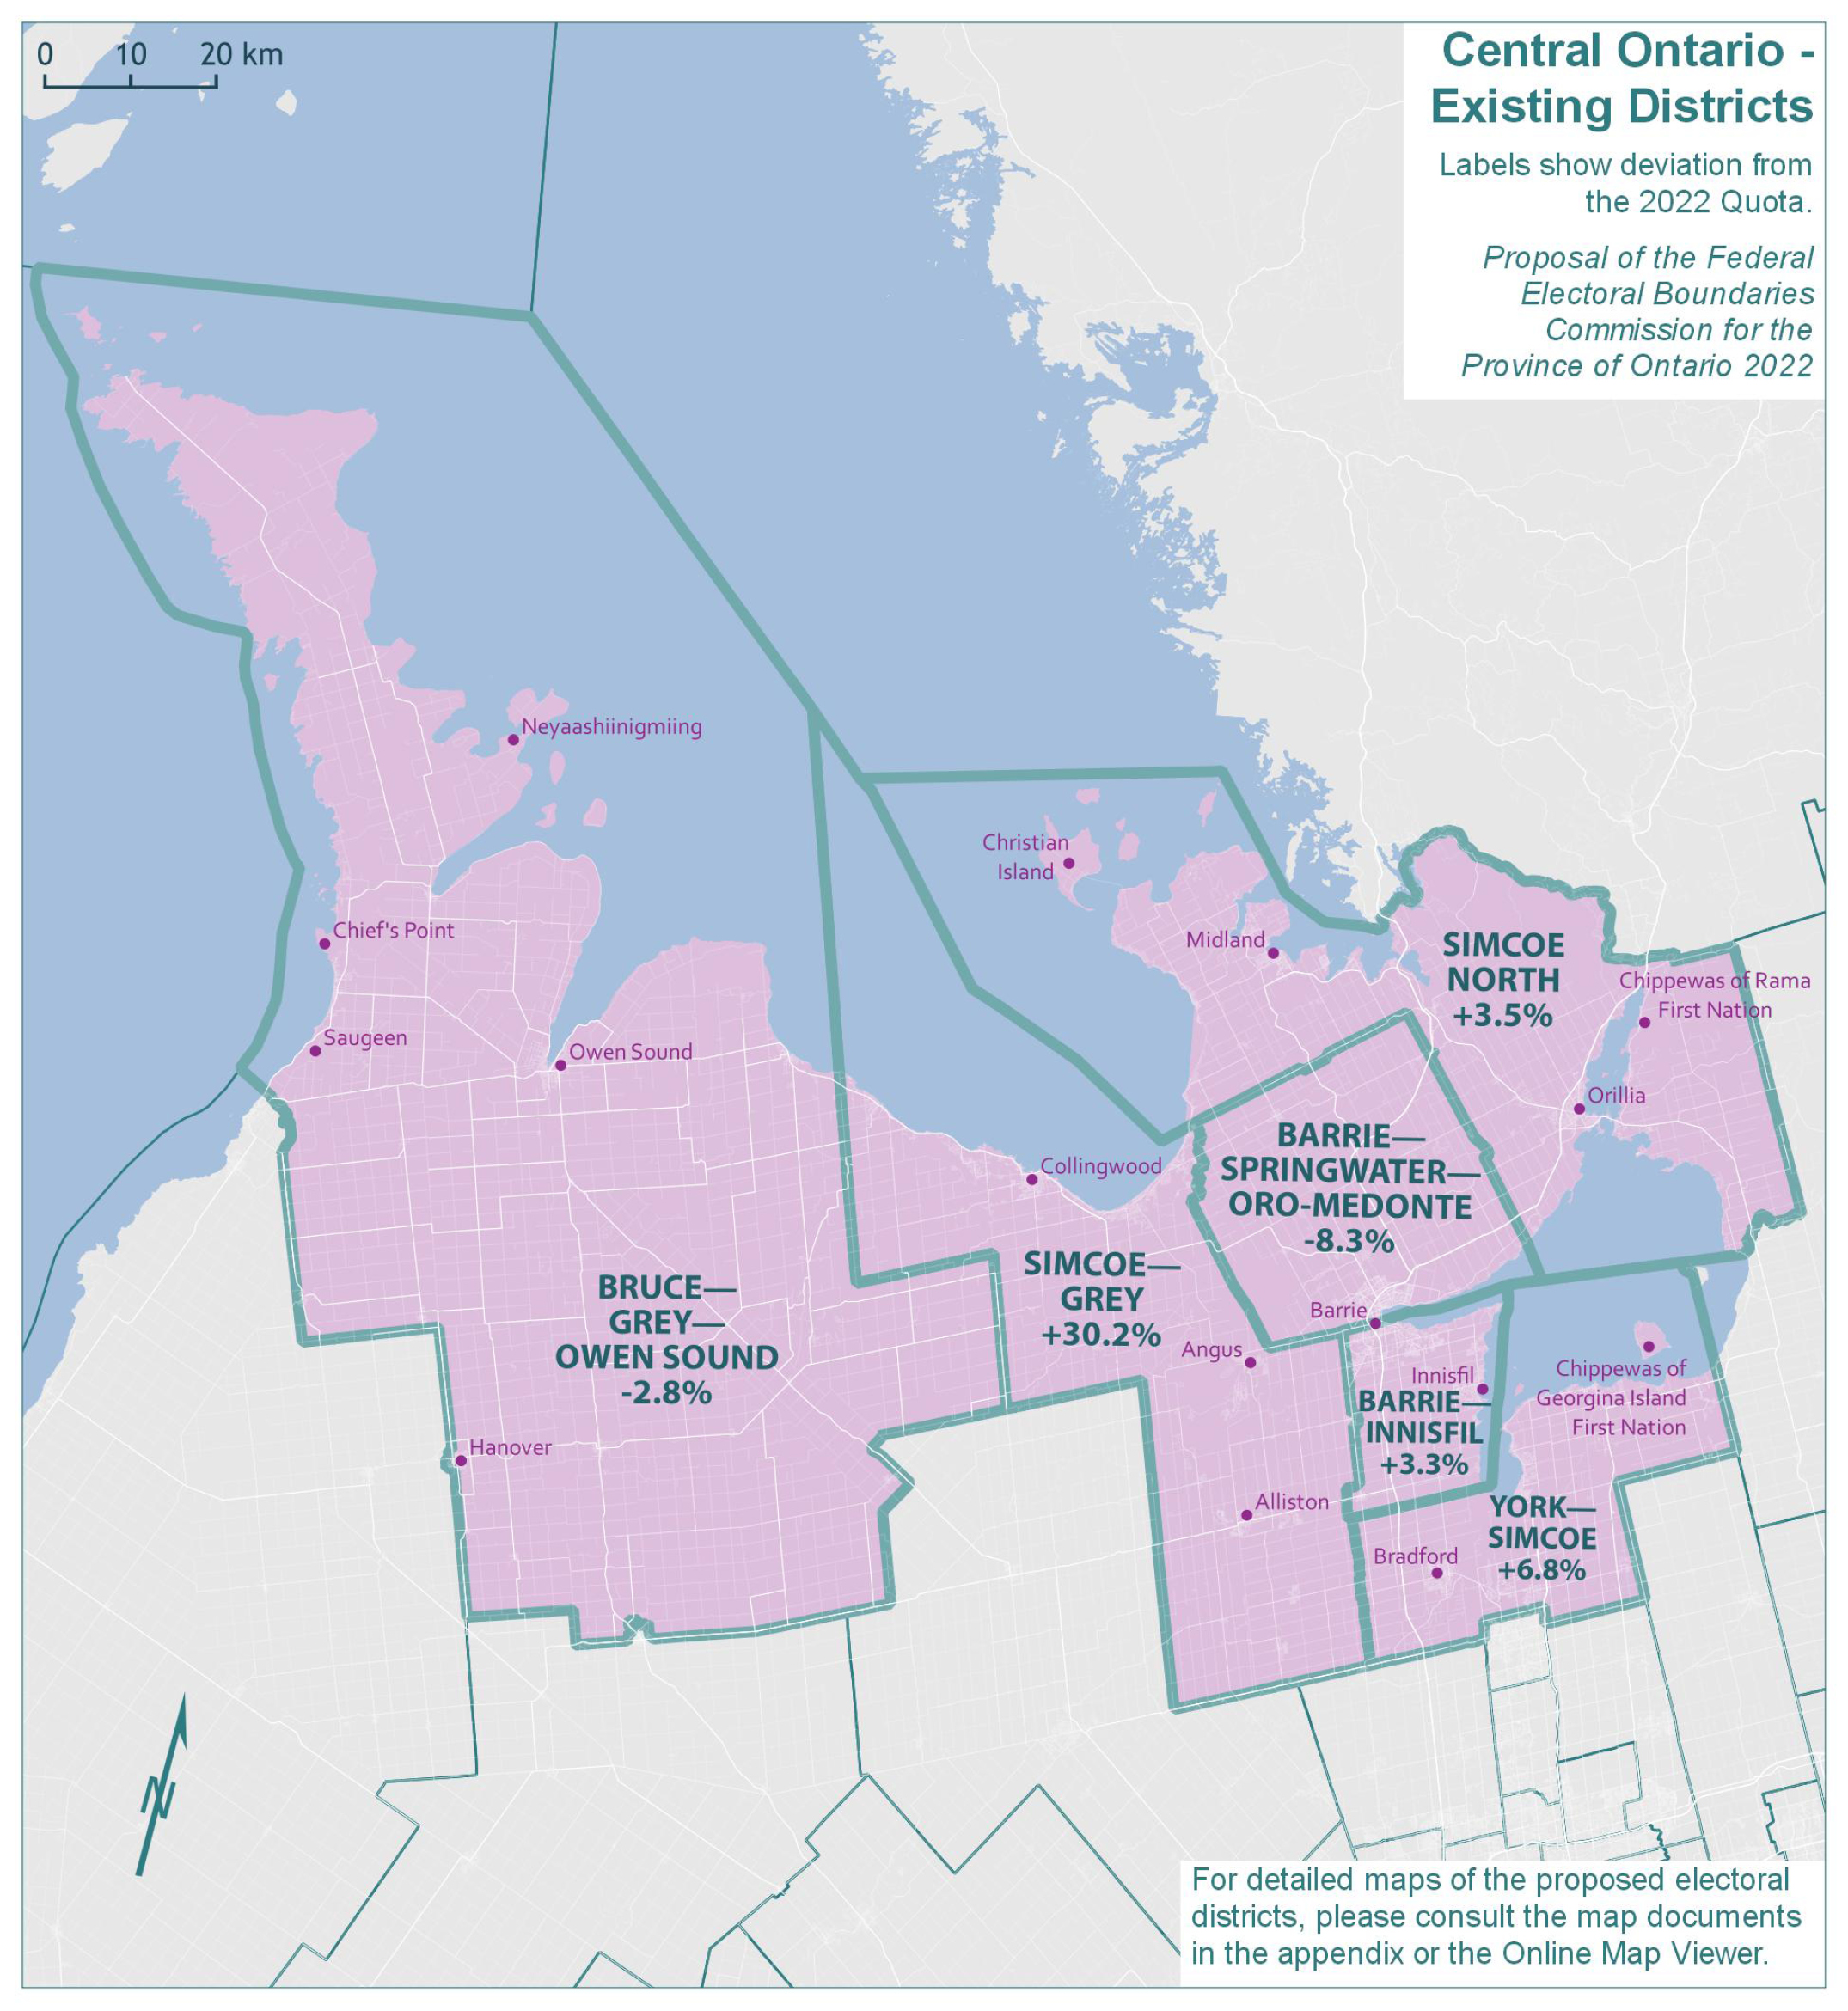
The population of Central Ontario grew by 17.9%, from 625,530 in 2011 to 737,495 in 2021. The remainder of Ontario grew by 10.3% in the same period.
The existing six electoral districts in Central Ontario have an average 2021 population of 122,916 and fall 5.4% above the Quota. As indicated by the deviation range (38.5 percentage points), there are substantial disparities in the population size of districts. Simcoe—Grey has grown especially large, whereas other districts fall reasonably close to the 2022 Quota.
The populations and deviations from the Quota for the existing electoral districts are shown in Table 5A.
| Electoral Districts | Population – 2011 | Deviation from Quota – 2012 | Population – 2021 | Deviation from Quota – 2022 |
|---|---|---|---|---|
| Barrie—Innisfil | 101,584 | -4.36% | 120,378 | 3.25% |
| Barrie—Springwater—Oro-Medonte | 97,876 | -7.85% | 106,871 | -8.34% |
| Bruce—Grey—Owen Sound | 106,475 | 0.25% | 113,348 | -2.78% |
| Simcoe—Grey | 116,307 | 9.50% | 151,784 | 30.19% |
| Simcoe North | 108,672 | 2.31% | 120,656 | 3.49% |
| York—Simcoe | 94,616 | -10.92% | 124,458 | 6.75% |
| Average | 104,255 | -1.85% | 122,916 | 5.43% |
| Range (most populous to least populous) | 21,691 | 20.42 pp | 44,913 | 38.53 pp |
pp = percentage points
The proposed new district of LAKE SIMCOE—UXBRIDGE encompasses a portion of the existing district of York—Simcoe (as shown in the illustration above), plus portions of the existing districts of Markham—Stouffville (shown below in Northern GTA), and Pickering—Uxbridge and Durham (shown below in Eastern GTA).
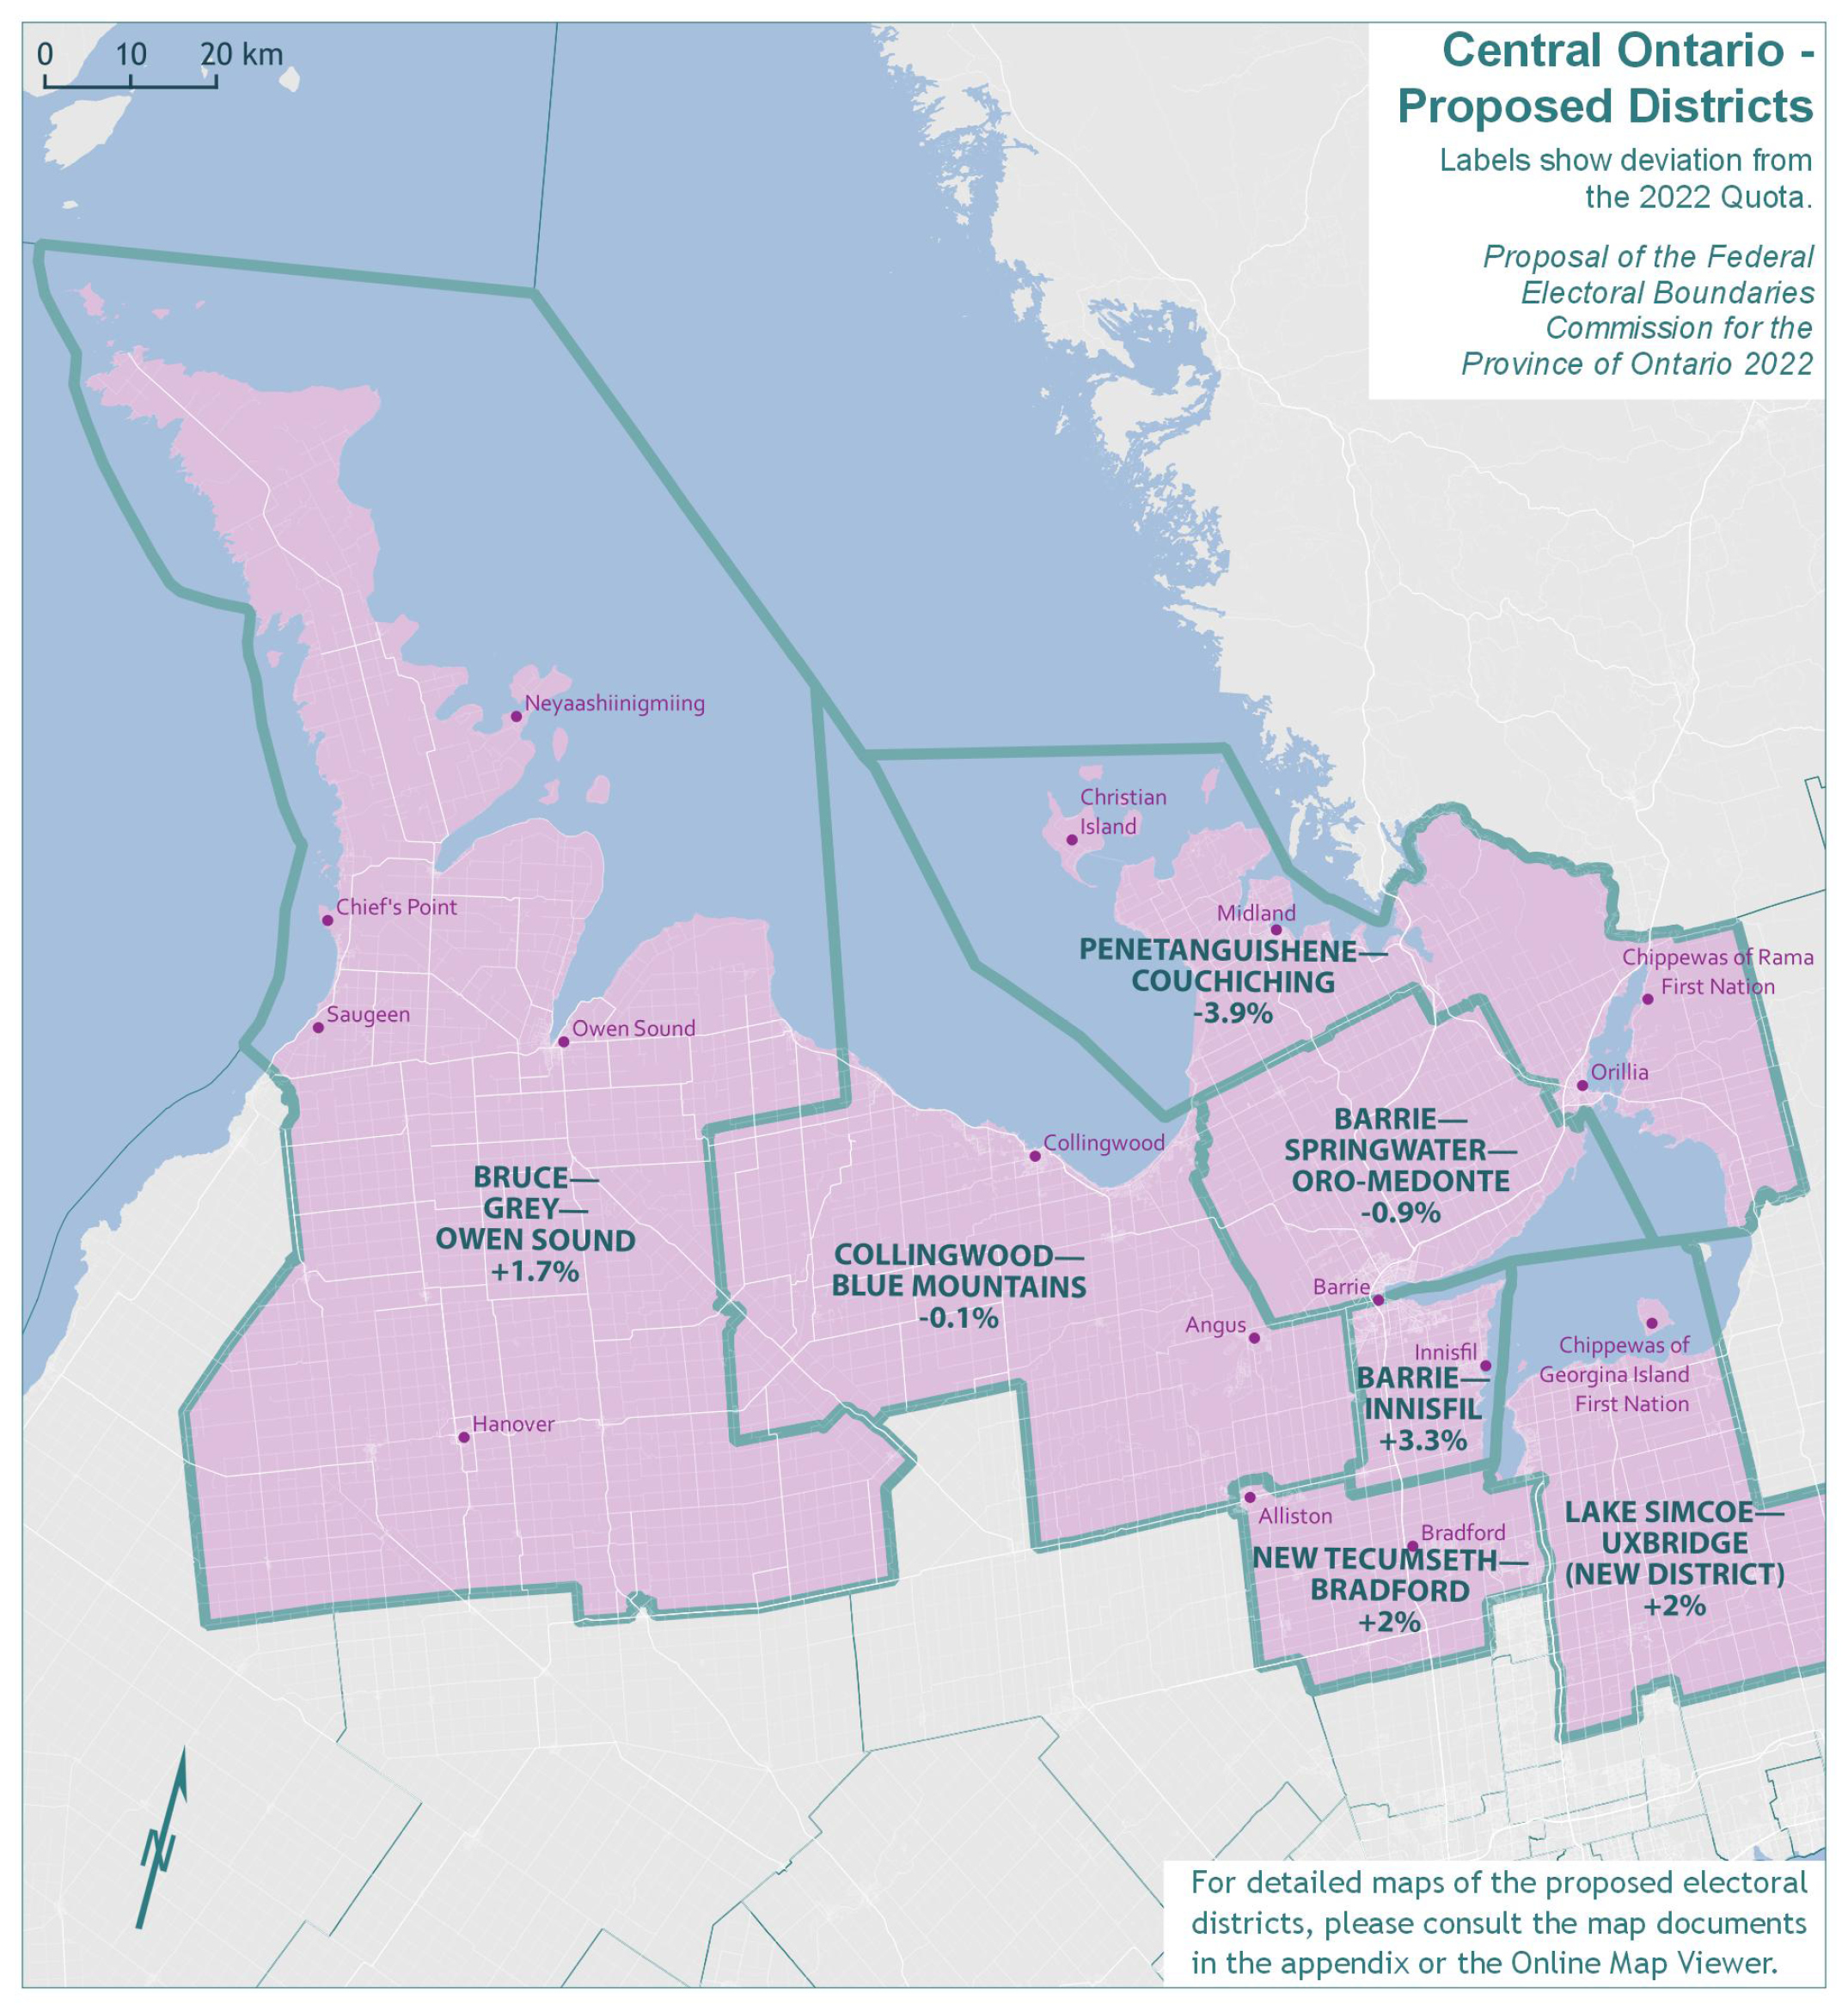
In addition to the new district, boundaries are redrawn to balance the populations of the other six districts. In particular, the southern boundary of the existing district of Simcoe—Grey is shifted north and this district is renamed COLLINGWOOD—BLUE MOUNTAINS. The growing community of New Tecumseth now falls in a newly named district, NEW TECUMSETH—BRADFORD.
The new deviations from the Quota in the proposed redistribution plan are shown in Table 5B.
| Electoral Districts | Population – 2021 | Deviation from Quota – 2022 |
|---|---|---|
| Barrie—Innisfil | 120,378 | 3.25% |
| Barrie—Springwater—Oro-Medonte | 115,495 | -0.94% |
| Bruce—Grey—Owen Sound | 118,588 | 1.71% |
| Collingwood—Blue Mountains | 116,511 | -0.07% |
| Lake Simcoe—Uxbridge (New District) | 118,867 | 1.95% |
| New Tecumseth—Bradford | 118,958 | 2.03% |
| Penetanguishene—Couchiching | 112,022 | -3.92% |
| Average | 117,260 | 0.57% |
| Range (most populous to least populous) | 8,356 | 7.17 pp |
pp = percentage points
Northern Greater Toronto Area
The population of Northern GTA grew by 13%, from 965,985 in 2011 to 1,091,756 in 2021. The remainder of Ontario grew by 10.5% in the same period.
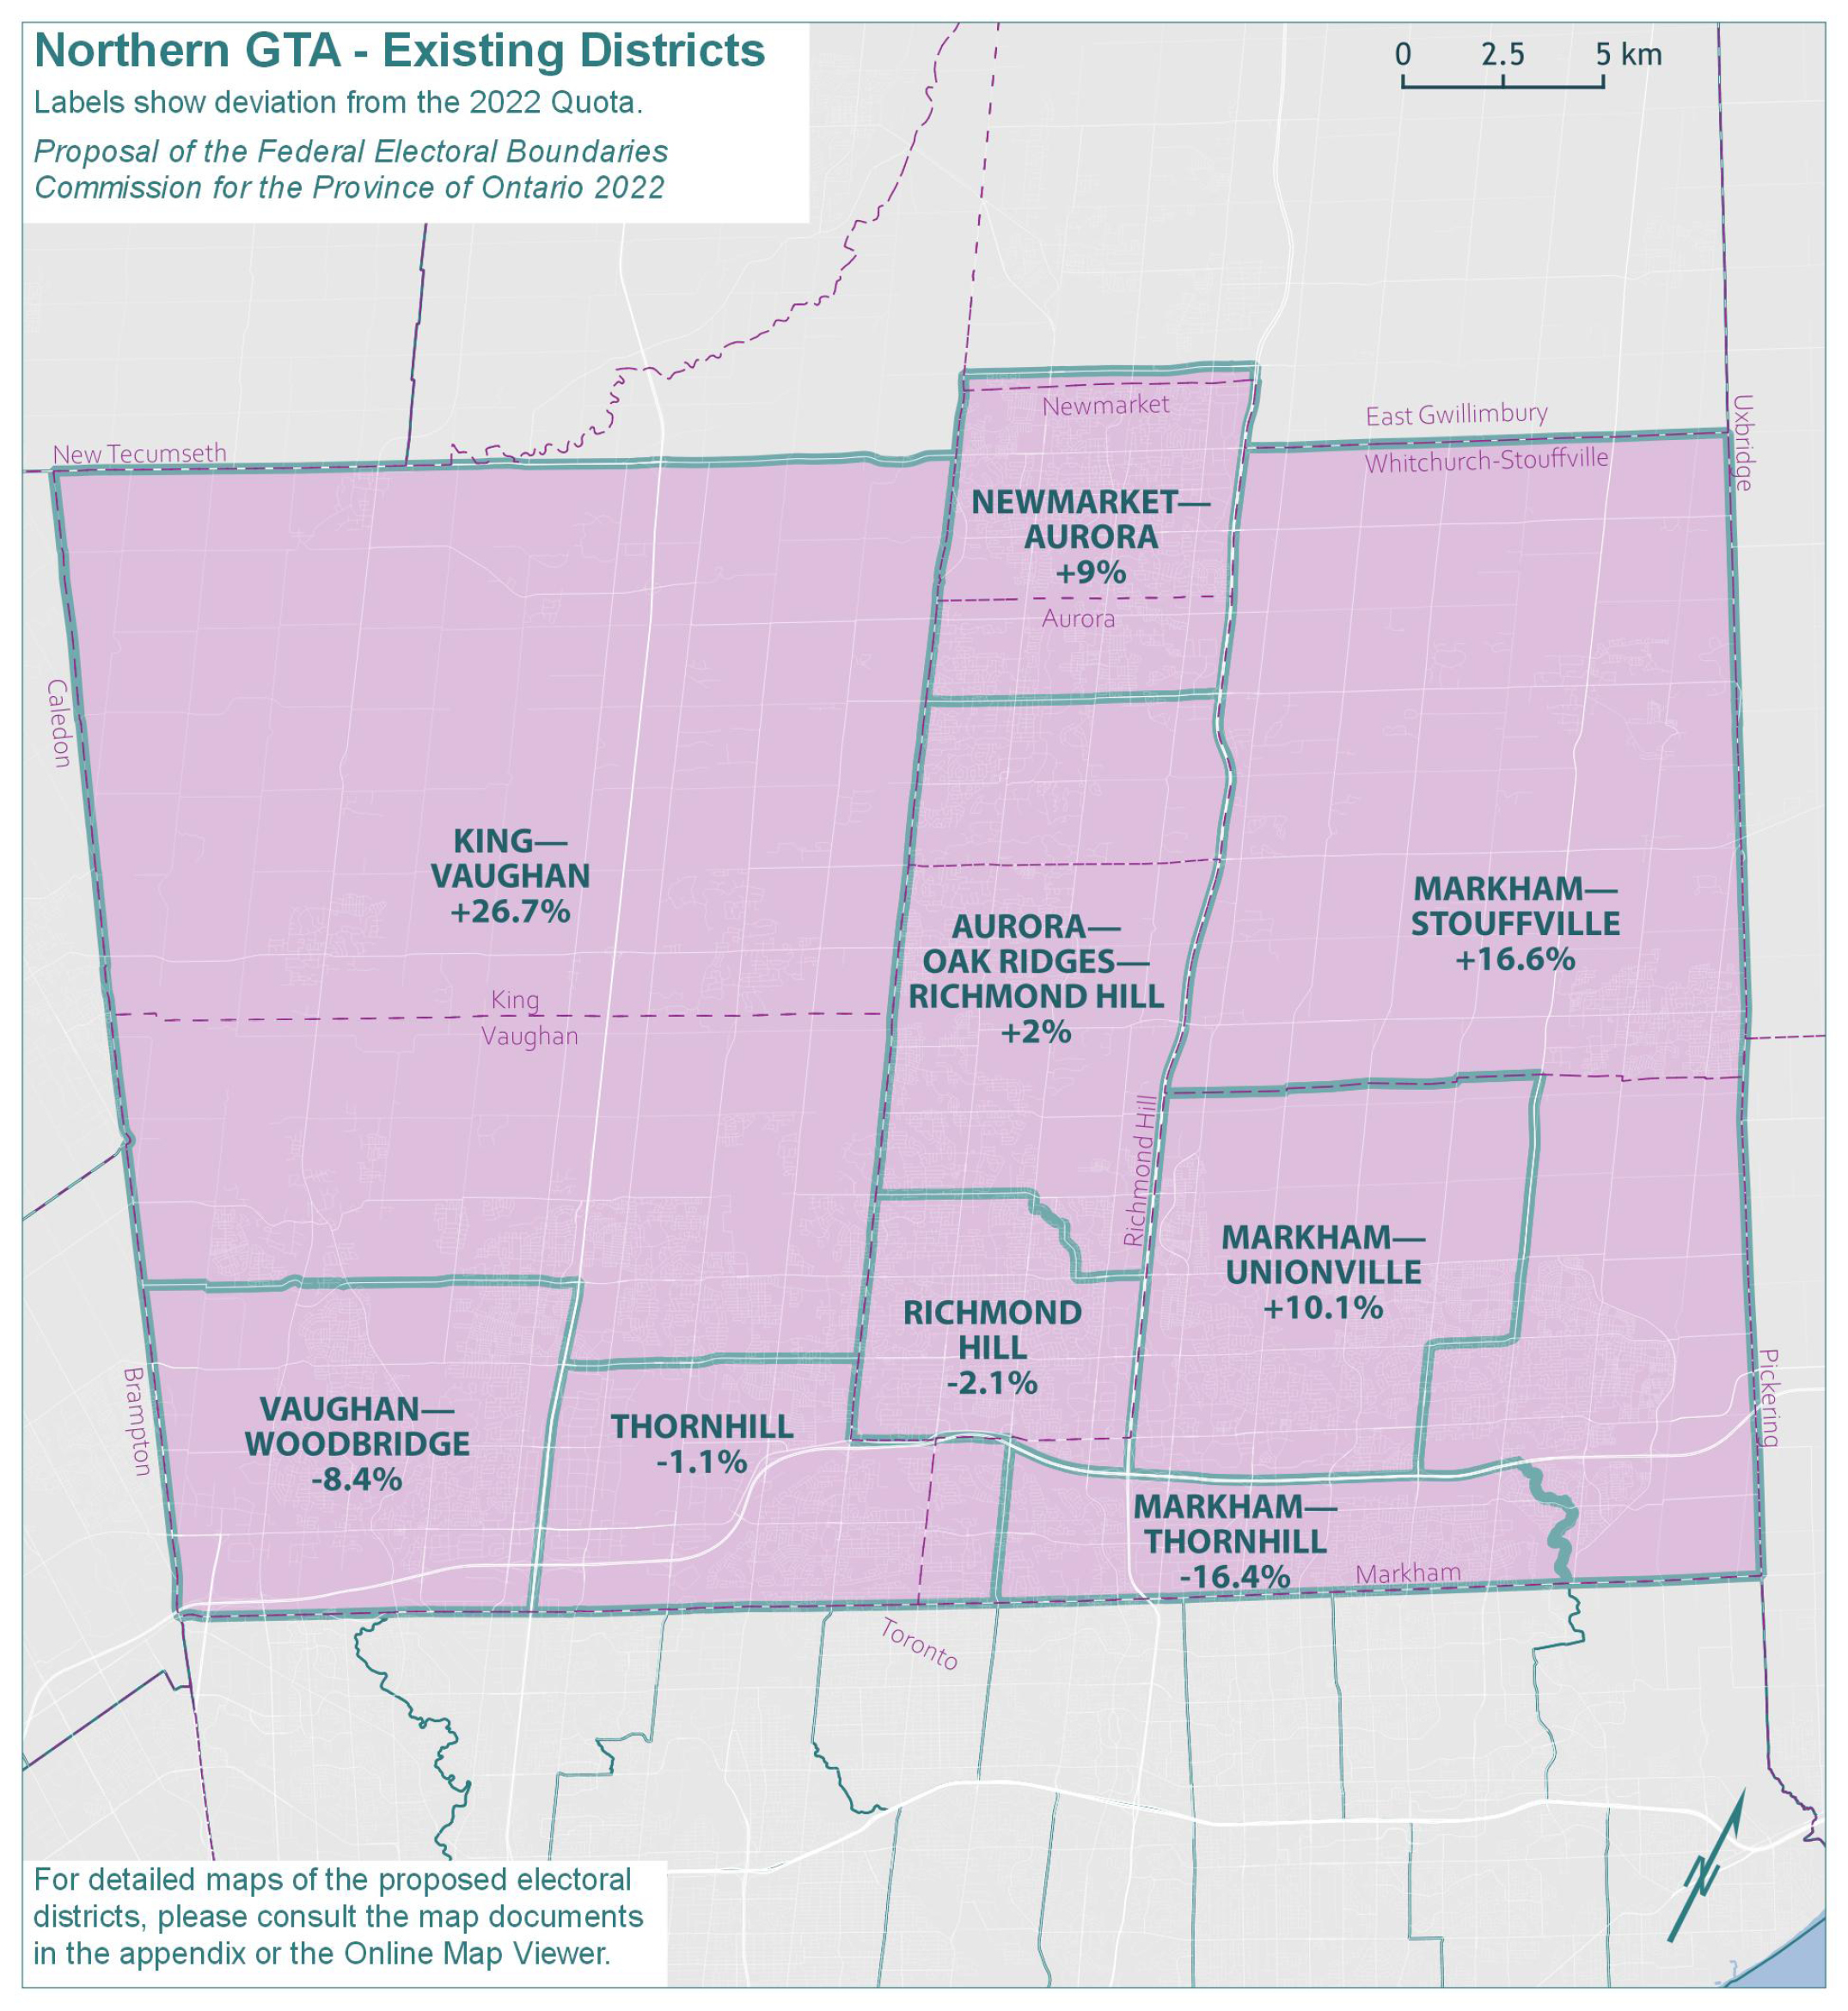
The existing nine electoral districts in Northern GTA would have an average 2021 population of 121,306 and an average deviation of 4% from the Quota. The range between the least and most populous districts would be 43.1 percentage points. As shown in Table 6A below, there are wide population disparities among the electoral districts within this geographic piece.
| Electoral Districts | Population – 2011 | Deviation from Quota – 2012 | Population – 2021 | Deviation from Quota – 2022 |
|---|---|---|---|---|
| Aurora—Oak Ridges—Richmond Hill | 106,064 | -0.14% | 118,883 | 1.97% |
| King—Vaughan | 109,235 | 2.84% | 147,695 | 26.68% |
| Markham—Stouffville | 109,780 | 3.36% | 135,944 | 16.60% |
| Markham—Thornhill | 102,221 | -3.76% | 97,510 | -16.37% |
| Markham—Unionville | 104,693 | -1.43% | 128,308 | 10.05% |
| Newmarket—Aurora | 109,457 | 3.05% | 127,134 | 9.04% |
| Richmond Hill | 108,658 | 2.30% | 114,180 | -2.07% |
| Thornhill | 110,427 | 3.97% | 115,292 | -1.11% |
| Vaughan—Woodbridge | 105,450 | -0.72% | 106,810 | -8.39% |
| Average | 107,332 | 1.05% | 121,306 | 4.04% |
| Range (most populous to least populous) | 8,206 | 7.73 pp | 50,185 | 43.05 pp |
pp = percentage points
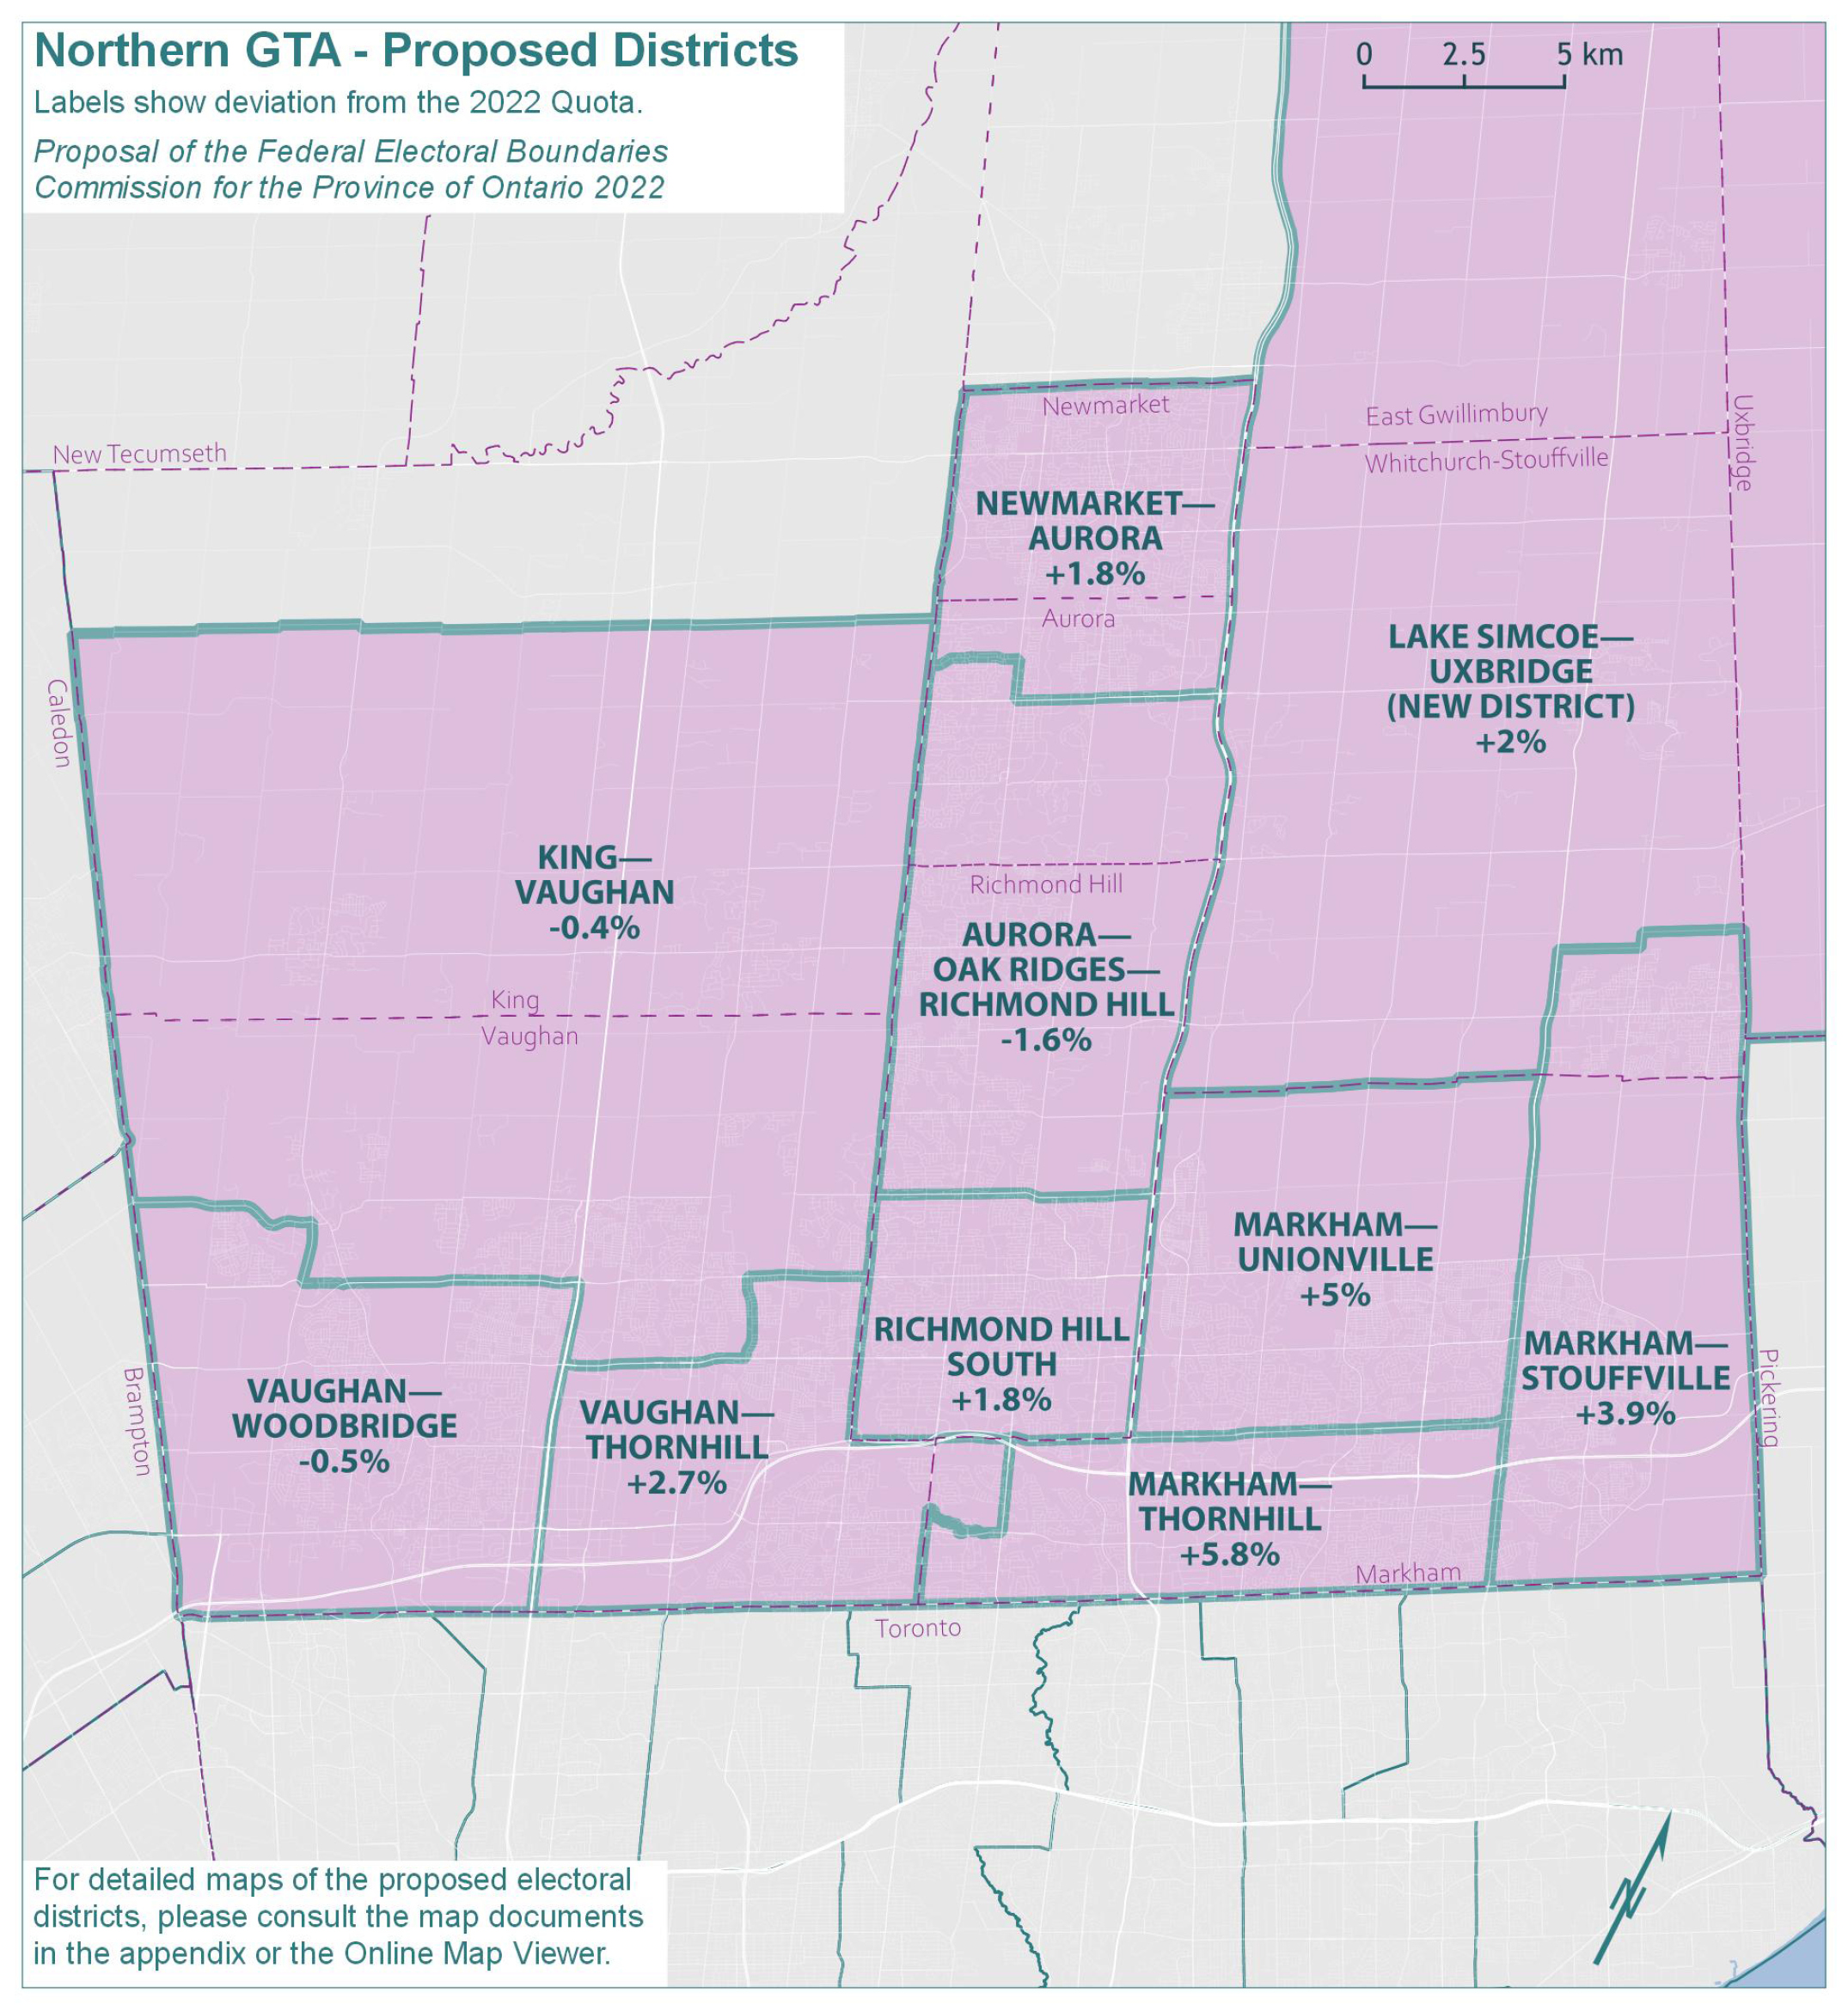
The Commission noted that significant changes are required to ensure voter parity as much as reasonably possible. As shown in the illustrations, the new district of LAKE SIMCOE—UXBRIDGE encompasses all of the northern portion of the current Markham—Stouffville district. In the southeast corner of this geographic piece, the boundaries of the adjacent districts of MARKHAM—STOUFFVILLE, MARKHAM—THORNHILL and MARKHAM—UNIONVILLE are adjusted to bring those districts closer to population parity. Adjustments are also proposed to address the fast-growing population in the existing district of King—Vaughan. The boundary between KING—VAUGHAN and VAUGHAN—WOODBRIDGE is shifted northward to balance the populations of these adjacent ridings.
The new deviations from the Quota in the proposed redistribution plan are shown in Table 6B.
| Electoral Districts | Population – 2021 | Deviation from Quota – 2022 |
|---|---|---|
| Aurora—Oak Ridges—Richmond Hill | 114,676 | -1.64% |
| King—Vaughan | 116,118 | -0.40% |
| Lake Simcoe—Uxbridge (New District) | 118,867 | 1.95% |
| Markham—Stouffville | 121,176 | 3.93% |
| Markham—Thornhill | 123,400 | 5.84% |
| Markham—Unionville | 122,401 | 4.98% |
| Newmarket—Aurora | 118,666 | 1.78% |
| Richmond Hill South | 118,679 | 1.79% |
| Vaughan—Thornhill | 119,771 | 2.73% |
| Vaughan—Woodbridge | 115,957 | -0.54% |
| Average | 118,971 | 2.04% |
| Range (most populous to least populous) | 8,724 | 7.48 pp |
pp = percentage points
Eastern Greater Toronto Area
The population of Eastern GTA grew by 14.6%, from 582,132 in 2011 to 667,211 in 2021. The remainder of Ontario grew by 10.5% in the same period.
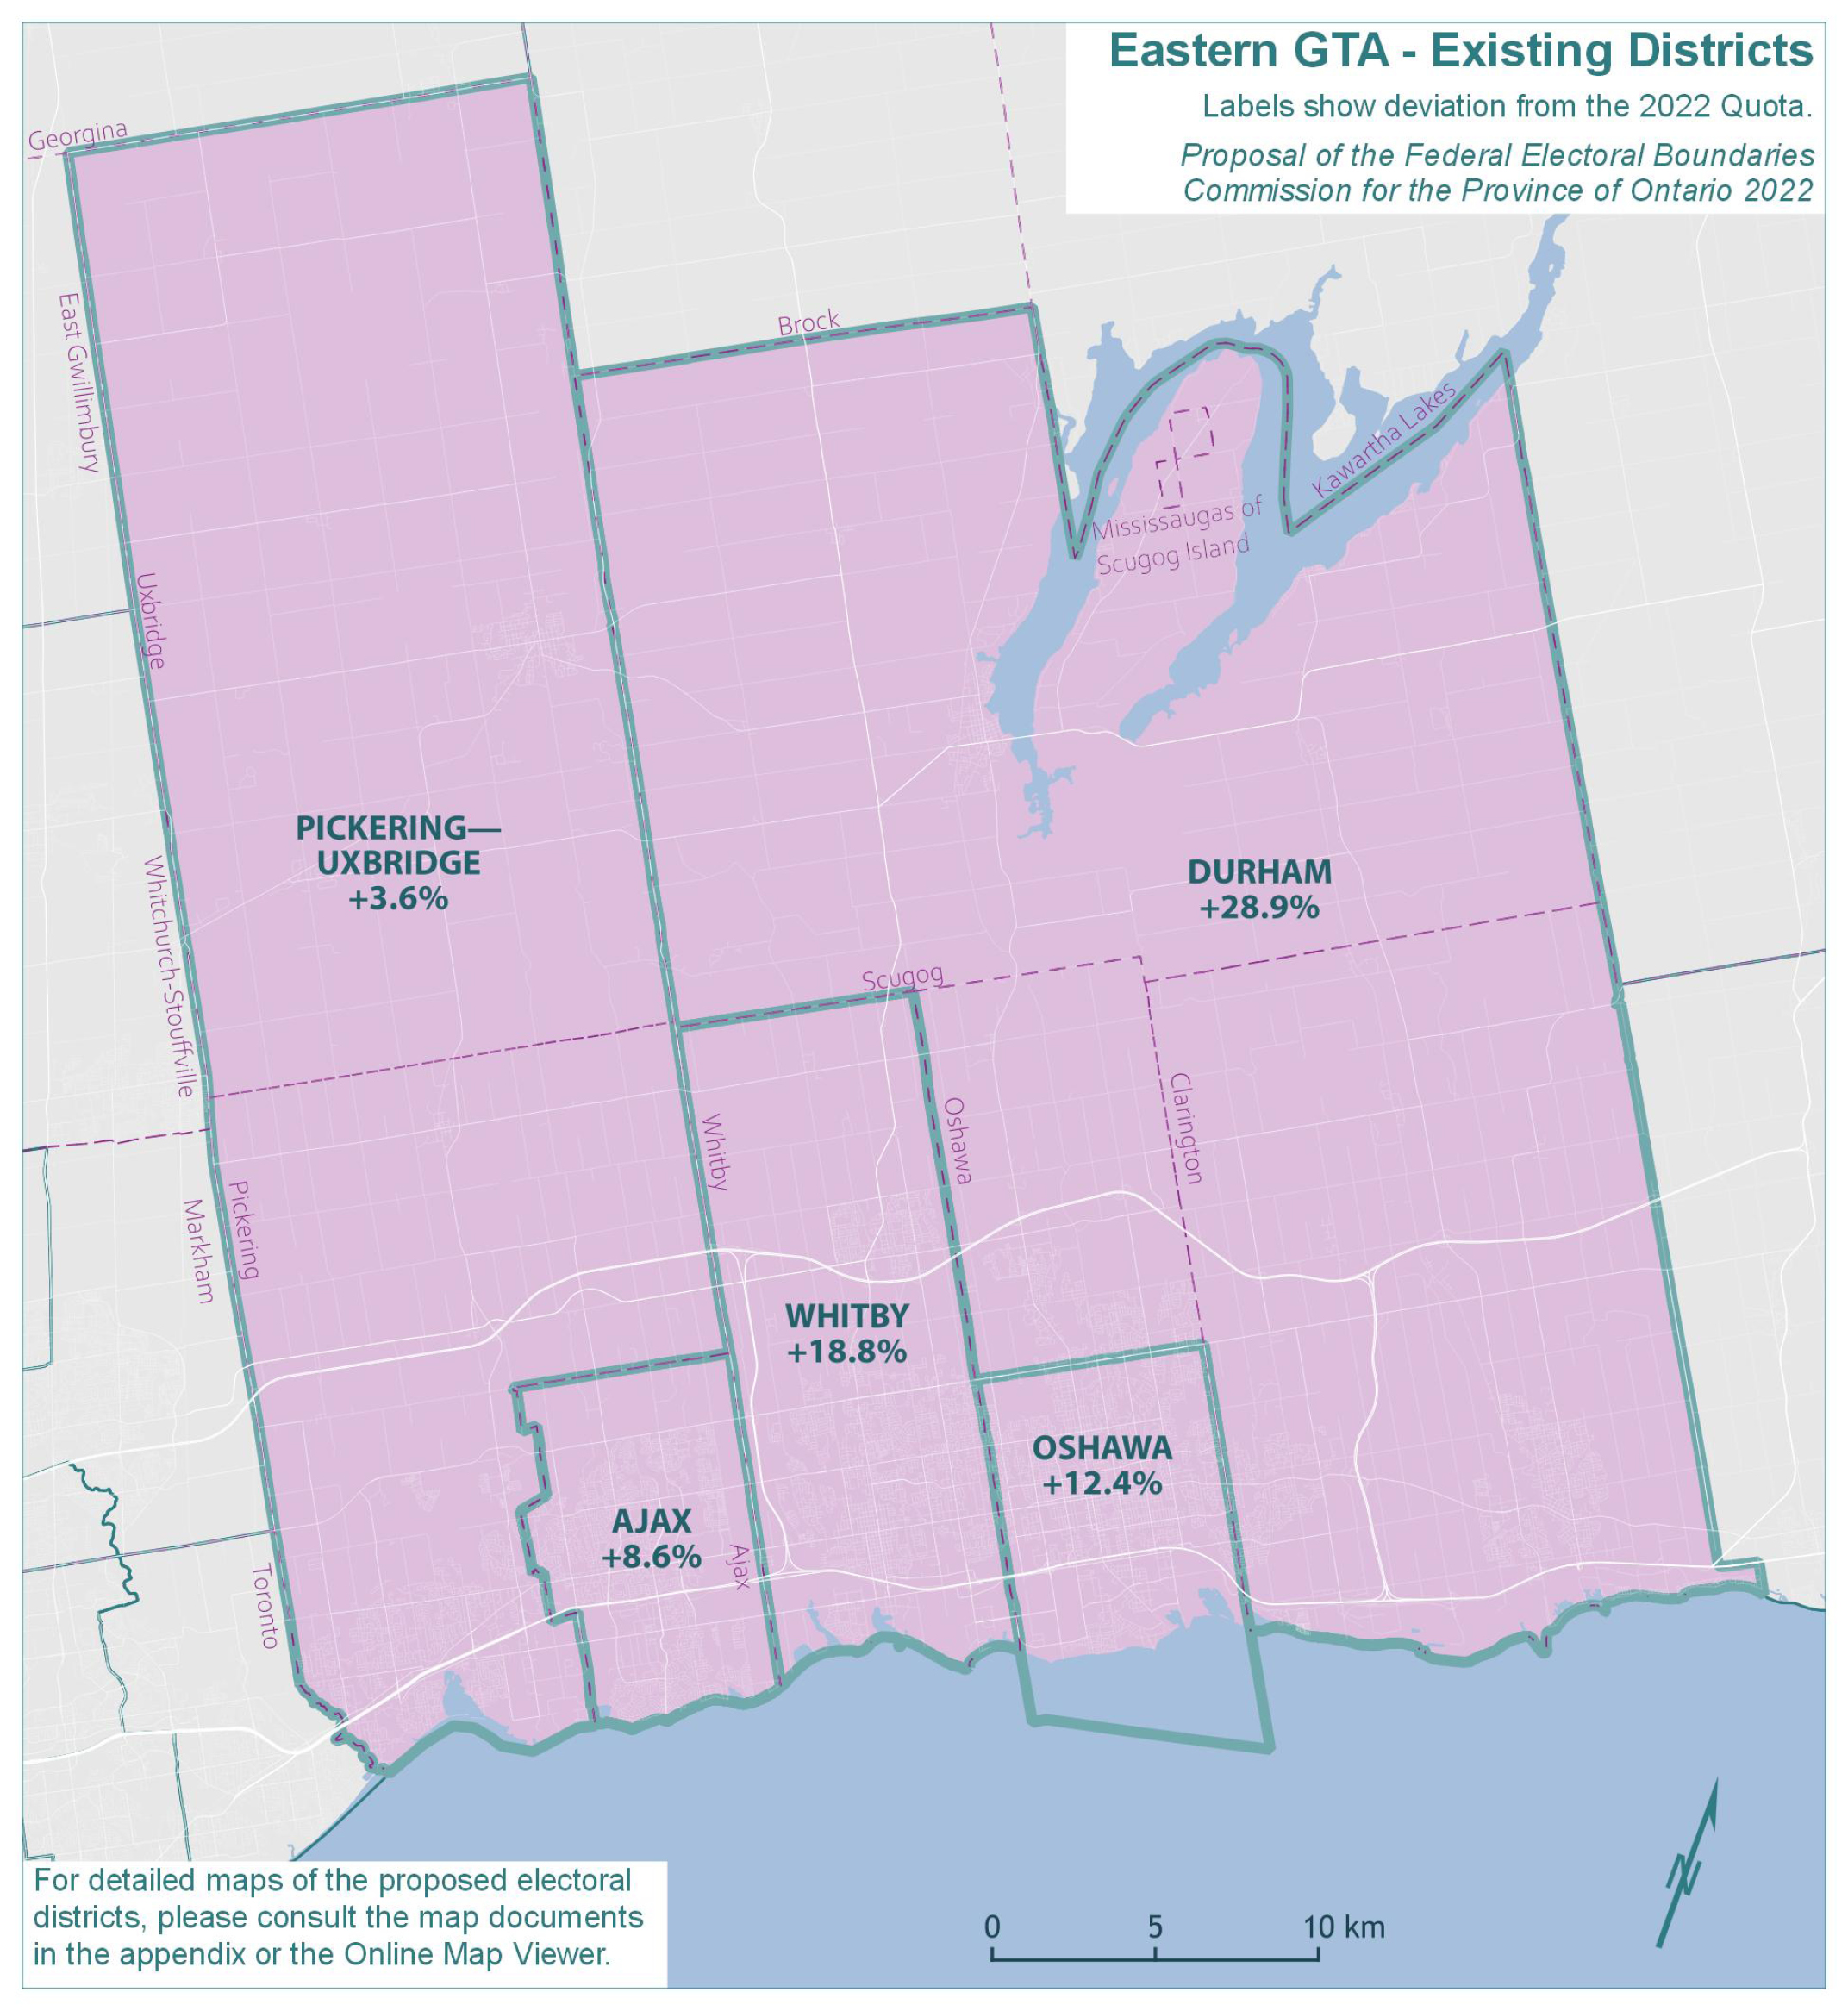
The existing five electoral districts in Eastern GTA would have an average 2021 population of 133,442 and an average deviation of 14.5% from the Quota. The absolute range between the least and most populous districts would be 25.3 percentage points. The populations and deviations from the Quota for the existing electoral districts are shown in Table 7A.
| Electoral Districts | Population – 2011 | Deviation from Quota – 2012 | Population – 2021 | Deviation from Quota – 2022 |
|---|---|---|---|---|
| Ajax | 109,600 | 3.19% | 126,666 | 8.64% |
| Durham | 115,395 | 8.64% | 150,235 | 28.86% |
| Oshawa | 125,771 | 18.41% | 131,067 | 12.42% |
| Pickering—Uxbridge | 109,344 | 2.95% | 120,742 | 3.56% |
| Whitby | 122,022 | 14.88% | 138,501 | 18.79% |
| Average | 116,426 | 9.61% | 133,442 | 14.45% |
| Range (most populous to least populous) | 16,427 | 15.46 pp | 29,493 | 25.30 pp |
pp = percentage points
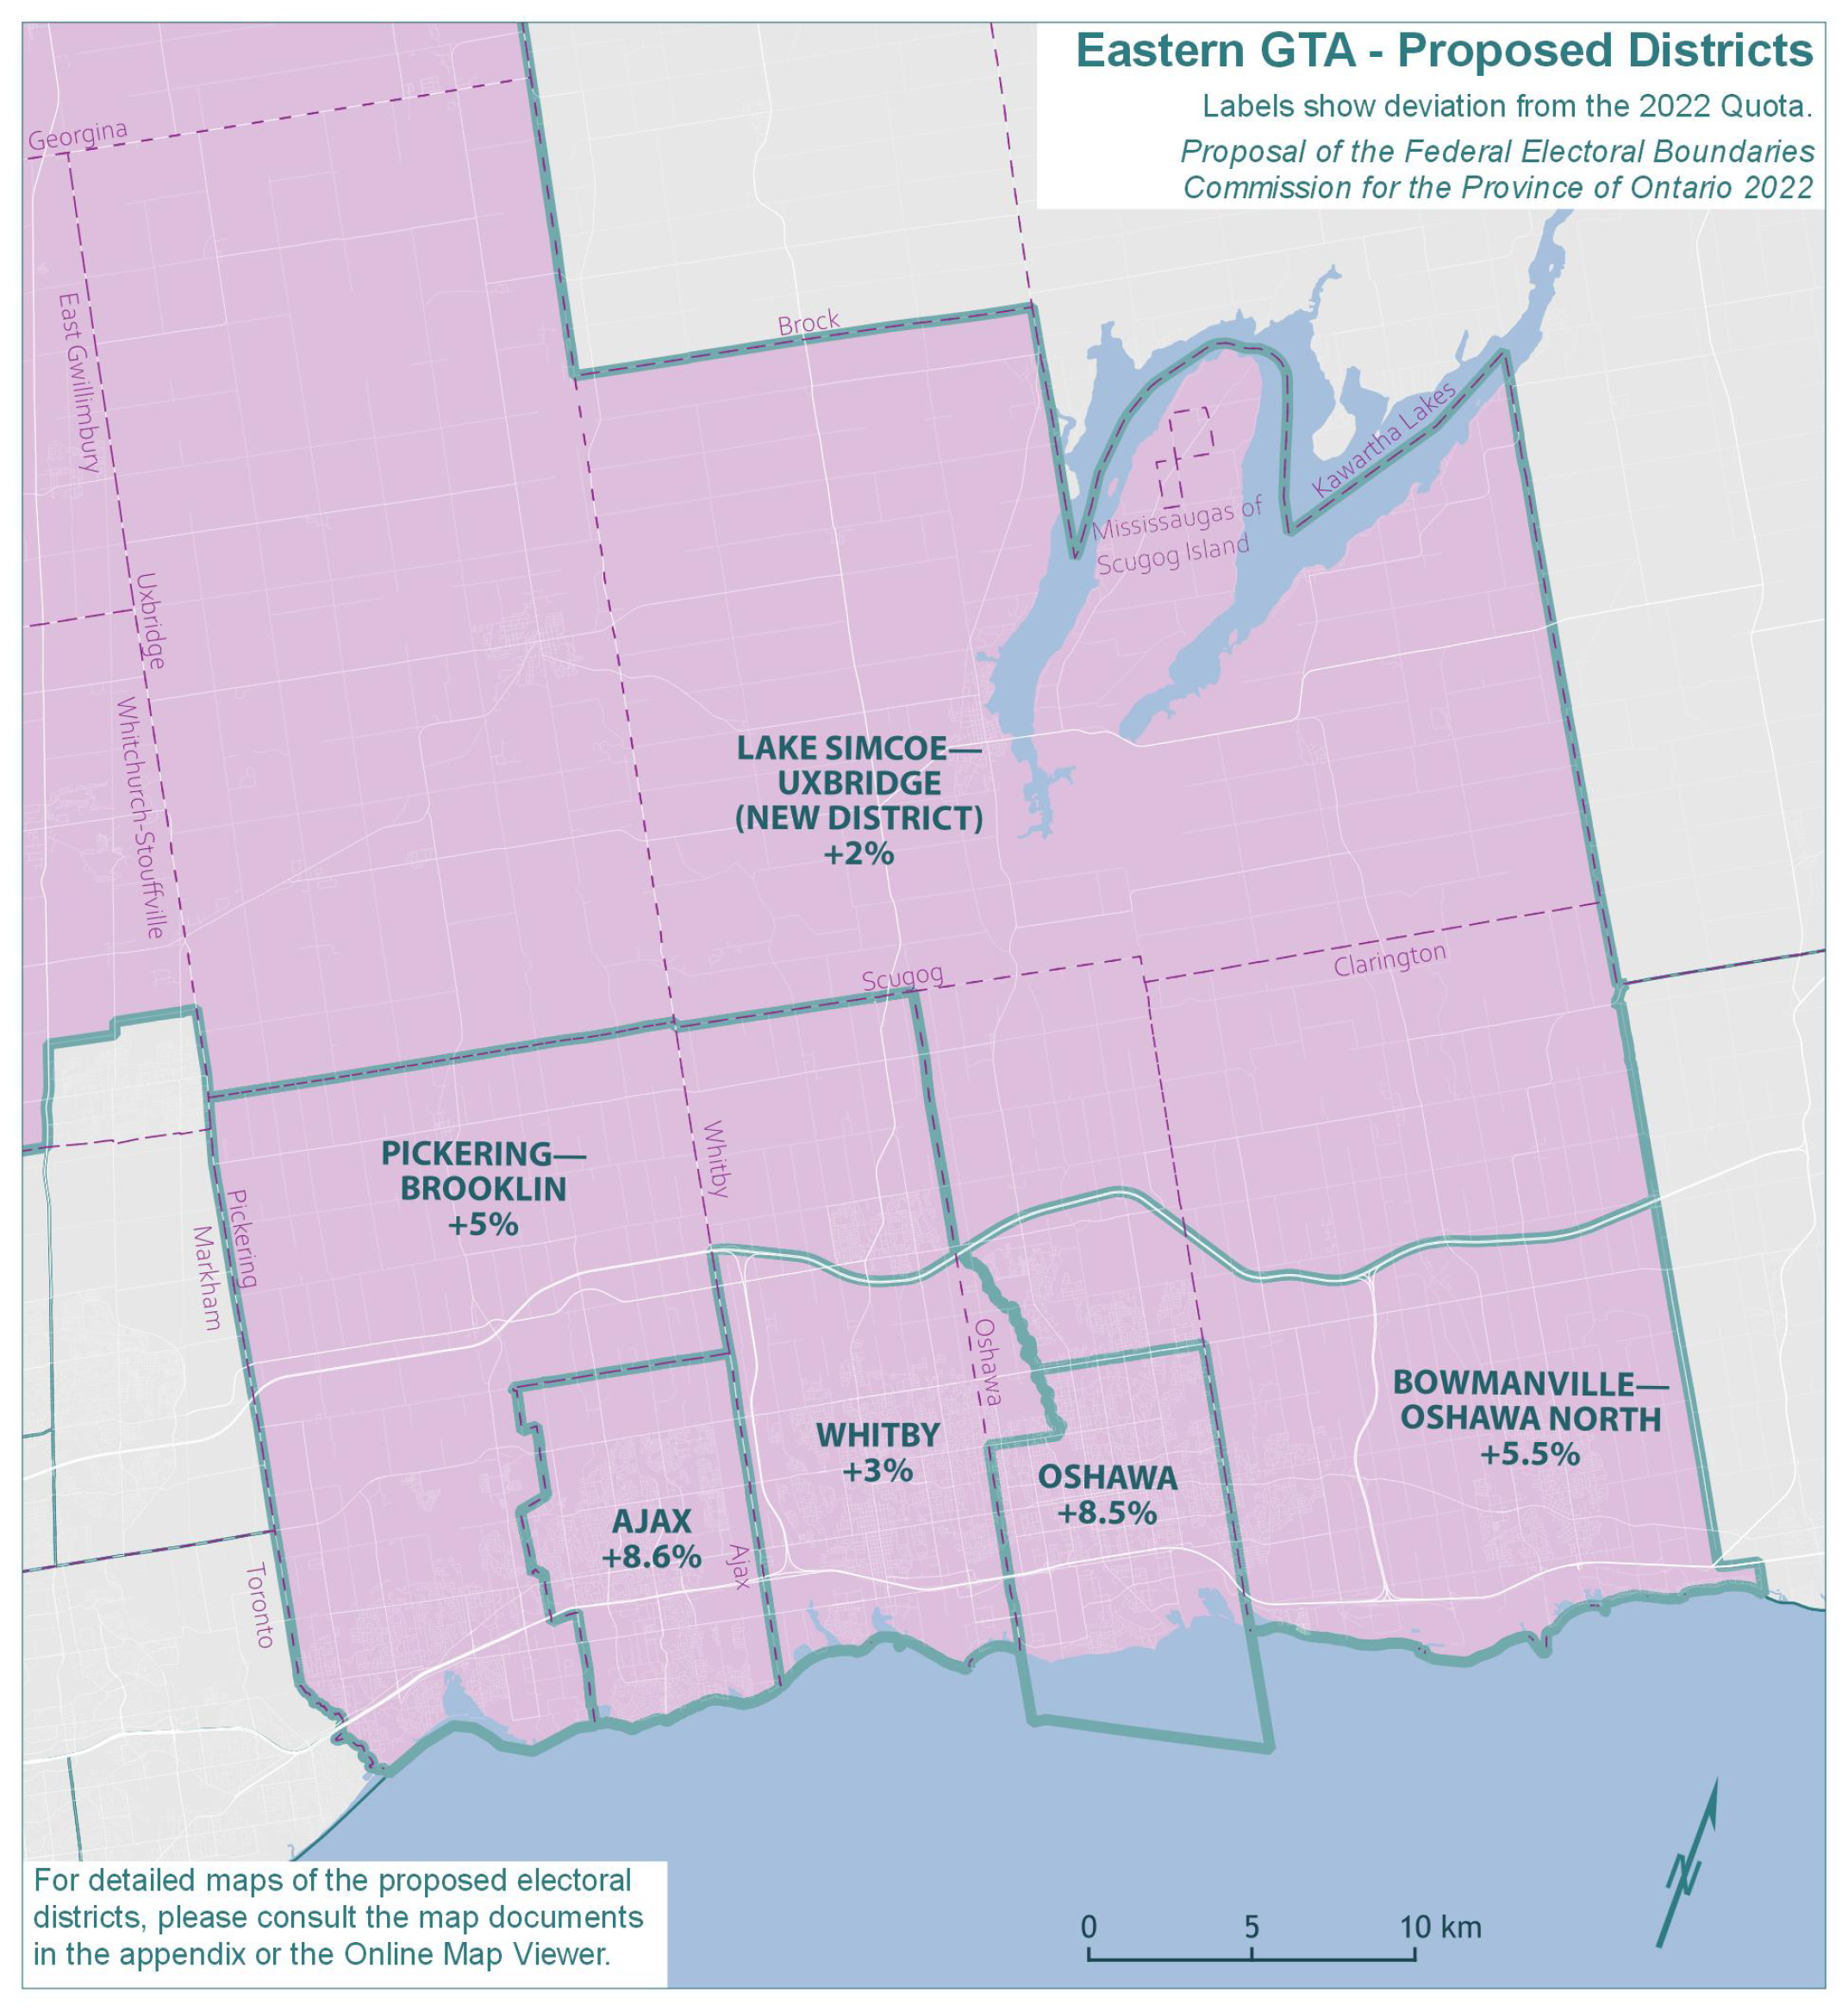
Population growth over the past decade in the Durham Region necessitates a number of significant boundary adjustments in this geographic piece.
The new district of LAKE SIMCOE—UXBRIDGE, as seen in the illustration, incorporates the northern portions of the existing districts of Pickering—Uxbridge and Durham. As a result of this change and of population growth in the City of Whitby (and the community of Brooklin in particular), the Commission proposes to place Brooklin in the district of PICKERING—BROOKLIN. The area constituting the southern portion of the current district of Durham is renamed BOWMANVILLE—OSHAWA NORTH.
The adjusted districts OSHAWA and WHITBY are now more compact in size, with populations much closer to the Quota. The boundaries of AJAX are unchanged.
| Electoral Districts | Population – 2021 | Deviation from Quota – 2022 |
|---|---|---|
| Ajax | 126,666 | 8.64% |
| Bowmanville—Oshawa North | 123,036 | 5.53% |
| Lake Simcoe—Uxbridge (New District) | 118,867 | 1.95% |
| Oshawa | 126,499 | 8.50% |
| Pickering—Brooklin | 122,430 | 5.01% |
| Whitby | 120,078 | 2.99% |
| Average | 122,929 | 5.44% |
| Range (most populous to least populous) | 7,799 | 6.69 pp |
pp = percentage points
Part B – Geographic Pieces in the Balance of the Province, from East to West
Eastern Ontario
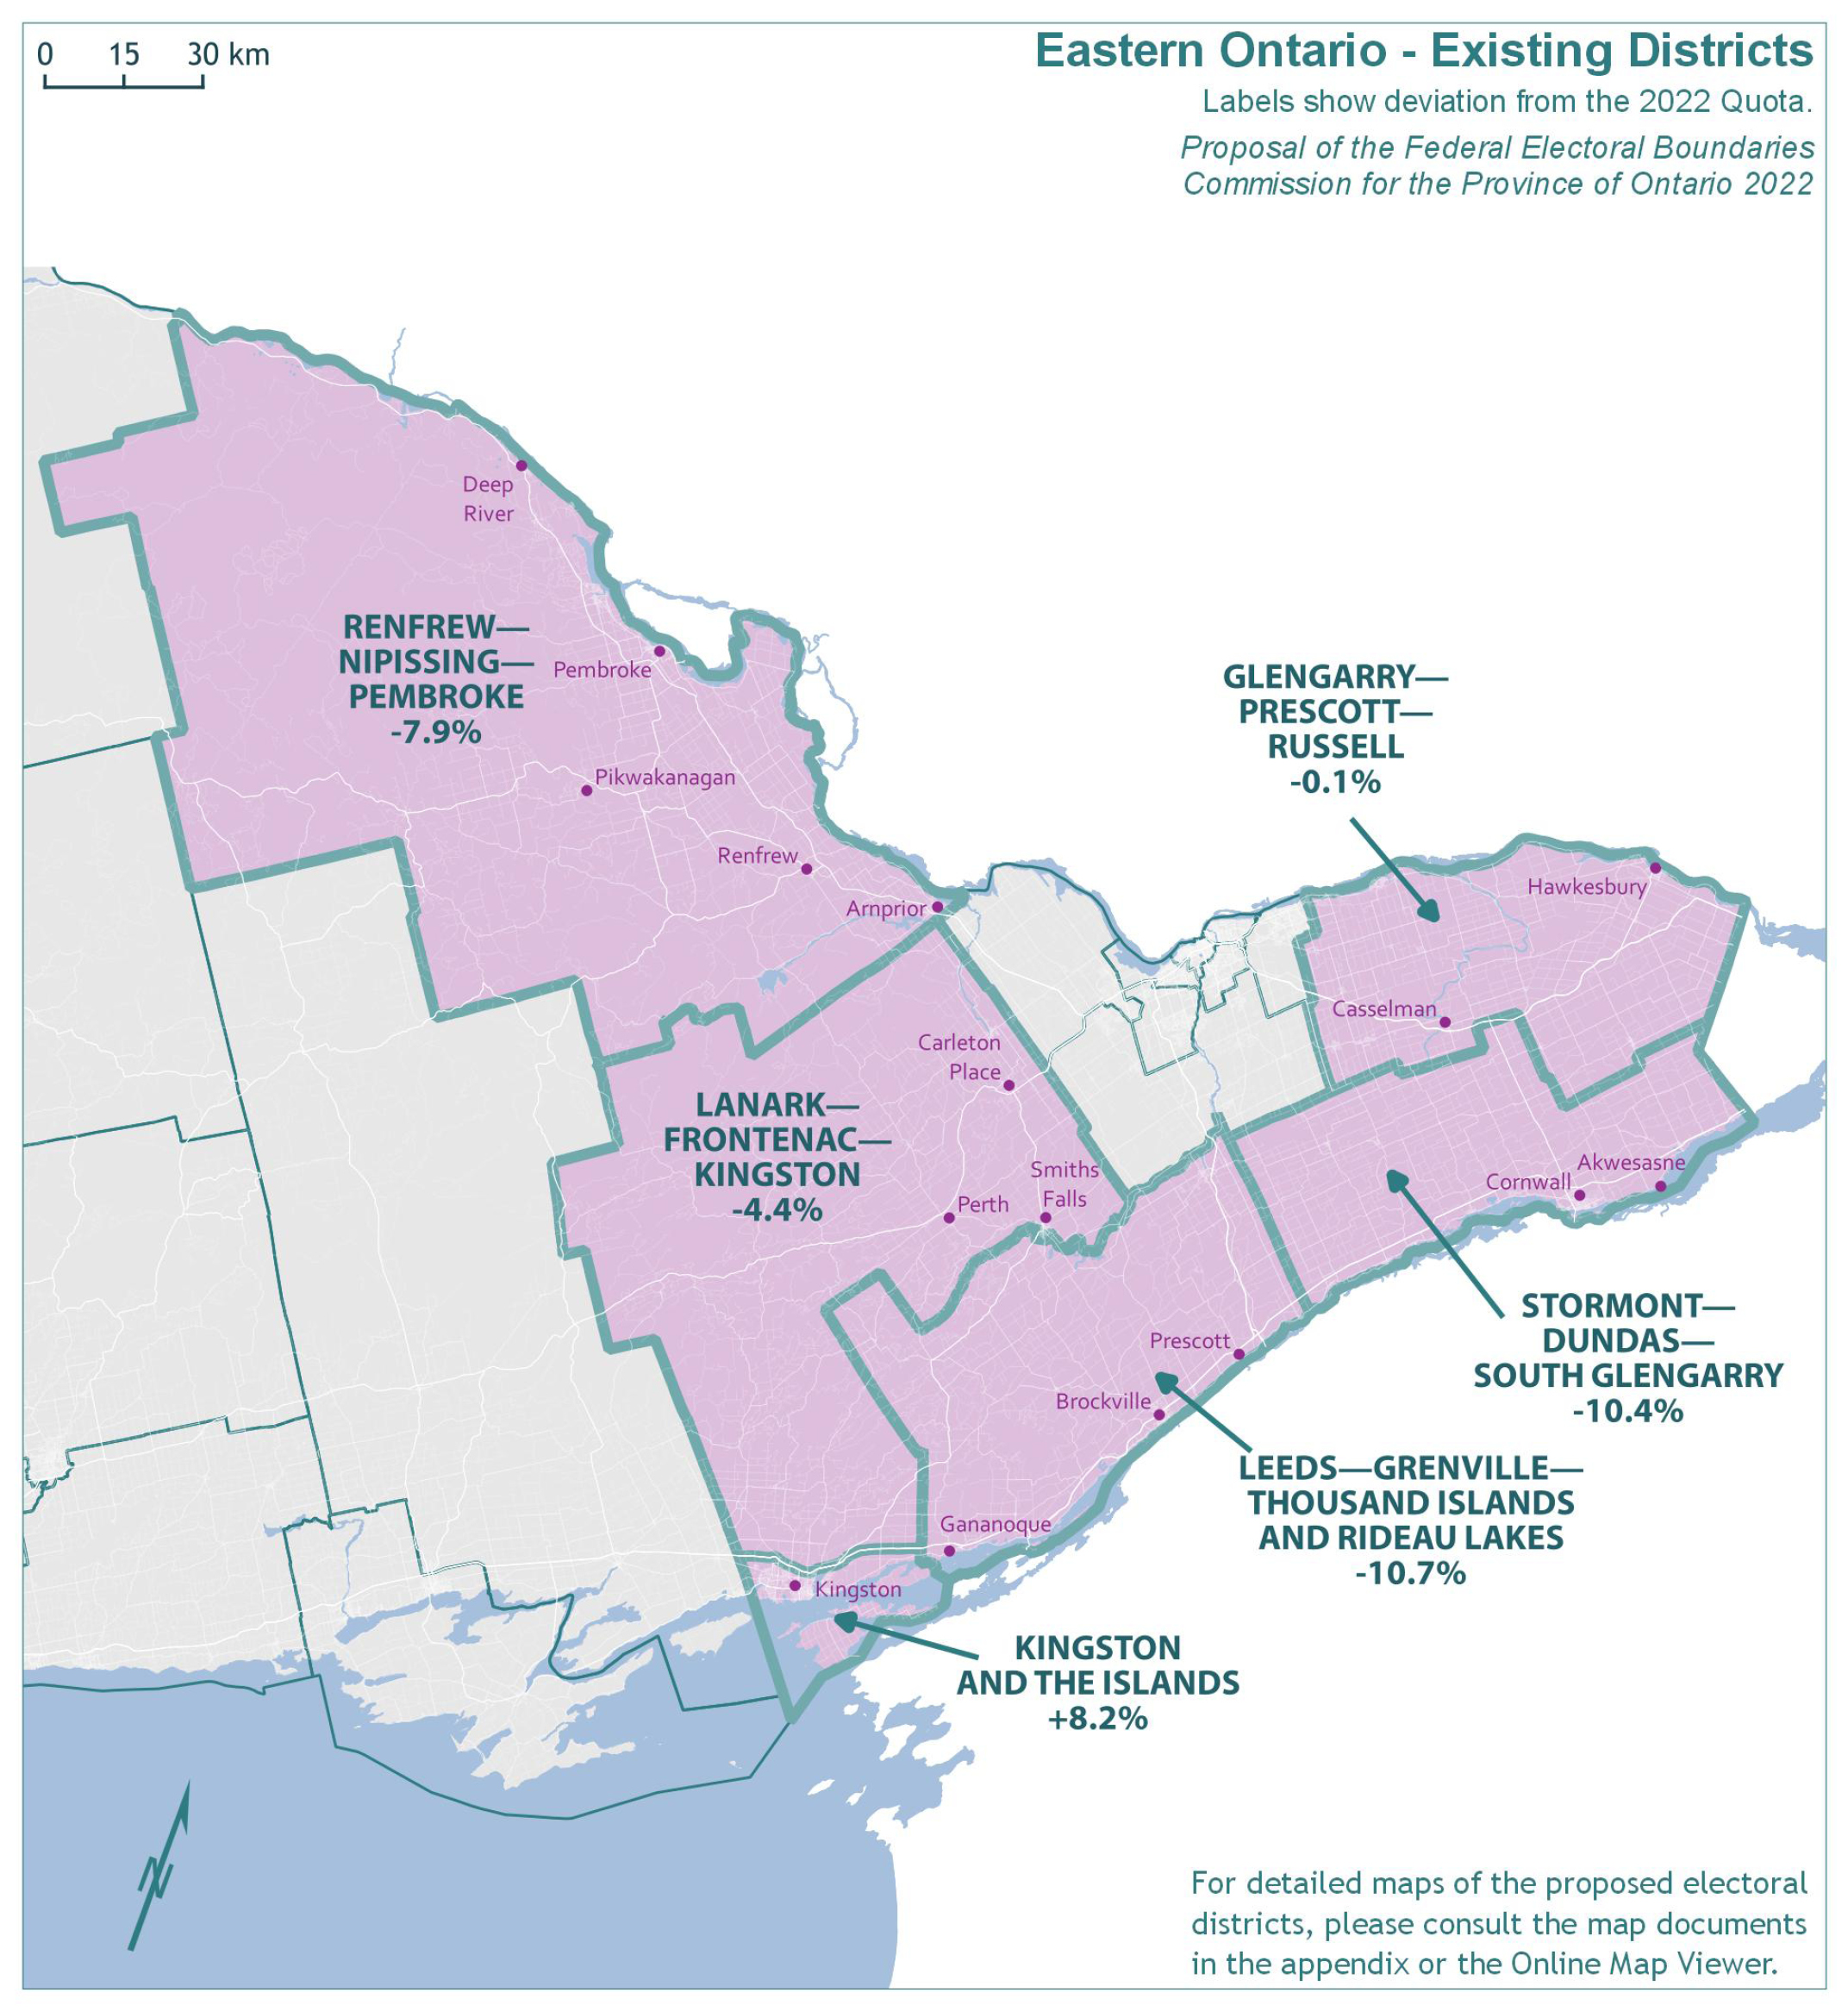
The population of Eastern Ontario grew by 7.3%, from 624,416 in 2011 to 669,976 in 2021. The remainder of Ontario grew by 10.8% in the same period.
The existing six electoral districts in Eastern Ontario would have an average 2021 population of 111,663 and an average deviation of -4.2% from the Quota. The absolute range between the least and most populous districts would be 18.9 percentage points. The populations and deviations from the Quota for the existing electoral districts are shown in Table 8A.
| Electoral Districts | Population – 2011 | Deviation from Quota – 2012 | Population – 2021 | Deviation from Quota – 2022 |
|---|---|---|---|---|
| Glengarry—Prescott—Russell | 106,240 | 0.02% | 116,463 | -0.11% |
| Kingston and the Islands | 116,996 | 10.15% | 126,106 | 8.16% |
| Lanark—Frontenac—Kingston | 98,424 | -7.33% | 111,424 | -4.43% |
| Leeds—Grenville—Thousand Islands and Rideau Lakes | 99,306 | -6.50% | 104,070 | -10.74% |
| Renfrew—Nipissing—Pembroke | 102,537 | -3.46% | 107,420 | -7.87% |
| Stormont—Dundas—South Glengarry | 100,913 | -4.99% | 104,493 | -10.38% |
| Average | 104,069 | -2.02% | 111,663 | -4.23% |
| Range (most populous to least populous) | 18,572 | 17.48 pp | 22,036 | 18.90 pp |
pp = percentage points
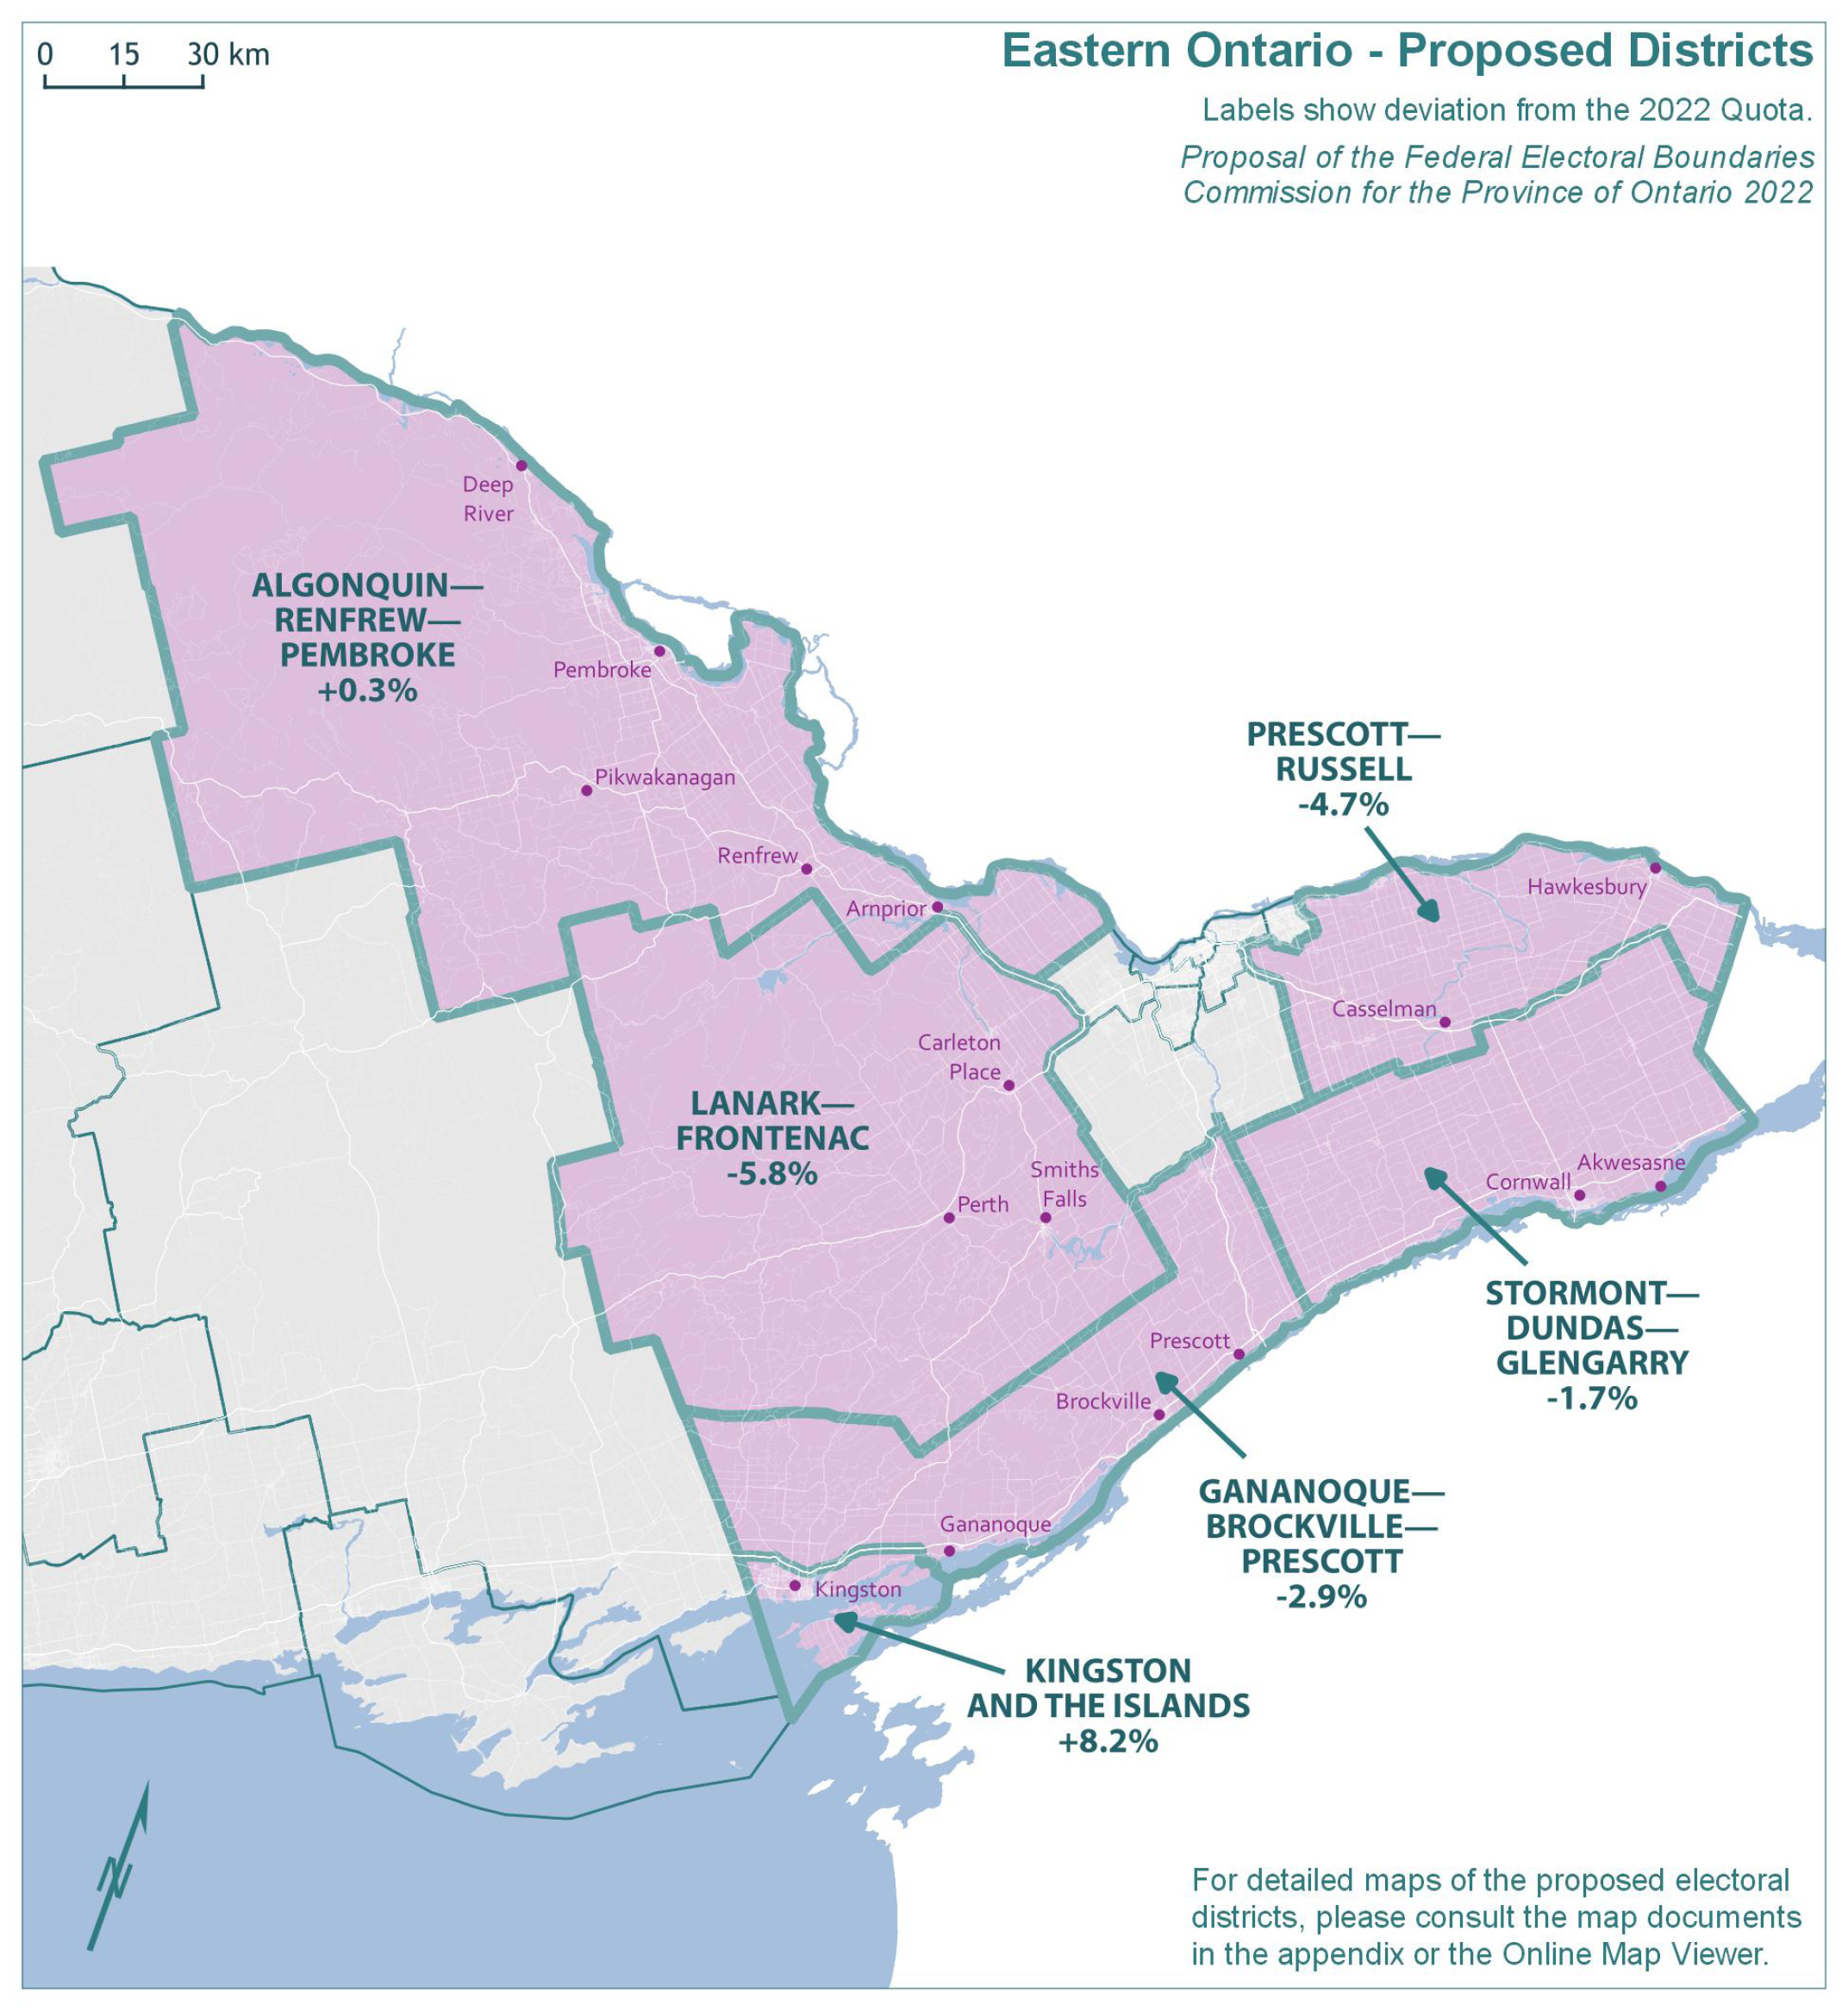
Proposed changes to boundaries in this geographic piece result from the goal of achieving population equality; however, these changes are relatively minor in comparison with those of other parts of the province. The Commission endeavoured to maintain districts of manageable size and respect communities of interest.
The majority representation of the Francophone community in the existing district of Glengarry—Prescott—Russell is maintained in the proposed district of PRESCOTT—RUSSELL.
The new deviations from the Quota in the proposed redistribution plan are shown in Table 8B.
| Electoral Districts | Population – 2021 | Deviation from Quota – 2022 |
|---|---|---|
| Algonquin—Renfrew—Pembroke | 116,900 | 0.27% |
| Gananoque—Brockville—Prescott | 113,266 | -2.85% |
| Kingston and the Islands | 126,106 | 8.16% |
| Lanark—Frontenac | 109,784 | -5.84% |
| Prescott—Russell | 111,163 | -4.65% |
| Stormont—Dundas—Glengarry | 114,637 | -1.68% |
| Average | 115,309 | -1.10% |
| Range (most populous to least populous) | 16,322 | 14.00 pp |
pp = percentage points
Ottawa
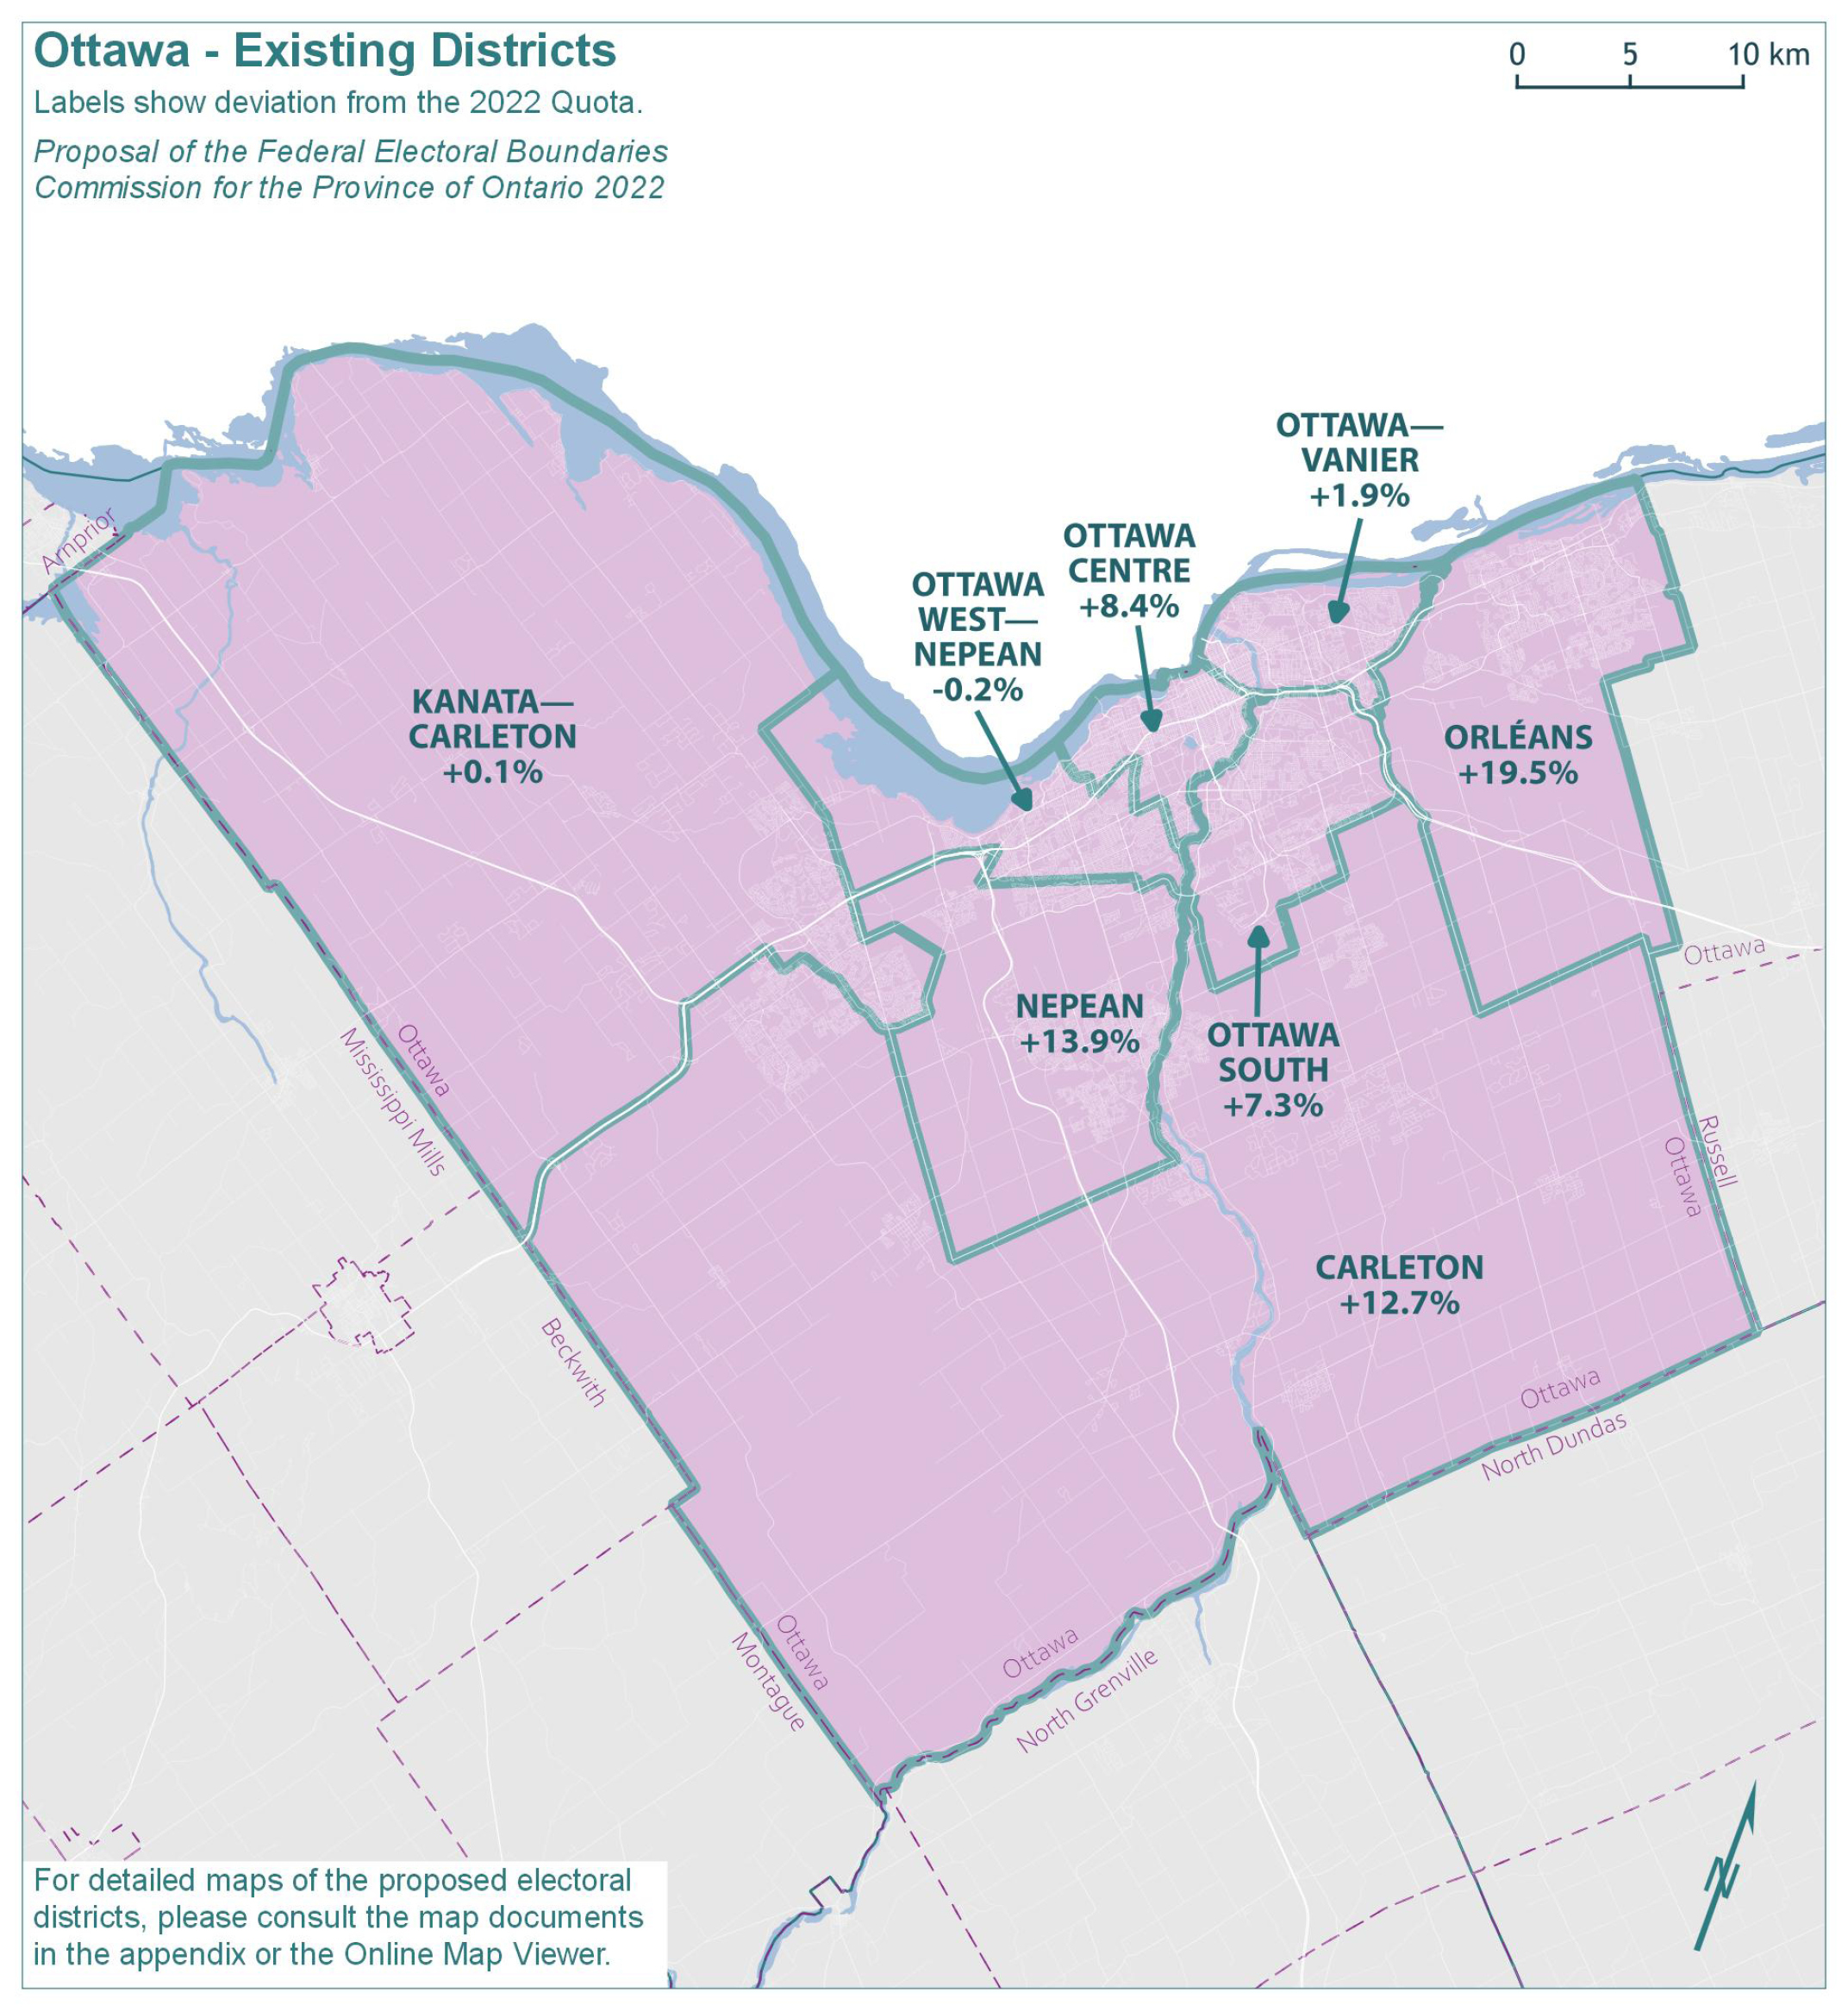
The population of the Ottawa geographic piece grew by 15.4%, from 872,783 in 2011 to 1,006,769 in 2021. The remainder of Ontario grew by 10.3% in the same period.
The existing eight electoral districts in the Ottawa geographic piece would have an average 2021 population of 125,846 and an average deviation of 7.9% from the Quota. The absolute range between the least and most populous districts would be 19.7 percentage points. The populations and deviations from the Quota for the existing electoral districts are shown in Table 9A.
| Electoral Districts | Population – 2011 | Deviation from Quota – 2012 | Population – 2021 | Deviation from Quota – 2022 |
|---|---|---|---|---|
| Carleton | 89,522 | -15.72% | 131,375 | 12.68% |
| Kanata—Carleton | 100,846 | -5.05% | 116,651 | 0.05% |
| Nepean | 104,775 | -1.35% | 132,769 | 13.88% |
| Orléans | 119,247 | 12.27% | 139,309 | 19.49% |
| Ottawa Centre | 113,619 | 6.97% | 126,360 | 8.38% |
| Ottawa South | 121,894 | 14.76% | 125,090 | 7.29% |
| Ottawa—Vanier | 110,999 | 4.51% | 118,806 | 1.90% |
| Ottawa West—Nepean | 111,881 | 5.34% | 116,409 | -0.16% |
| Average | 109,098 | 2.72% | 125,846 | 7.94% |
| Range (most populous to least populous) | 32,372 | 30.48 pp | 22,900 | 19.65 pp |
pp = percentage points
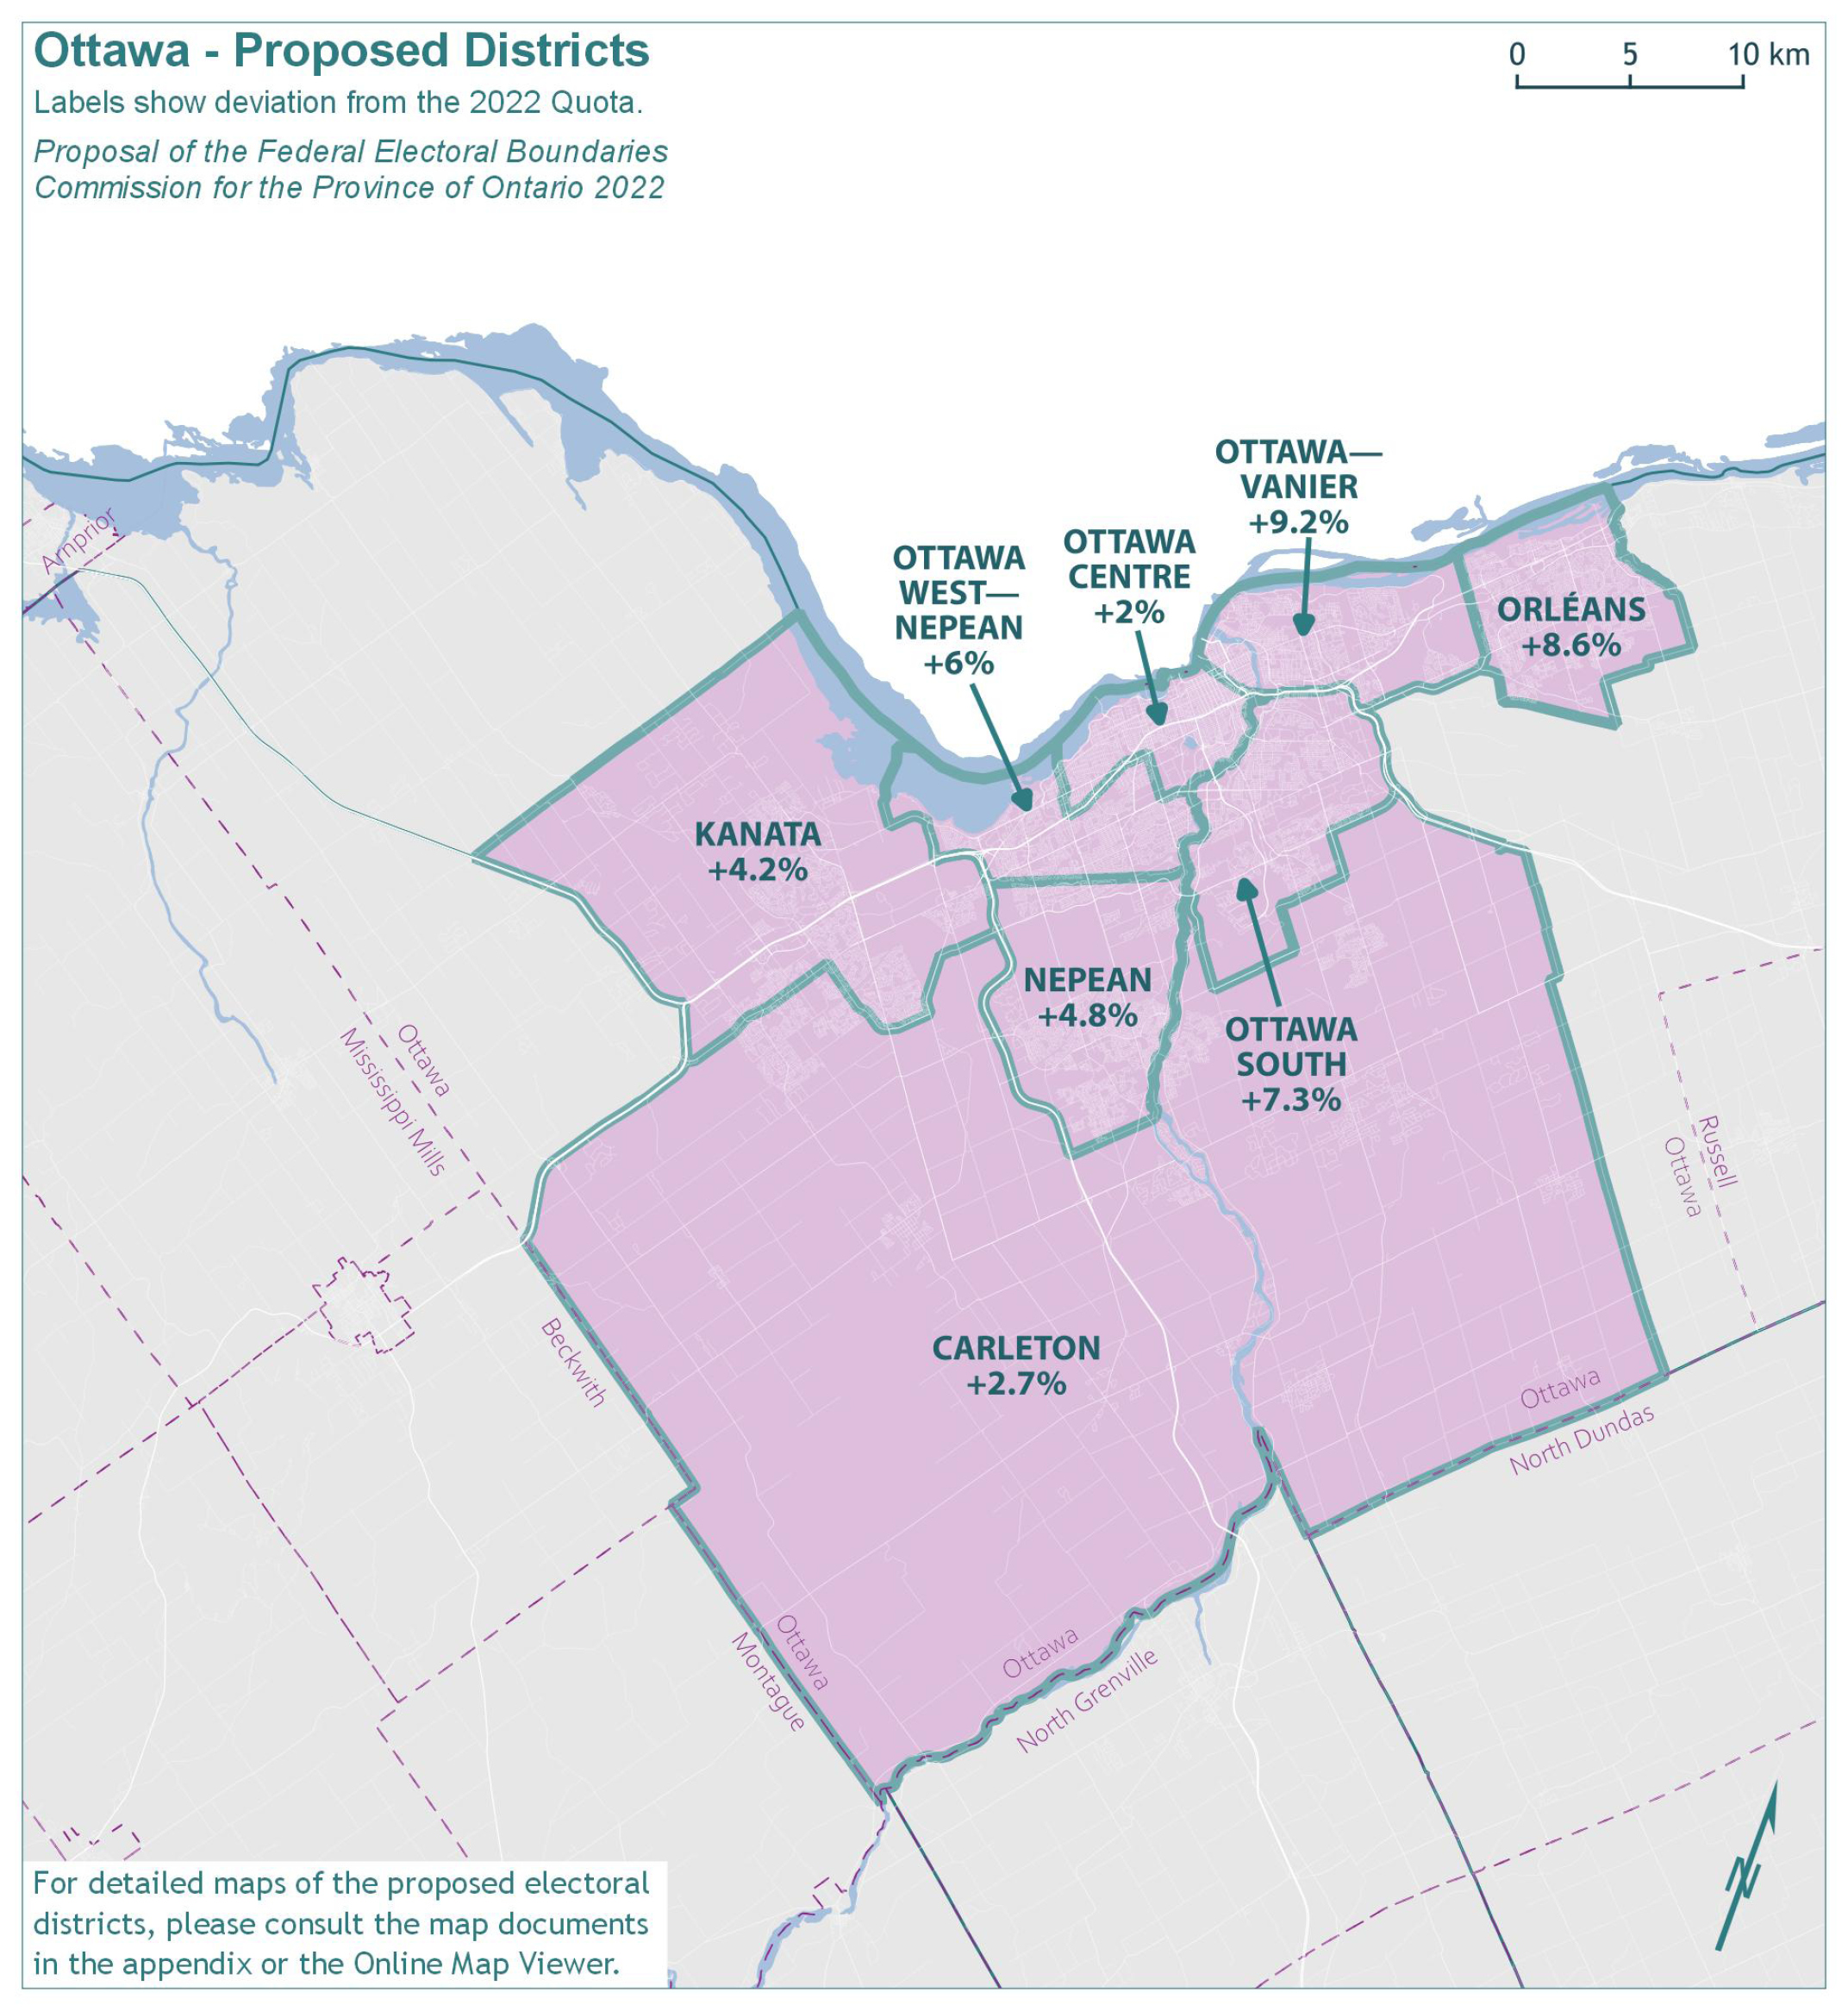
Significant redrawing was required, given the large deviations from the Quota in the suburban area comprised of the existing districts of Carleton, Nepean, and Orléans. The Commission noted that these three districts are underrepresented with populations that are, respectively, 12.7%, 13.9% and 19.5% above the Quota. The proposed boundary changes bring these districts closer to the Quota.
The most notable change concerns ORLÉANS, where an adjustment to the southern boundary, pushing it up towards the Ottawa River, will bring its population much closer to parity with surrounding districts.
Population growth in the existing districts of Nepean and Carleton necessitates further boundary changes that in turn impact the existing district of Kanata—Carleton. The Commission proposes shifting the boundaries of the proposed district of KANATA to the east to address these disparities.
The Commission has endeavoured to respect the interests of the Francophone community by ensuring that their representation in the proposed districts of ORLÉANS, OTTAWA—VANIER and OTTAWA SOUTH are not diluted.
The new deviations from the Quota in the proposed redistribution plan are shown in Table 9B.
| Electoral Districts | Population – 2021 | Deviation from Quota – 2022 |
|---|---|---|
| Carleton | 119,737 | 2.70% |
| Kanata | 121,458 | 4.18% |
| Nepean | 122,229 | 4.84% |
| Orléans | 126,662 | 8.64% |
| Ottawa Centre | 118,950 | 2.02% |
| Ottawa South | 125,075 | 7.28% |
| Ottawa—Vanier | 127,255 | 9.15% |
| Ottawa West—Nepean | 123,533 | 5.96% |
| Average | 123,112 | 5.60% |
| Range (most populous to least populous) | 8,305 | 7.13 pp |
pp = percentage points
Central East Ontario
The population of Central East Ontario grew by 9%, from 535,322 in 2011 to 583,287 in 2021. The remainder of Ontario grew by 10.8% in the same period.
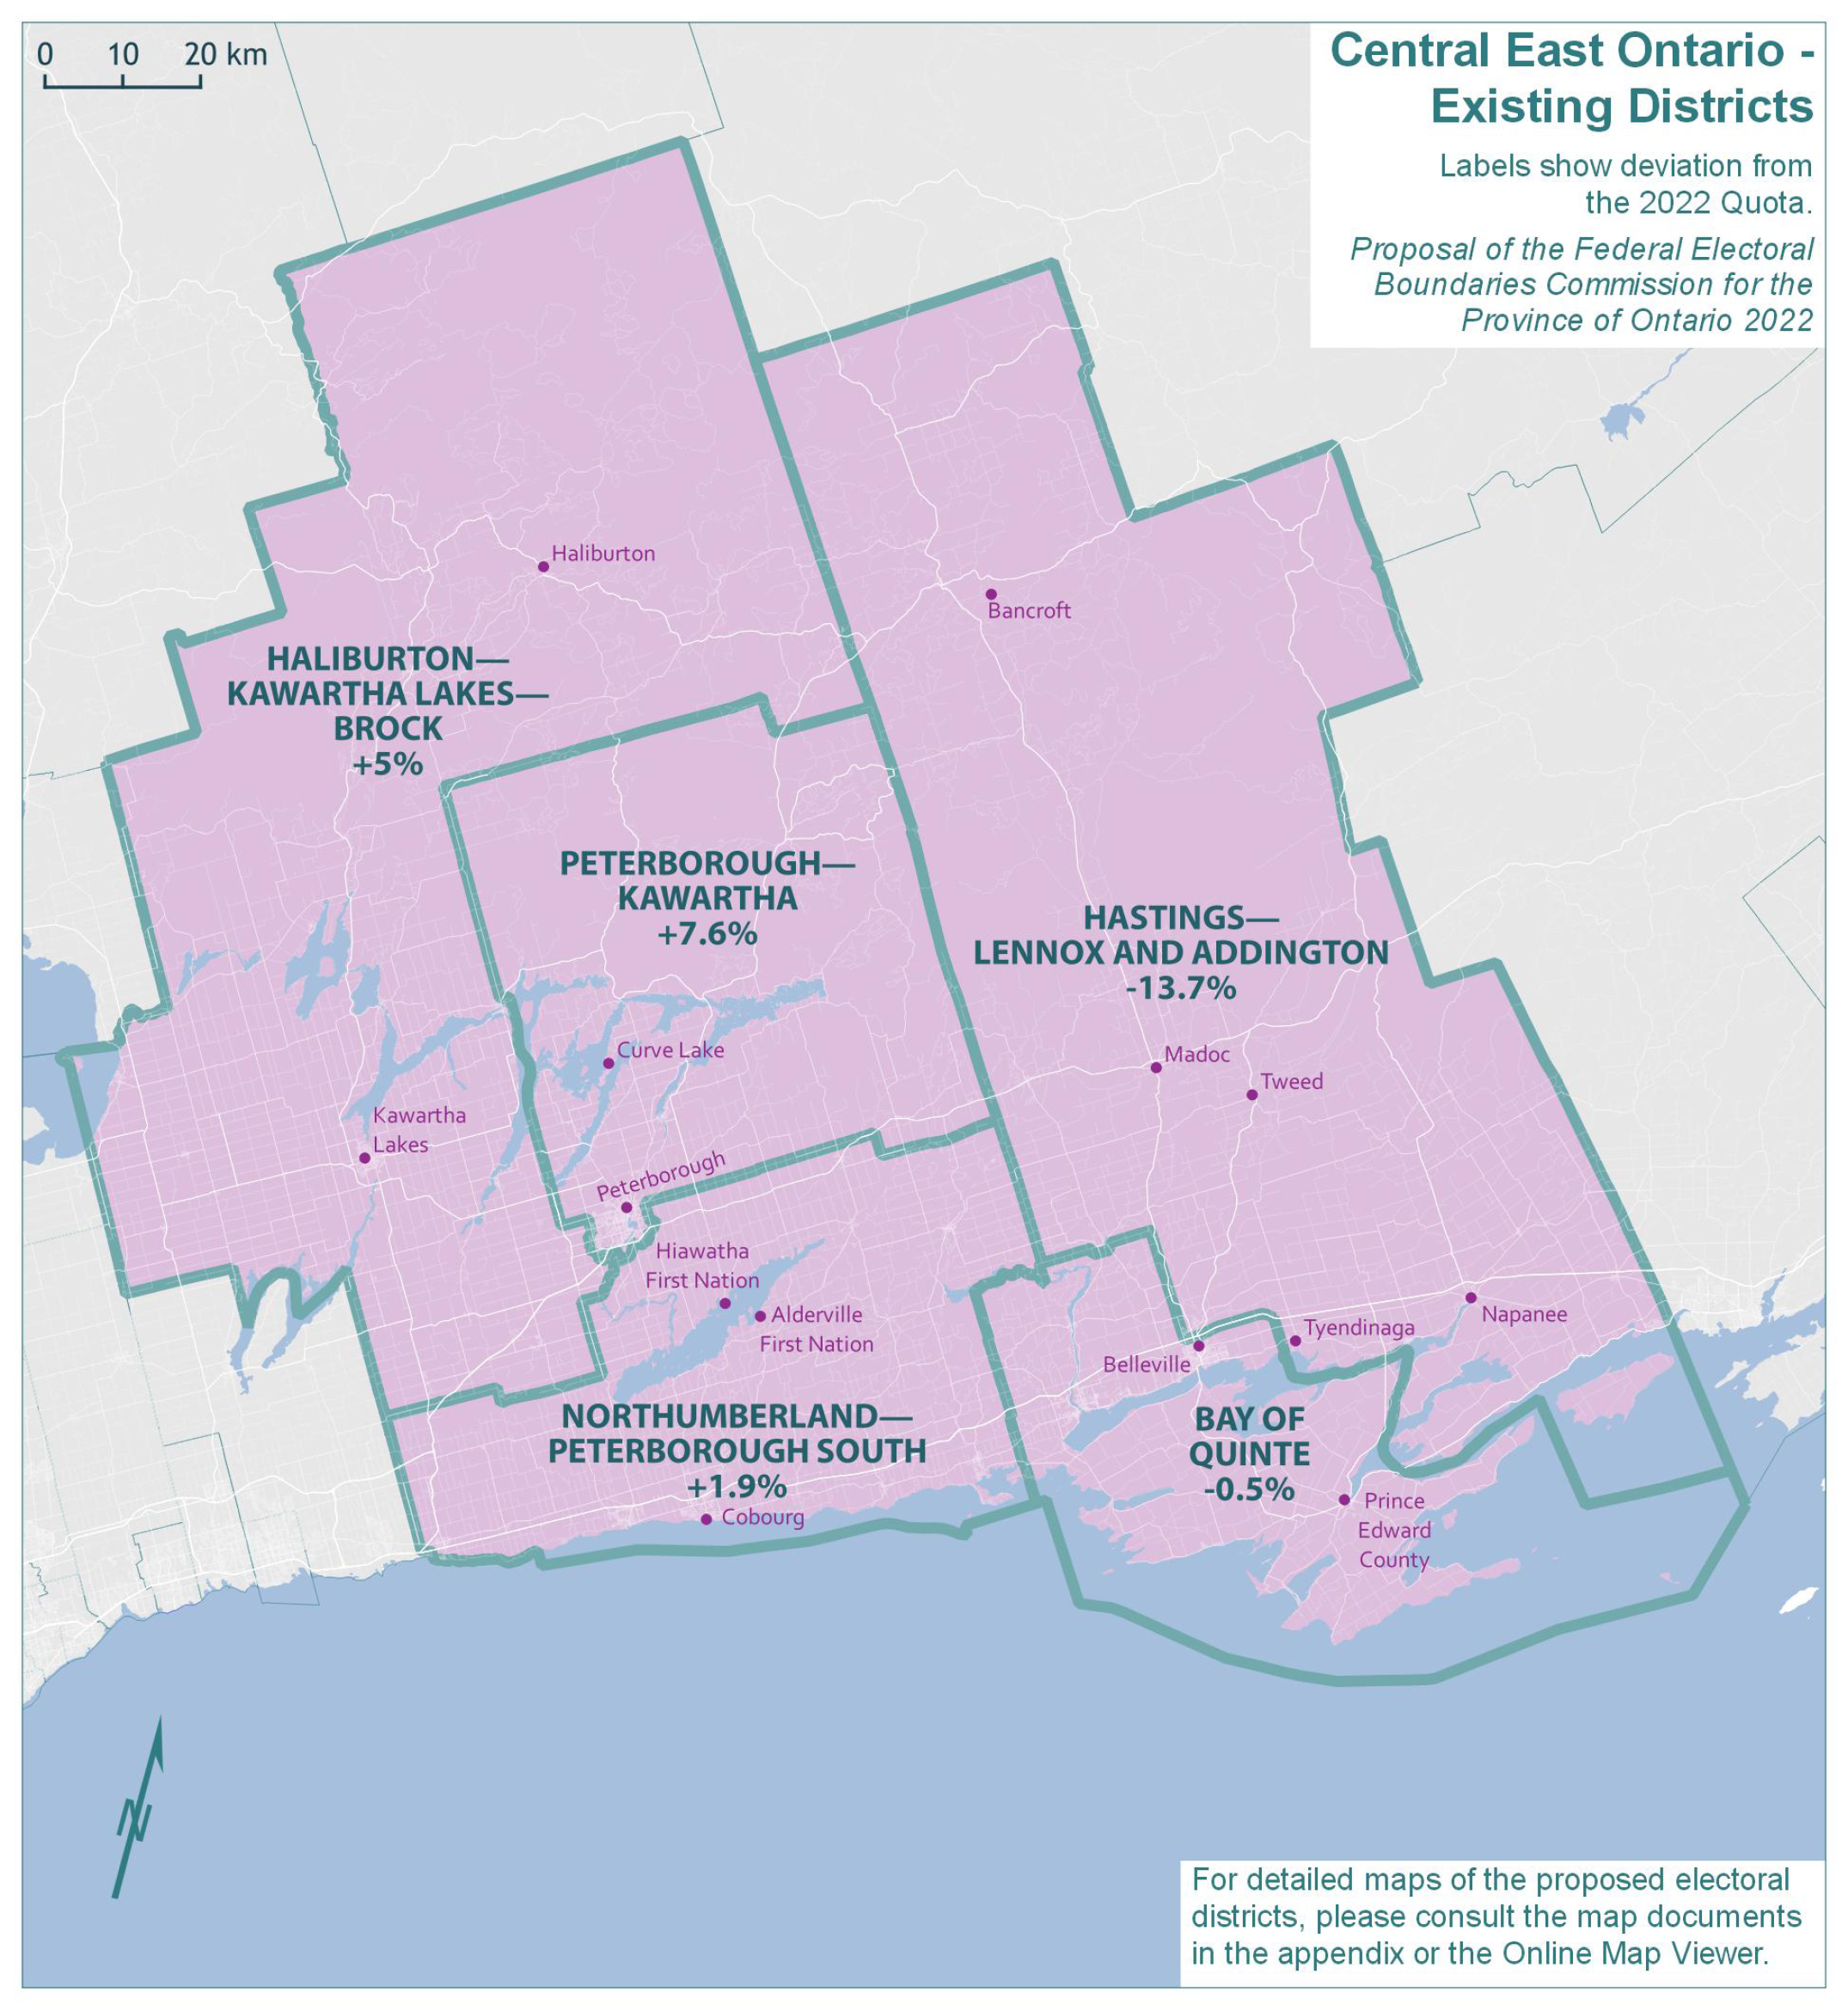
The existing five electoral districts in Central East Ontario would have an average 2021 population of 116,657 and an average deviation of 0.1% from the Quota. The absolute range between the least and most populous districts would be 21.3 percentage points. The populations and deviations from the Quota for the existing electoral districts are shown in Table 10A.
| Electoral Districts | Population – 2011 | Deviation from Quota – 2012 | Population – 2021 | Deviation from Quota – 2022 |
|---|---|---|---|---|
| Bay of Quinte | 109,488 | 3.08% | 116,016 | -0.49% |
| Haliburton—Kawartha Lakes—Brock | 110,217 | 3.77% | 122,401 | 4.98% |
| Hastings—Lennox and Addington | 92,513 | -12.90% | 100,636 | -13.68% |
| Northumberland—Peterborough South | 107,840 | 1.53% | 118,756 | 1.86% |
| Peterborough—Kawartha | 115,264 | 8.52% | 125,478 | 7.62% |
| Average | 107,064 | 0.80% | 116,657 | 0.06% |
| Range (most populous to least populous) | 22,751 | 21.42 pp | 24,842 | 21.30 pp |
pp = percentage points
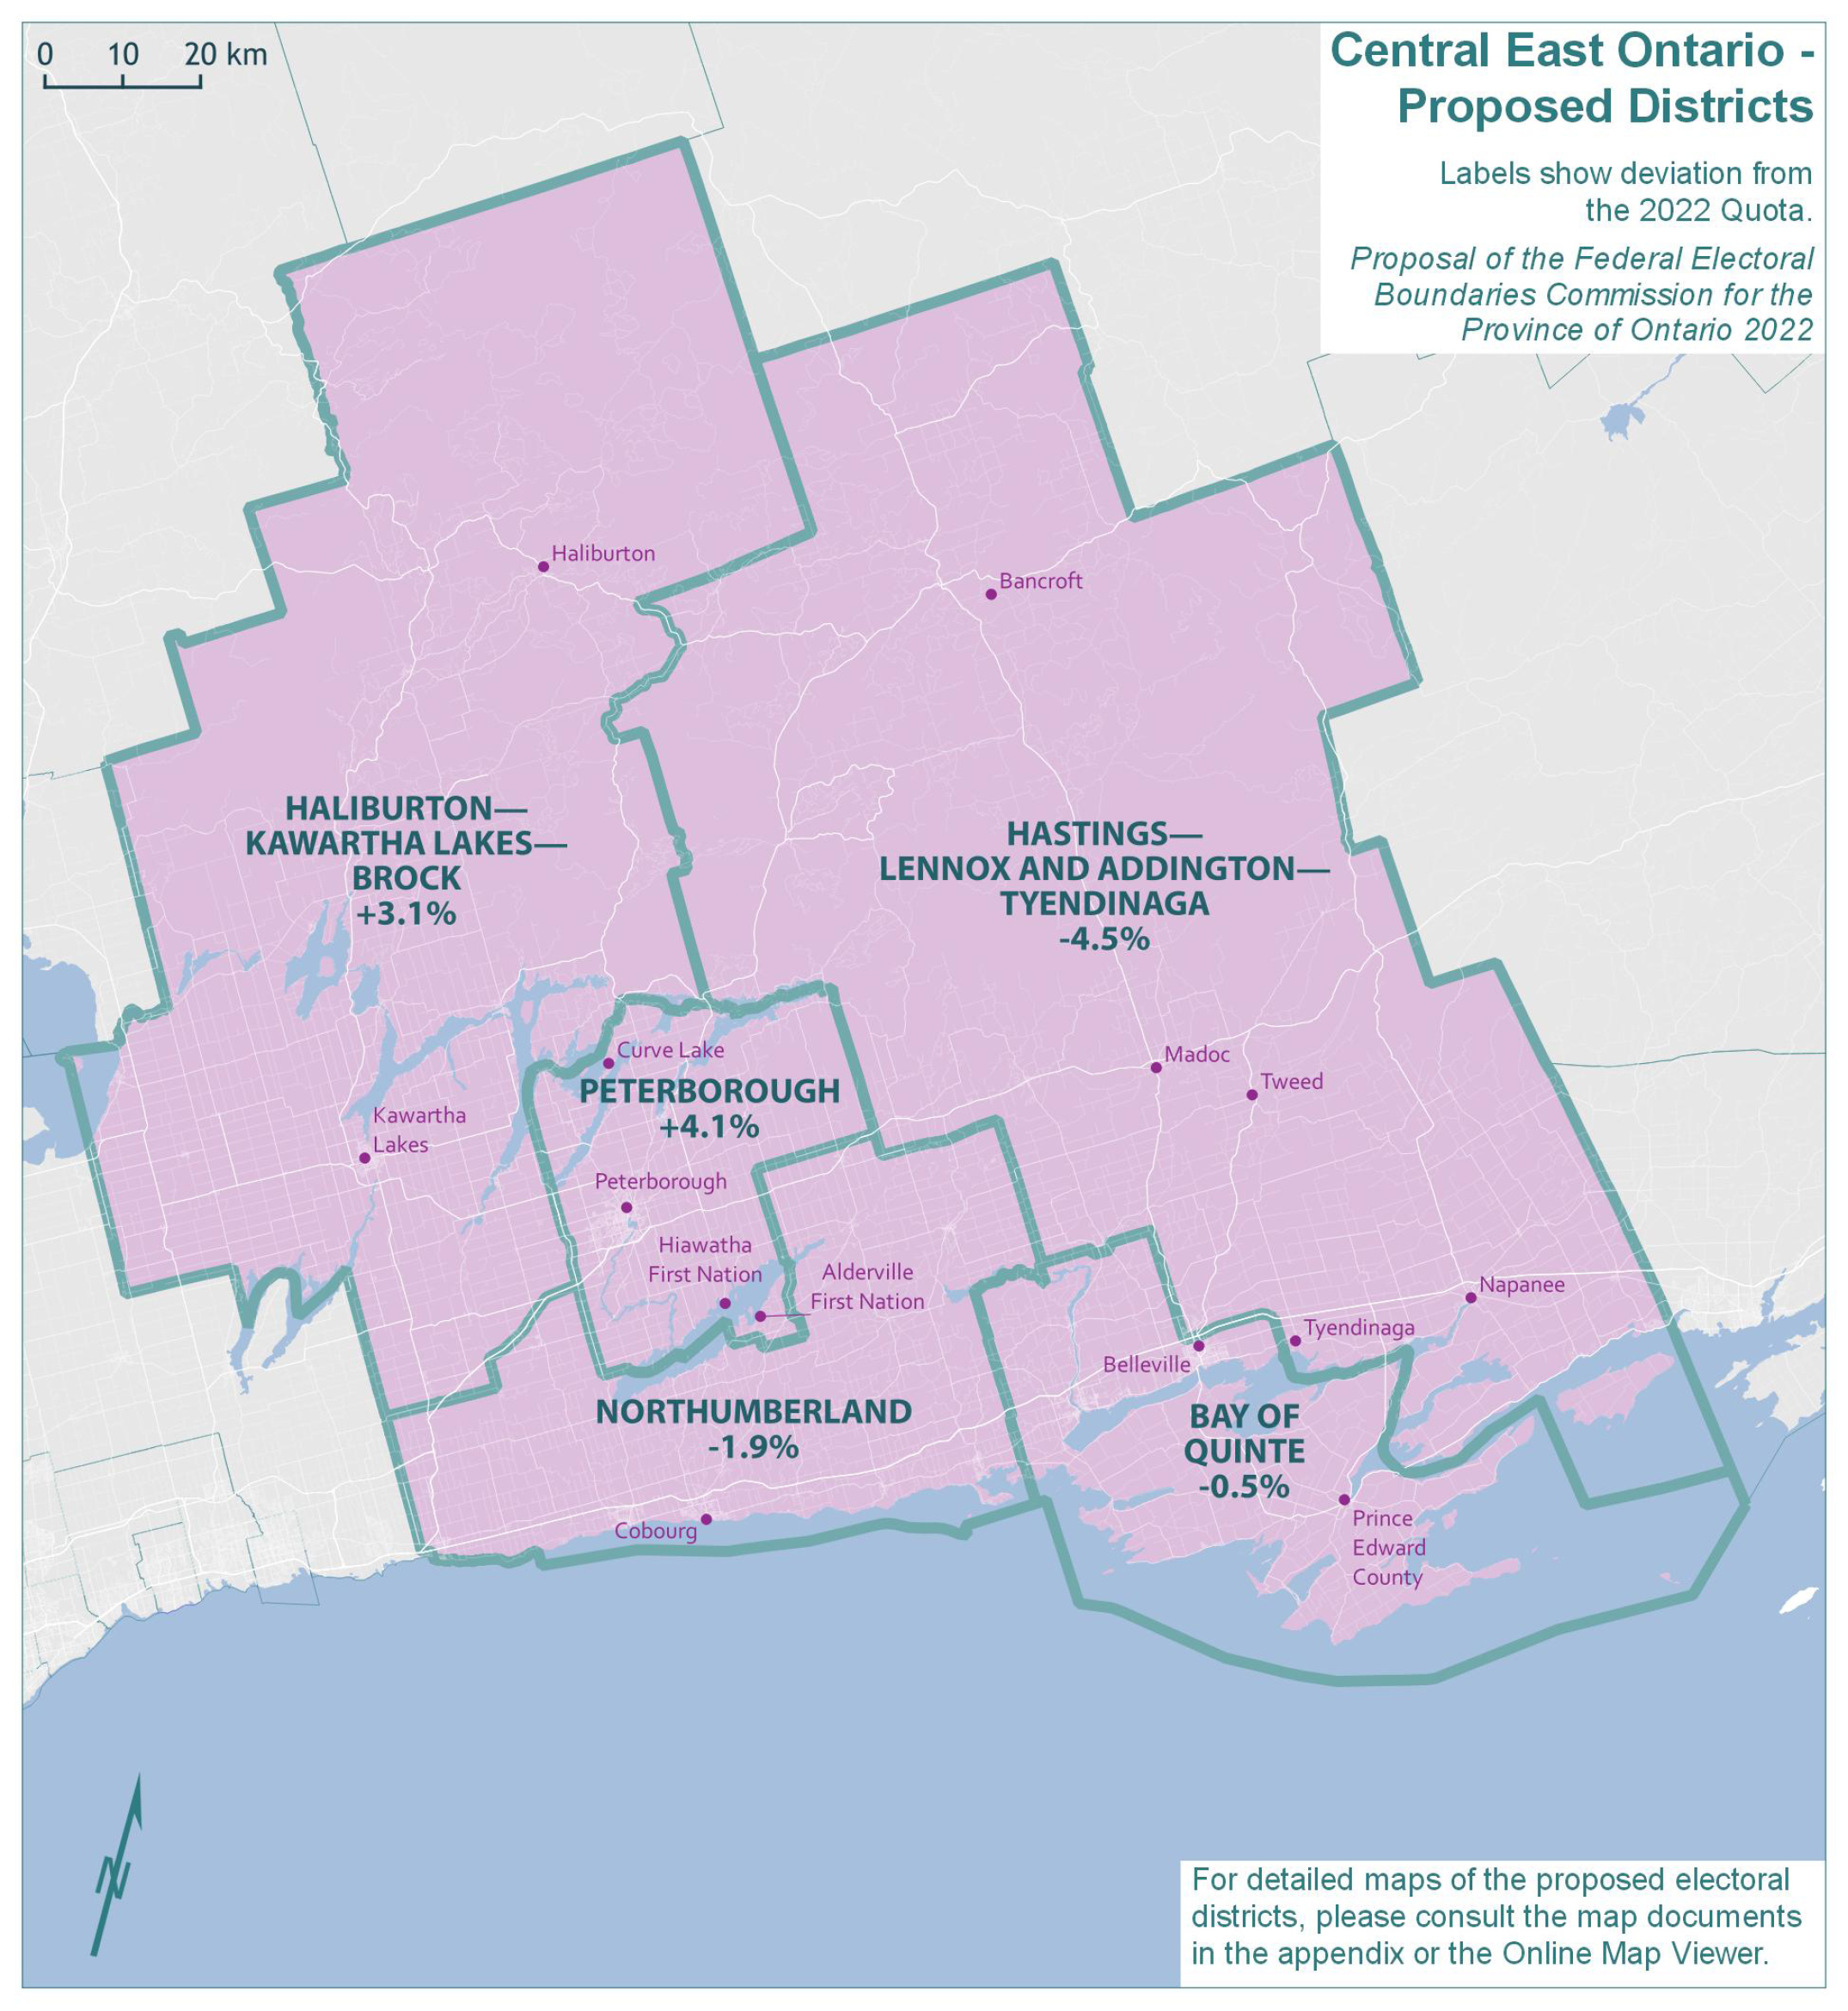
The Commission shifted boundaries to balance the population of the districts across this geographic piece. This affects most significantly the existing district of Hastings—Lennox and Addington.
The Commission also proposes shifting the boundaries of the existing district of Peterborough—Kawartha southward to ensure that the reserves of the Alderville First Nation lie within the same district and to recognize the established connection of the Township of Otonabee-South Monaghan with Peterborough. This district is renamed as PETERBOROUGH.
The new deviations from the Quota in the proposed redistribution plan are shown in Table 10B.
| Electoral Districts | Population – 2021 | Deviation from Quota – 2022 |
|---|---|---|
| Bay of Quinte | 116,016 | -0.49% |
| Haliburton—Kawartha Lakes—Brock | 120,254 | 3.14% |
| Hastings—Lennox and Addington—Tyendinaga | 111,331 | -4.51% |
| Northumberland | 114,335 | -1.93% |
| Peterborough | 121,336 | 4.07% |
| Average | 116,654 | 0.06% |
| Range (most populous to least populous) | 10,005 | 8.58 pp |
pp = percentage points
Mississauga
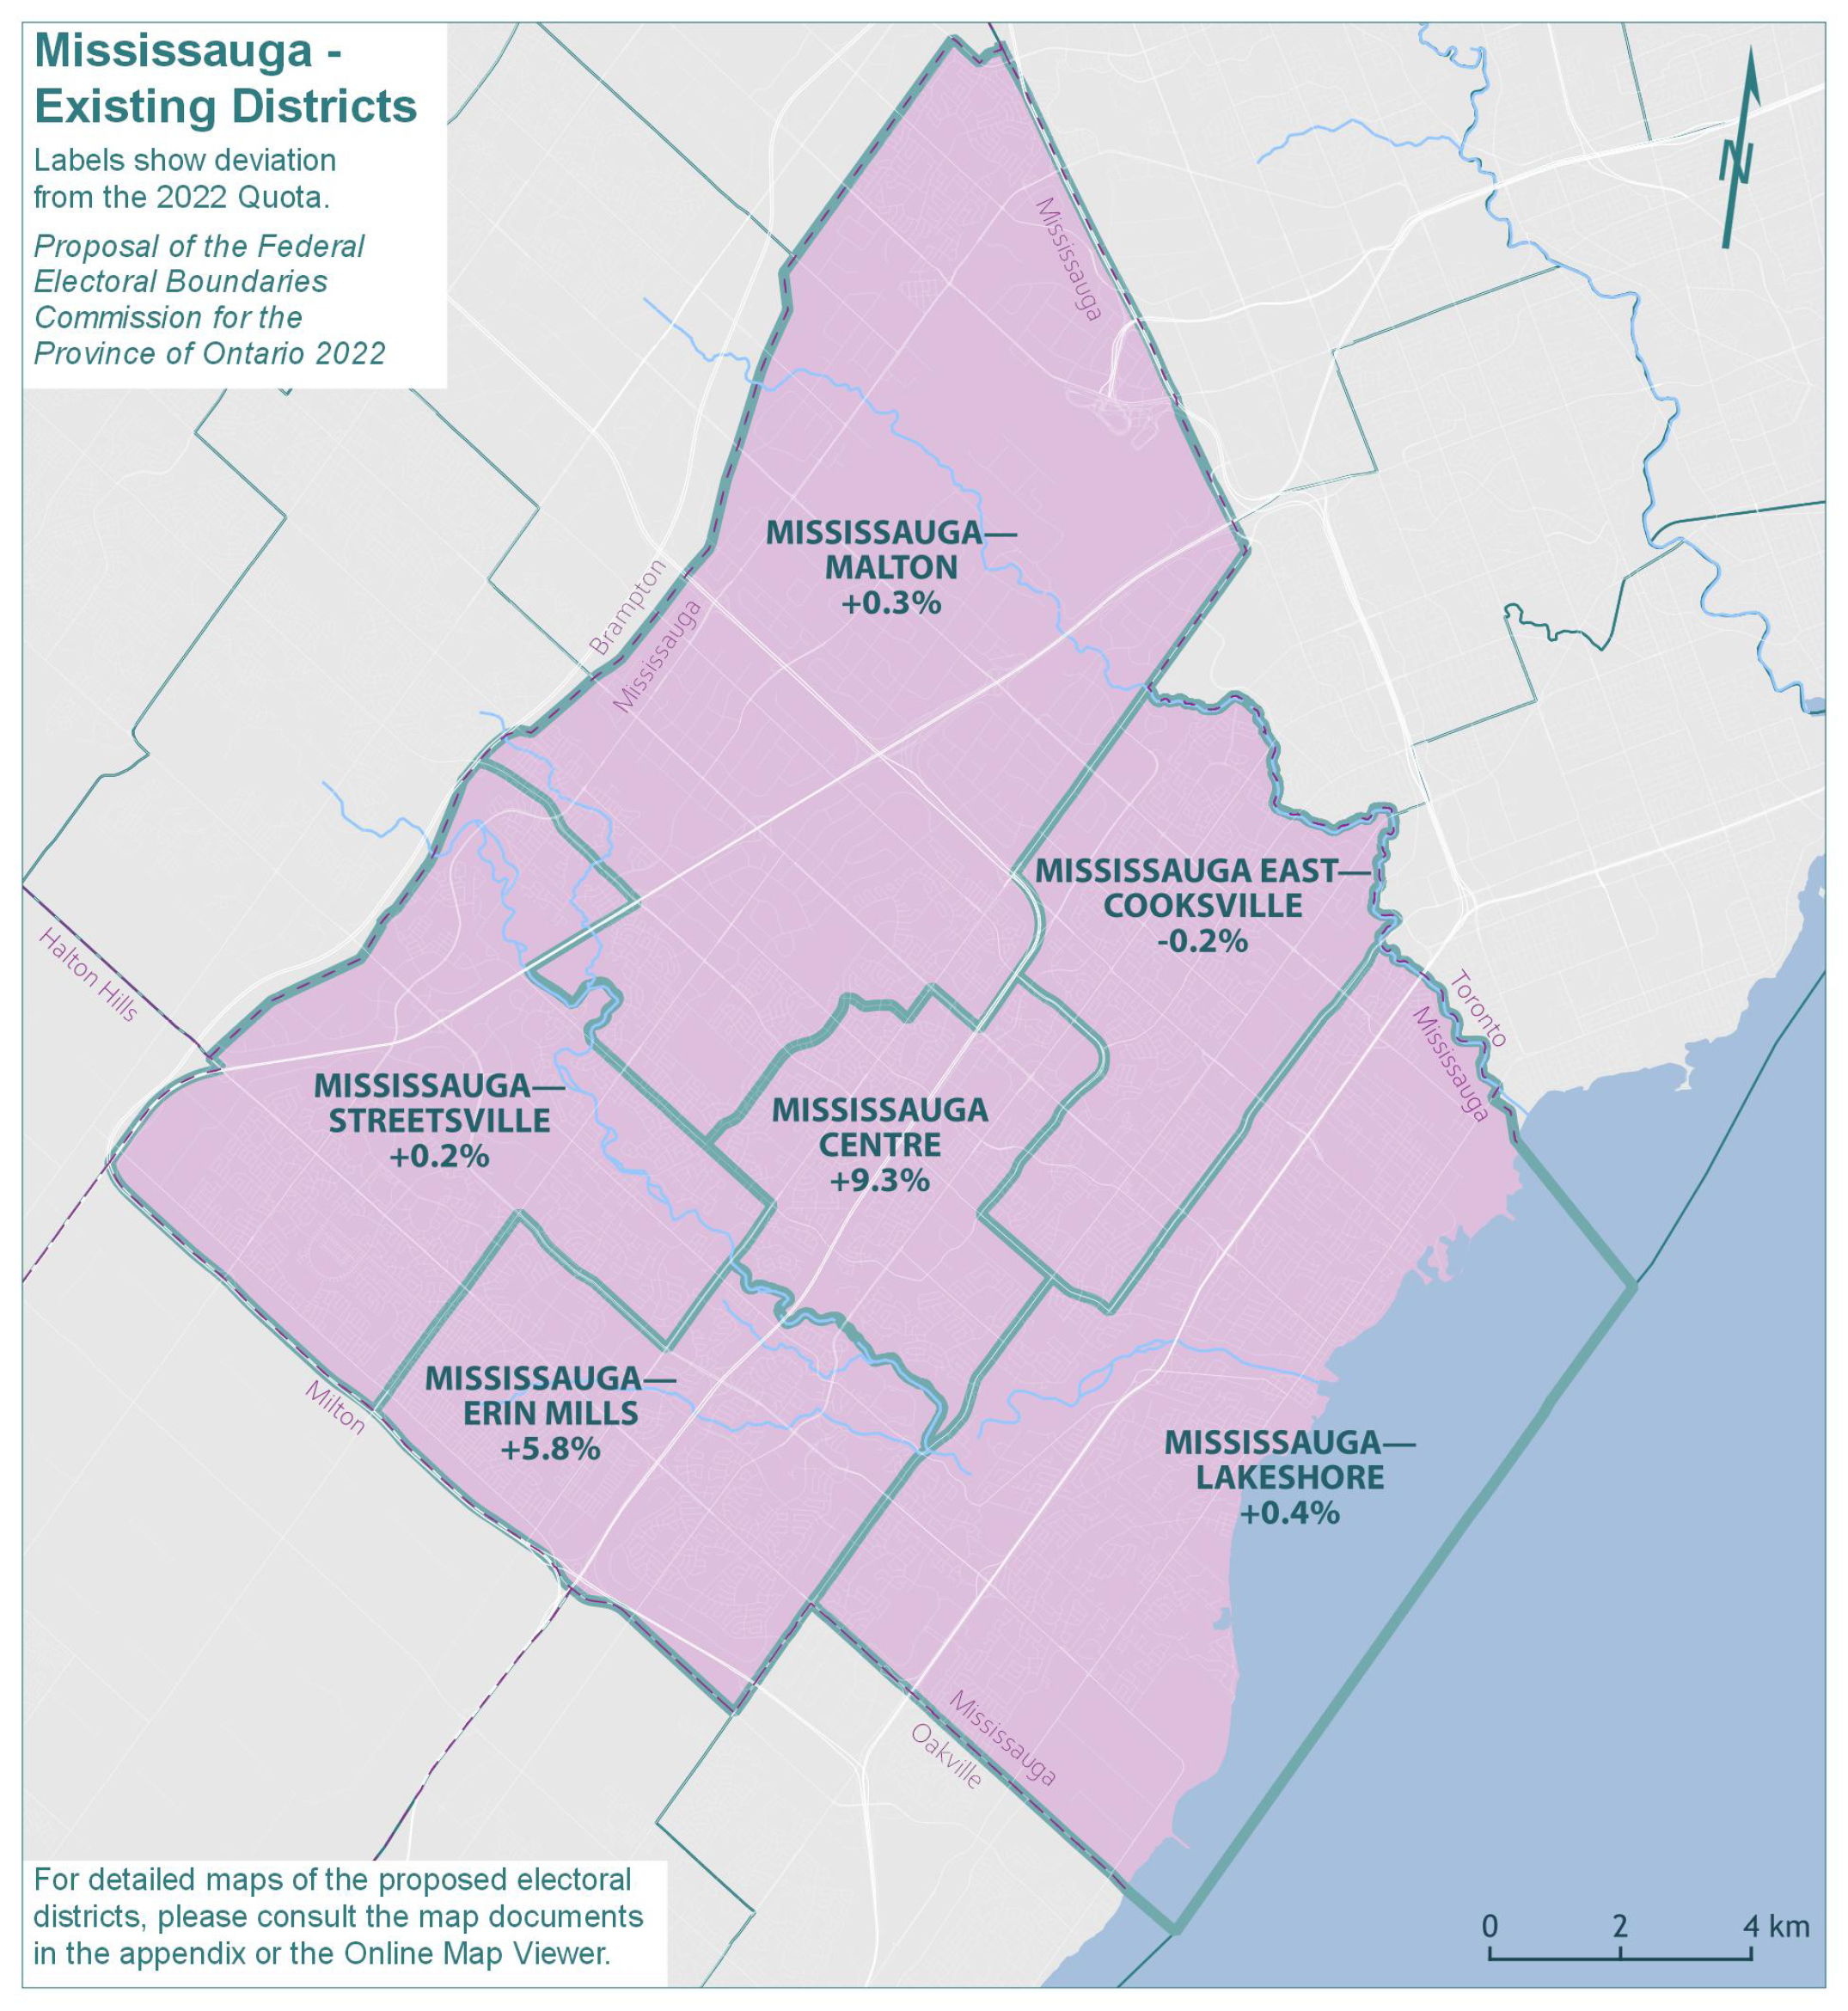
The population of Mississauga has remained relatively constant, with population growth of 0.6%, from 713,443 in 2011 to 717,961 in 2021. The remainder of Ontario grew by 11.3% in the same period.
The existing six electoral districts in Mississauga would have an average 2021 population of 119,660 and an average deviation of 2.6% from the Quota. The absolute range between the least and most populous districts would be 9.5 percentage points. The populations and deviations from the Quota for the existing electoral districts are shown in Table 11A.
| Electoral Districts | Population – 2011 | Deviation from Quota – 2012 | Population – 2021 | Deviation from Quota – 2022 |
|---|---|---|---|---|
| Mississauga Centre | 118,756 | 11.81% | 127,377 | 9.25% |
| Mississauga East—Cooksville | 121,792 | 14.67% | 116,346 | -0.21% |
| Mississauga—Erin Mills | 117,199 | 10.34% | 123,371 | 5.82% |
| Mississauga—Lakeshore | 118,893 | 11.94% | 117,095 | 0.43% |
| Mississauga—Malton | 118,046 | 11.14% | 116,908 | 0.27% |
| Mississauga—Streetsville | 118,757 | 11.81% | 116,864 | 0.24% |
| Average | 118,907 | 11.95% | 119,660 | 2.63% |
| Range (most populous to least populous) | 4,593 | 4.33 pp | 11,031 | 9.46 pp |
pp = percentage points
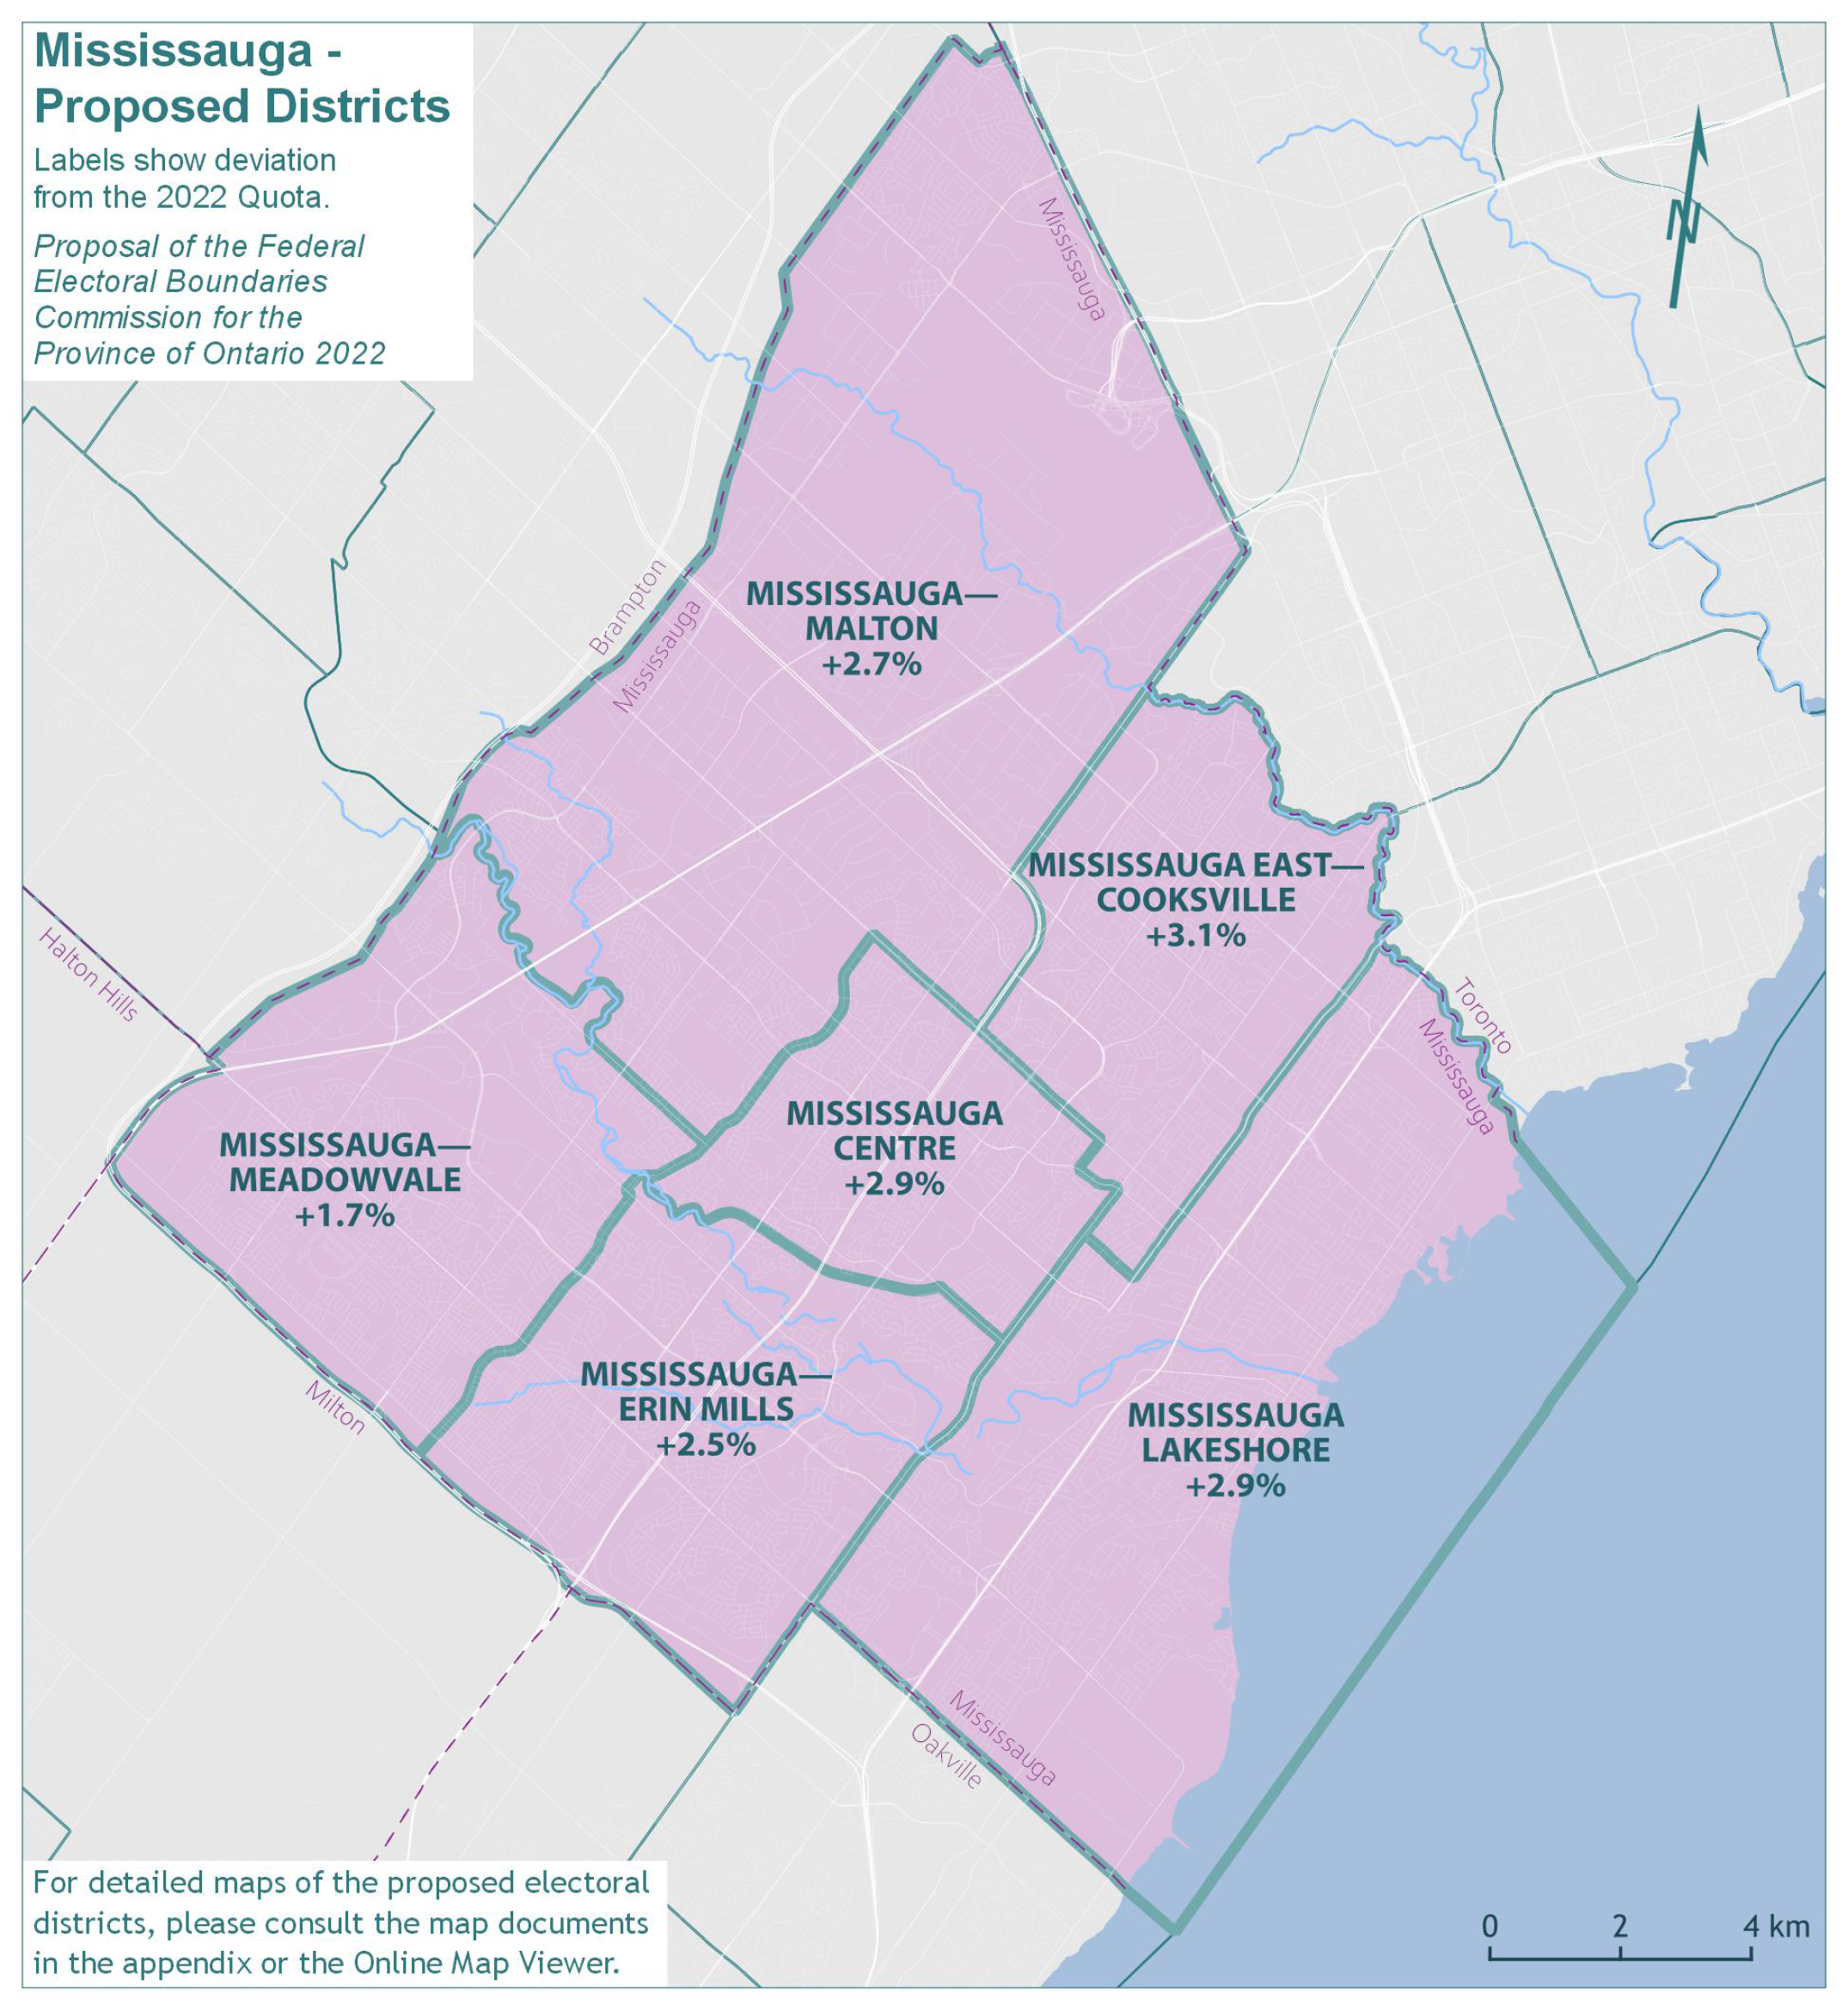
The Commission proposes minor boundary adjustments to balance the populations of the six existing districts in Mississauga. These districts remain within the municipal boundaries of the City of Mississauga, and their boundaries align with major roads, the Credit River, and the Canadian Pacific rail line.
The new deviations from the Quota in the proposed redistribution plan are shown in Table 11B.
| Electoral Districts | Population – 2021 | Deviation from Quota – 2022 |
|---|---|---|
| Mississauga Centre | 119,975 | 2.90% |
| Mississauga East—Cooksville | 120,196 | 3.09% |
| Missisauga—Erin Mills | 119,526 | 2.52% |
| Mississauga Lakeshore | 119,936 | 2.87% |
| Mississauga—Malton | 119,741 | 2.70% |
| Mississauga—Meadowvale | 118,587 | 1.71% |
| Average | 119,660 | 2.63% |
| Range (most populous to least populous) | 1,609 | 1.38 pp |
pp = percentage points
Hamilton and Niagara
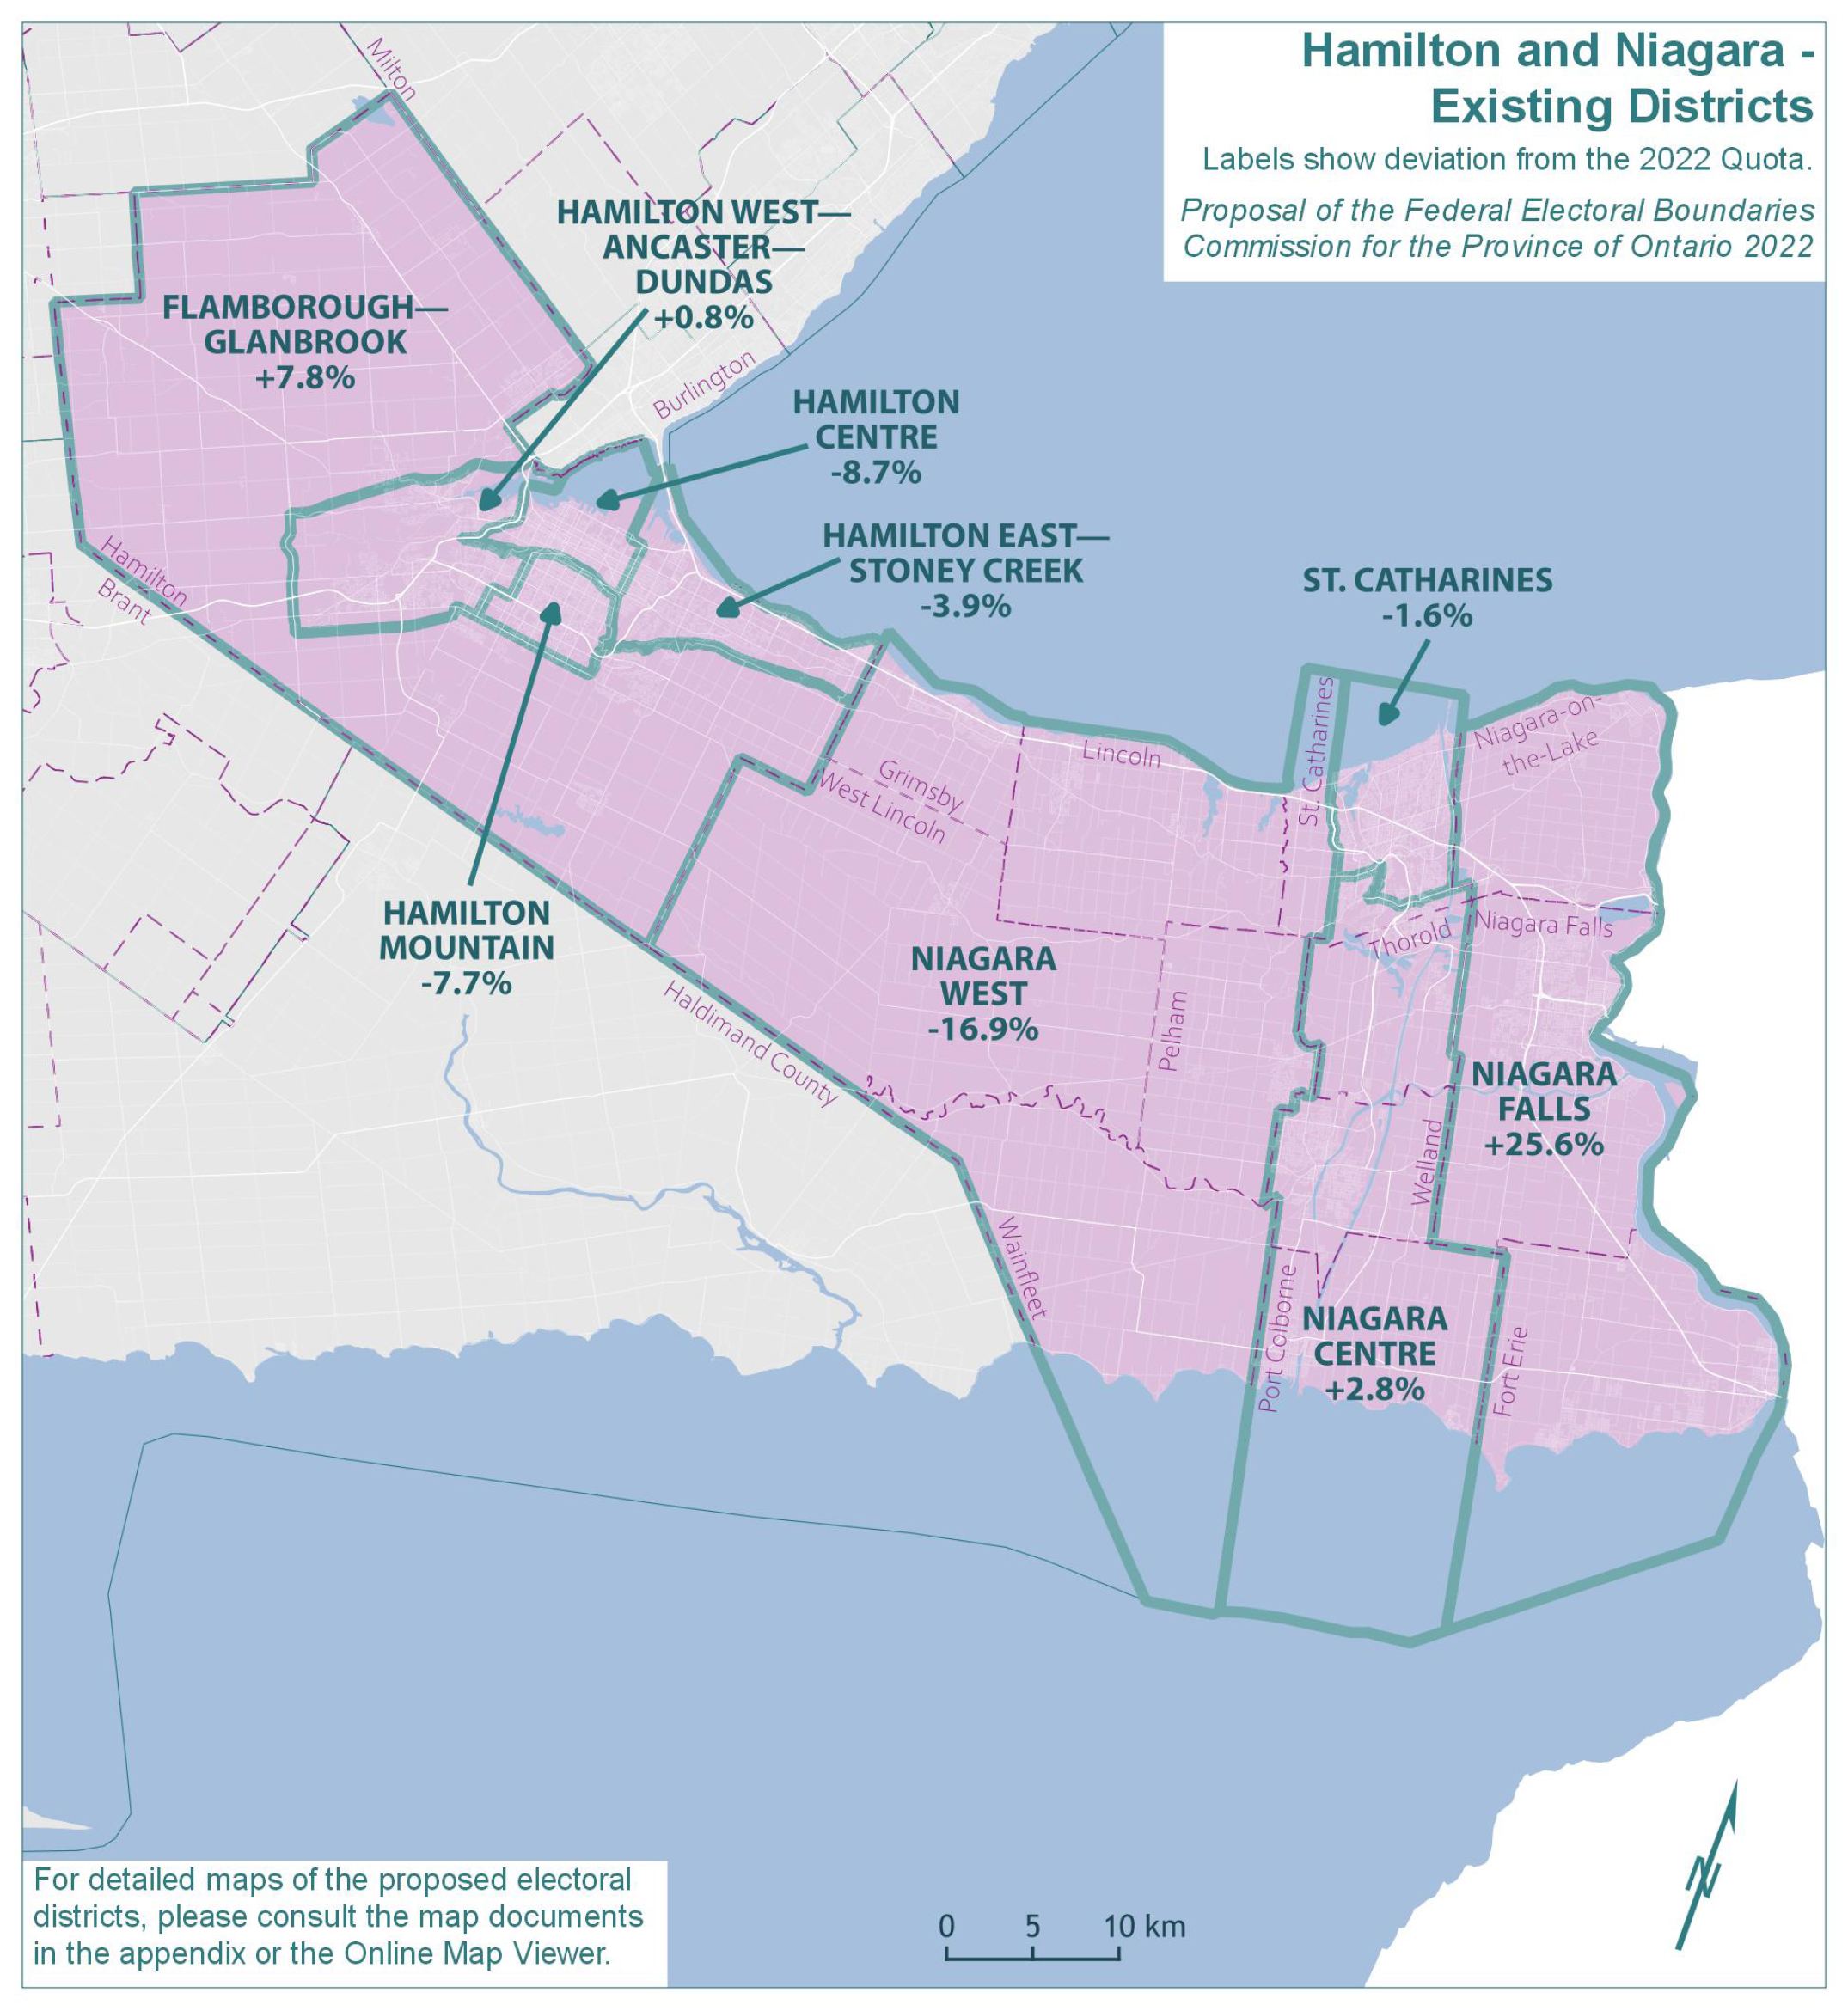
The population of Hamilton and Niagara grew by 10.1%, from 951,295 in 2011 to 1,047,294 in 2021. The remainder of Ontario grew by 10.7% in the same period.
The existing nine electoral districts in this geographic piece would have an average 2021 population of 116,366, which falls just 0.2% below the Quota. However, the Commission noted the unacceptably high range of deviation (42.4 percentage points) between the least and most populous districts. The populations and deviations from the Quota for the existing districts are shown in Table 12A.
| Electoral Districts | Population – 2011 | Deviation from Quota – 2012 | Population – 2021 | Deviation from Quota – 2022 |
|---|---|---|---|---|
| Flamborough—Glanbrook | 97,081 | -8.60% | 125,692 | 7.81% |
| Hamilton Centre | 101,932 | -4.03% | 106,439 | -8.71% |
| Hamilton East—Stoney Creek | 107,786 | 1.48% | 112,028 | -3.91% |
| Hamilton Mountain | 103,615 | -2.45% | 107,629 | -7.69% |
| Hamilton West—Ancaster—Dundas | 109,535 | 3.13% | 117,565 | 0.84% |
| Niagara Centre | 105,860 | -0.33% | 119,809 | 2.76% |
| Niagara Falls | 128,357 | 20.85% | 146,404 | 25.57% |
| Niagara West | 86,533 | -18.53% | 96,946 | -16.85% |
| St. Catharines | 110,596 | 4.13% | 114,782 | -1.55% |
| Average | 105,699 | -0.48% | 116,366 | -0.19% |
| Range (most populous to least populous) | 41,824 | 39.38 pp | 49,458 | 42.42 pp |
pp = percentage points
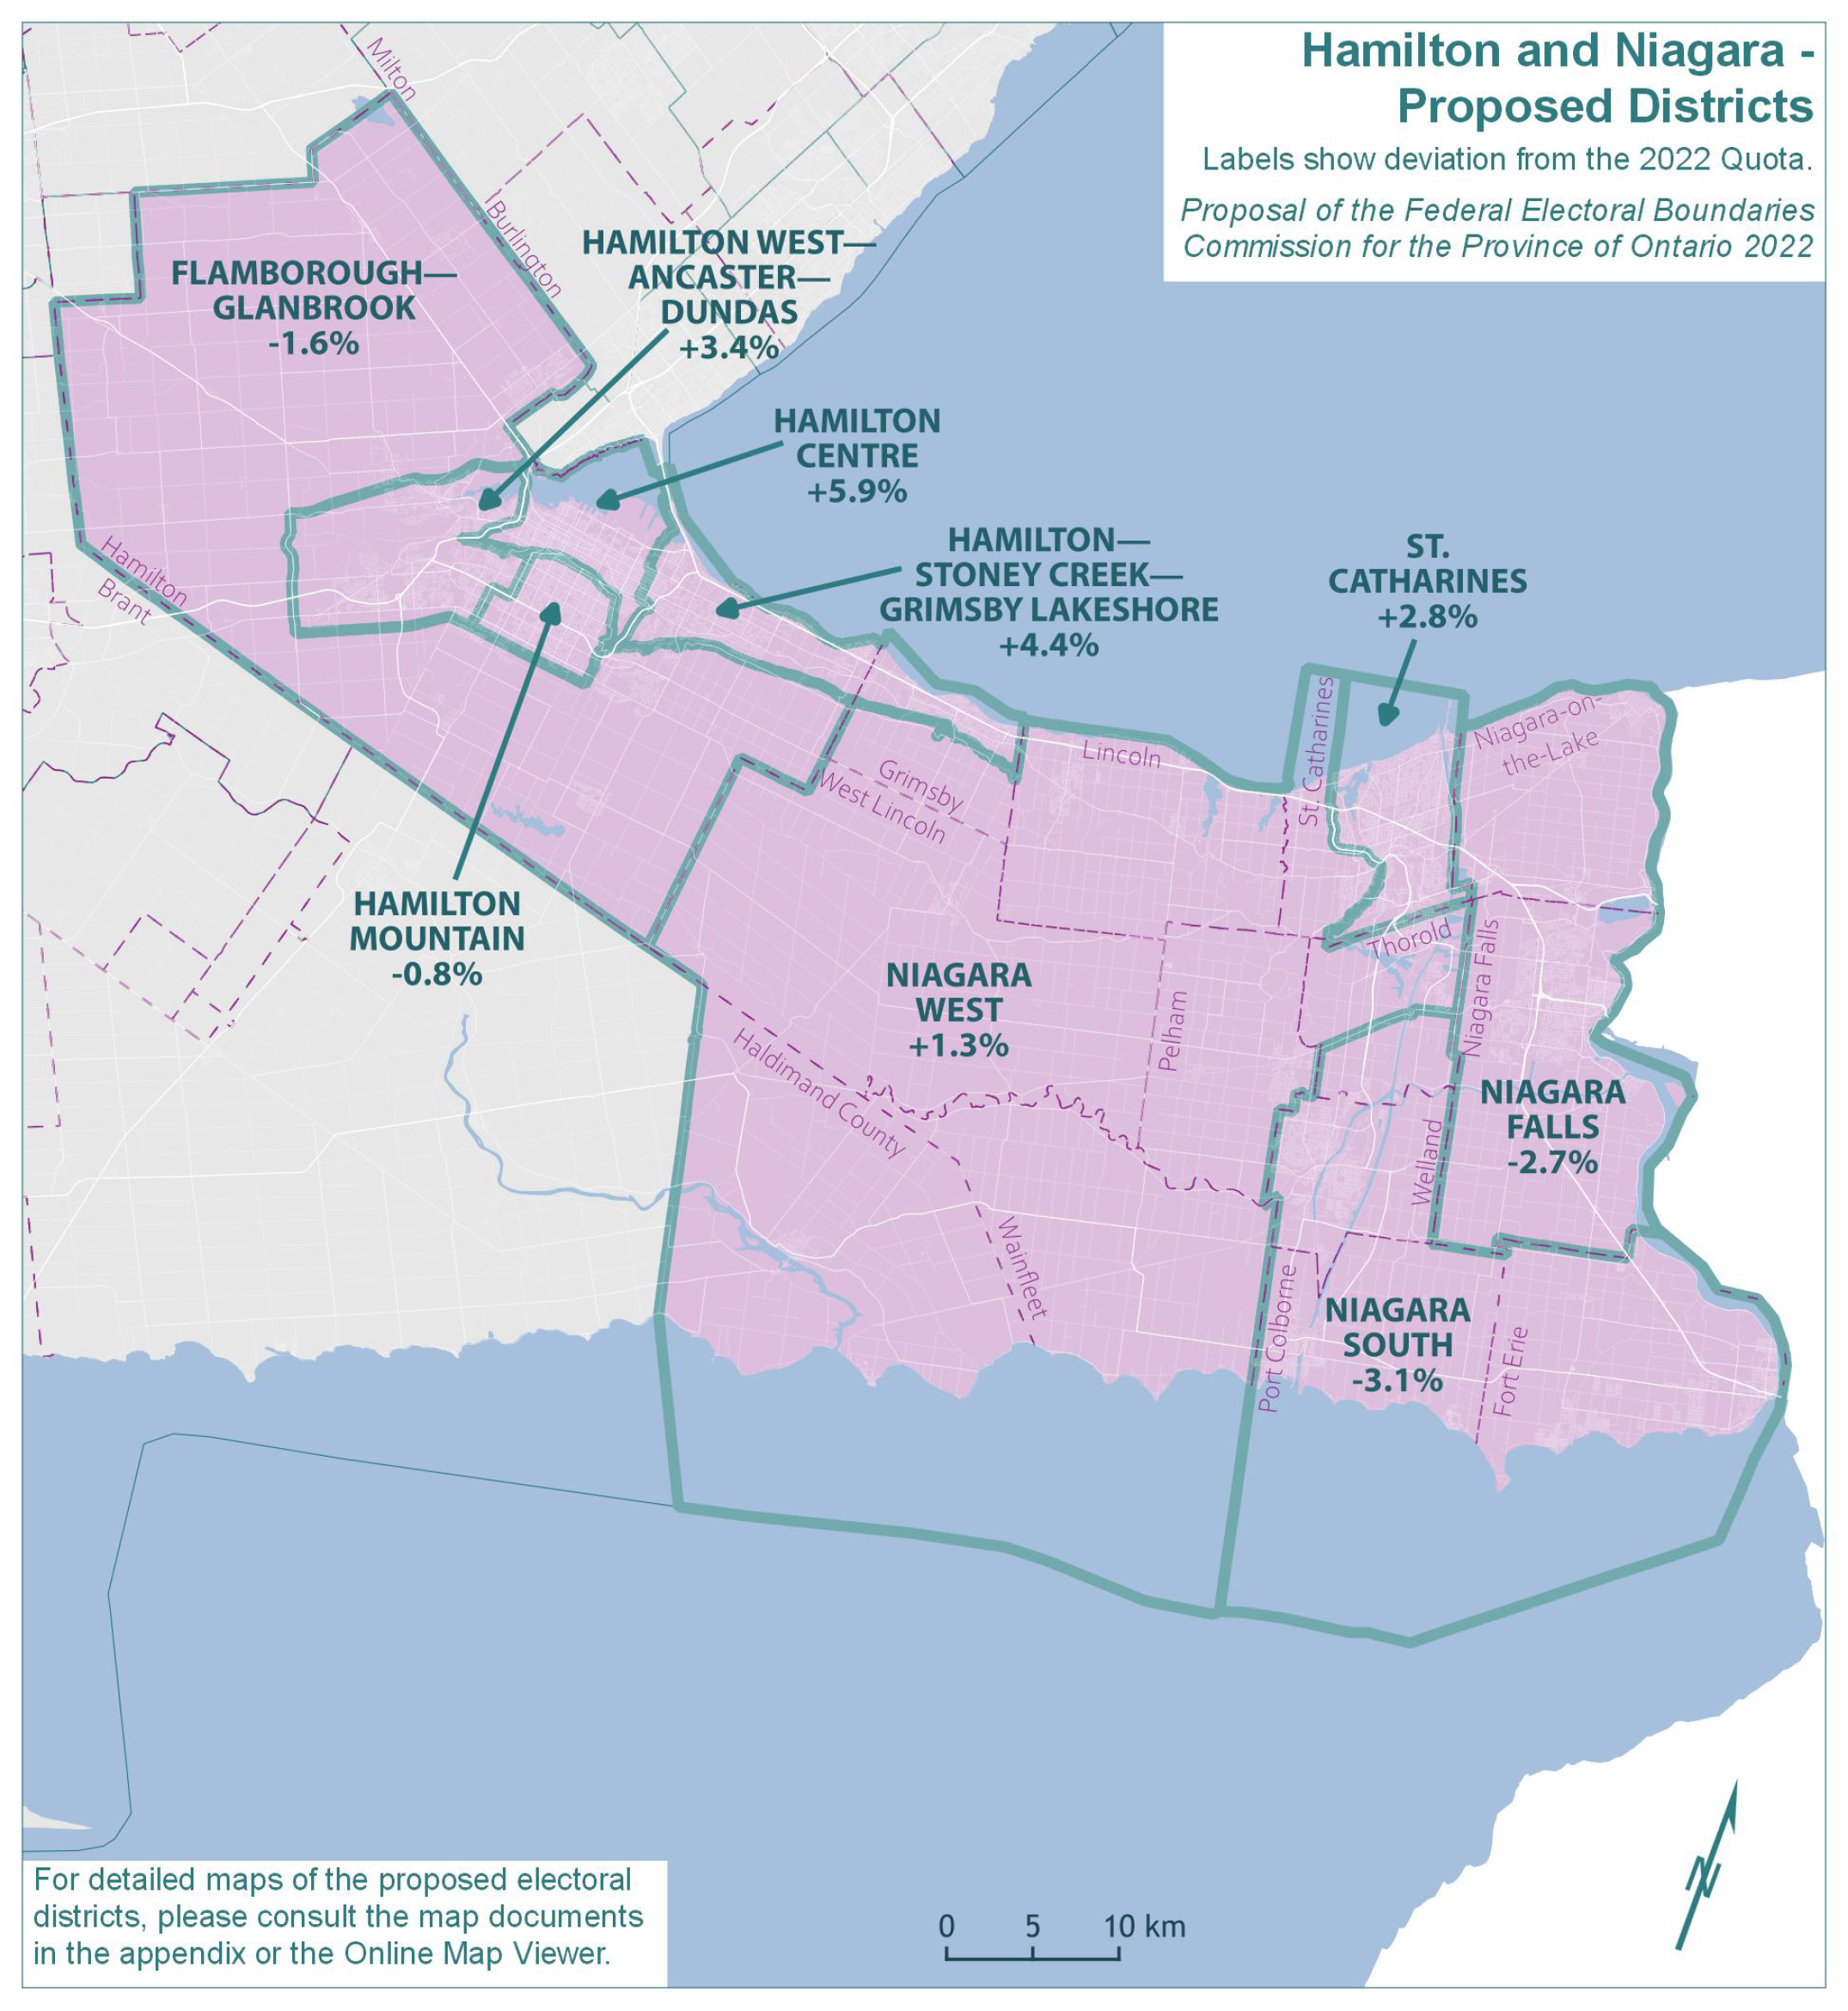
Within the Niagara Peninsula, the Commission noted unreasonable variations in the population size of the existing districts of Niagara Falls and Niagara West. Significant adjustments were required to achieve population equality, with resulting impacts on contiguous areas.
In the Hamilton area, the Commission made minor boundary adjustments to achieve voter parity. One resulting change was the inclusion of the urban portions of the Municipality of Grimsby within the newly named district of HAMILTON—STONEY CREEK—GRIMSBY LAKESHORE. This is a consequence of changes that were necessary in the Niagara area.
The new deviations from the Quota in the proposed redistribution plan are shown in Table 12B.
| Electoral Districts | Population – 2021 | Deviation from Quota – 2022 |
|---|---|---|
| Flamborough—Glanbrook | 114,701 | -1.62% |
| Hamilton Centre | 123,520 | 5.94% |
| Hamilton Mountain | 115,634 | -0.82% |
| Hamilton—Stoney Creek—Grimsby Lakeshore | 121,709 | 4.39% |
| Hamilton West—Ancaster—Dundas | 120,551 | 3.40% |
| Niagara Falls | 113,503 | -2.65% |
| Niagara South | 112,928 | -3.14% |
| Niagara West | 118,158 | 1.34% |
| St. Catharines | 119,873 | 2.82% |
| Average | 117,842 | 1.07% |
| Range (most populous to least populous) | 10,592 | 9.08 pp |
pp = percentage points
South Central Ontario
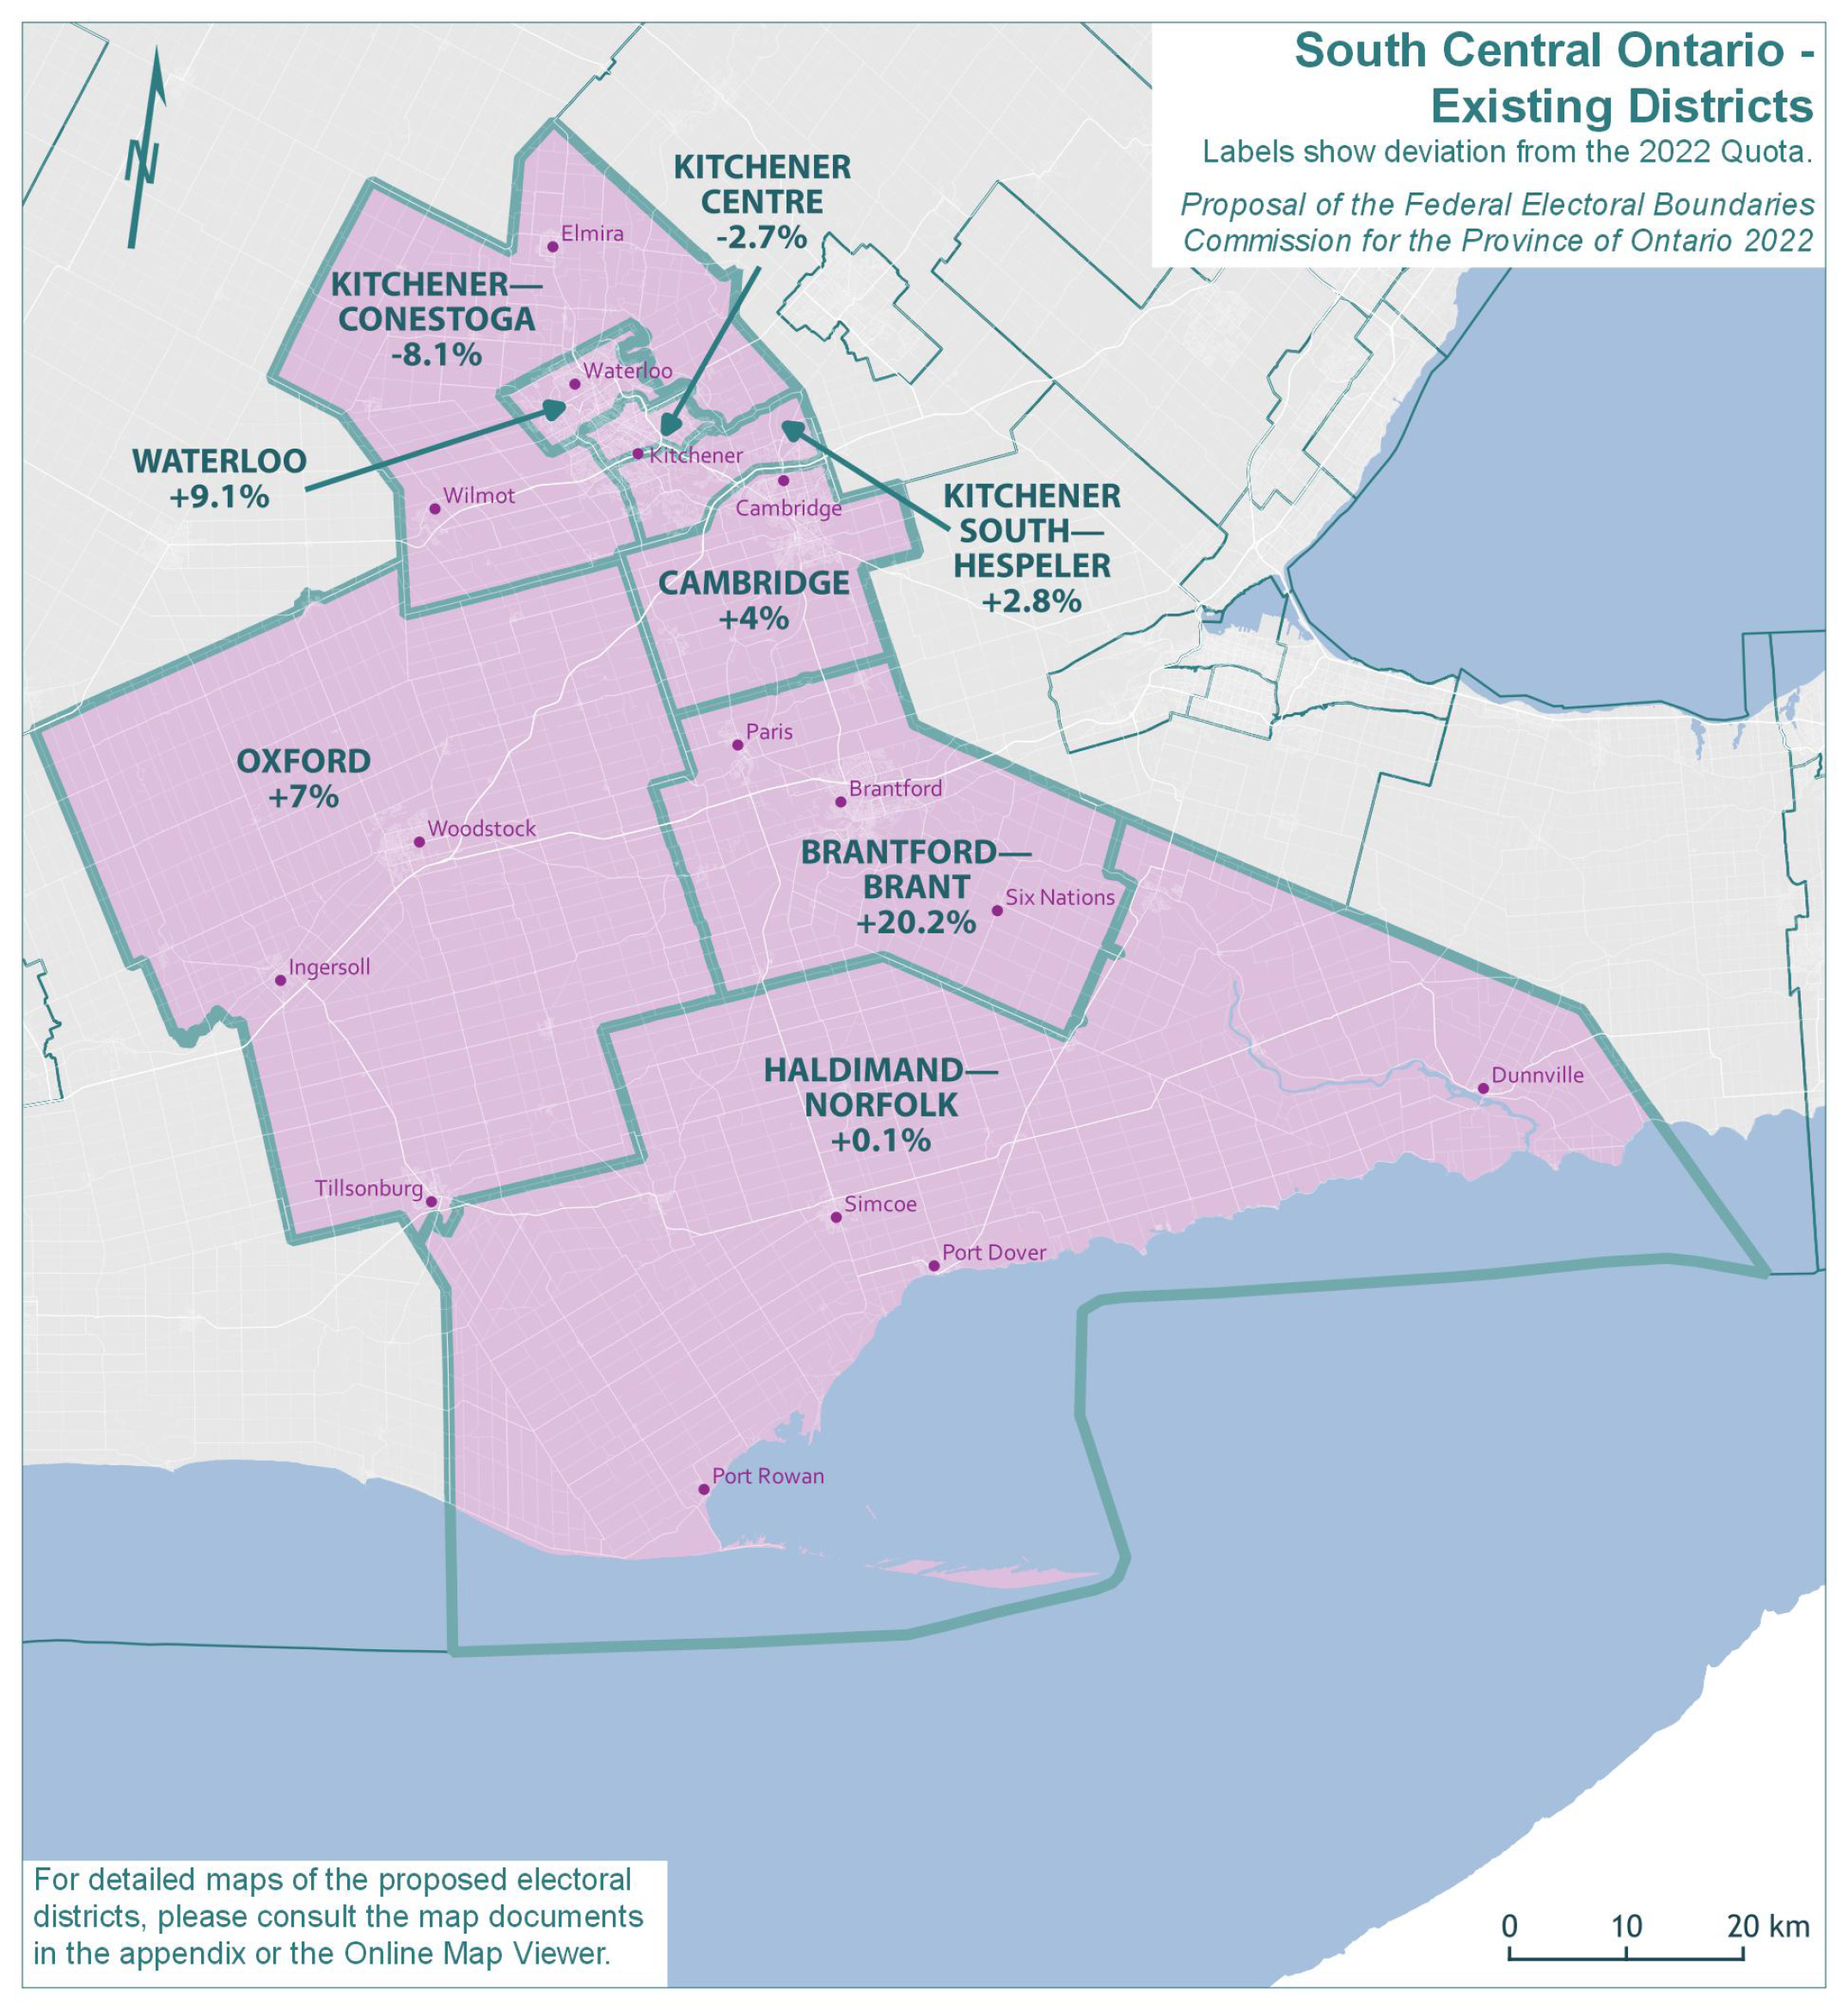
The population of South Central Ontario grew by 13.1%, from 857,968 in 2011 to 970,608 in 2021. The remainder of Ontario grew by 10.5% in the same period.
The existing eight electoral districts in South Central Ontario would have an average 2021 population of 121,326 and an average deviation of 4.1% from the Quota. The absolute range between the least and most populous districts would be 28.3 percentage points. The populations and deviations from the Quota for the existing electoral districts are shown in Table 13A.
| Electoral Districts | Population — 2011 | Deviation from Quota — 2012 | Population — 2021 | Deviation from Quota — 2022 |
|---|---|---|---|---|
| Brantford—Brant | 132,443 | 24.69% | 140,139 | 20.20% |
| Cambridge | 111,693 | 5.16% | 121,301 | 4.04% |
| Haldimand—Norfolk | 108,051 | 1.73% | 116,706 | 0.10% |
| Kitchener Centre | 102,433 | -3.56% | 113,452 | -2.69% |
| Kitchener—Conestoga | 93,827 | -11.66% | 107,134 | -8.11% |
| Kitchener South—Hespeler | 97,673 | -8.04% | 119,851 | 2.80% |
| Oxford | 108,656 | 2.30% | 124,790 | 7.03% |
| Waterloo | 103,192 | -2.85% | 127,235 | 9.13% |
| Average | 107,246 | 0.97% | 121,326 | 4.06% |
| Range (most populous to least populous) | 38,616 | 36.35 pp | 33,005 | 28.31 pp |
pp = percentage points
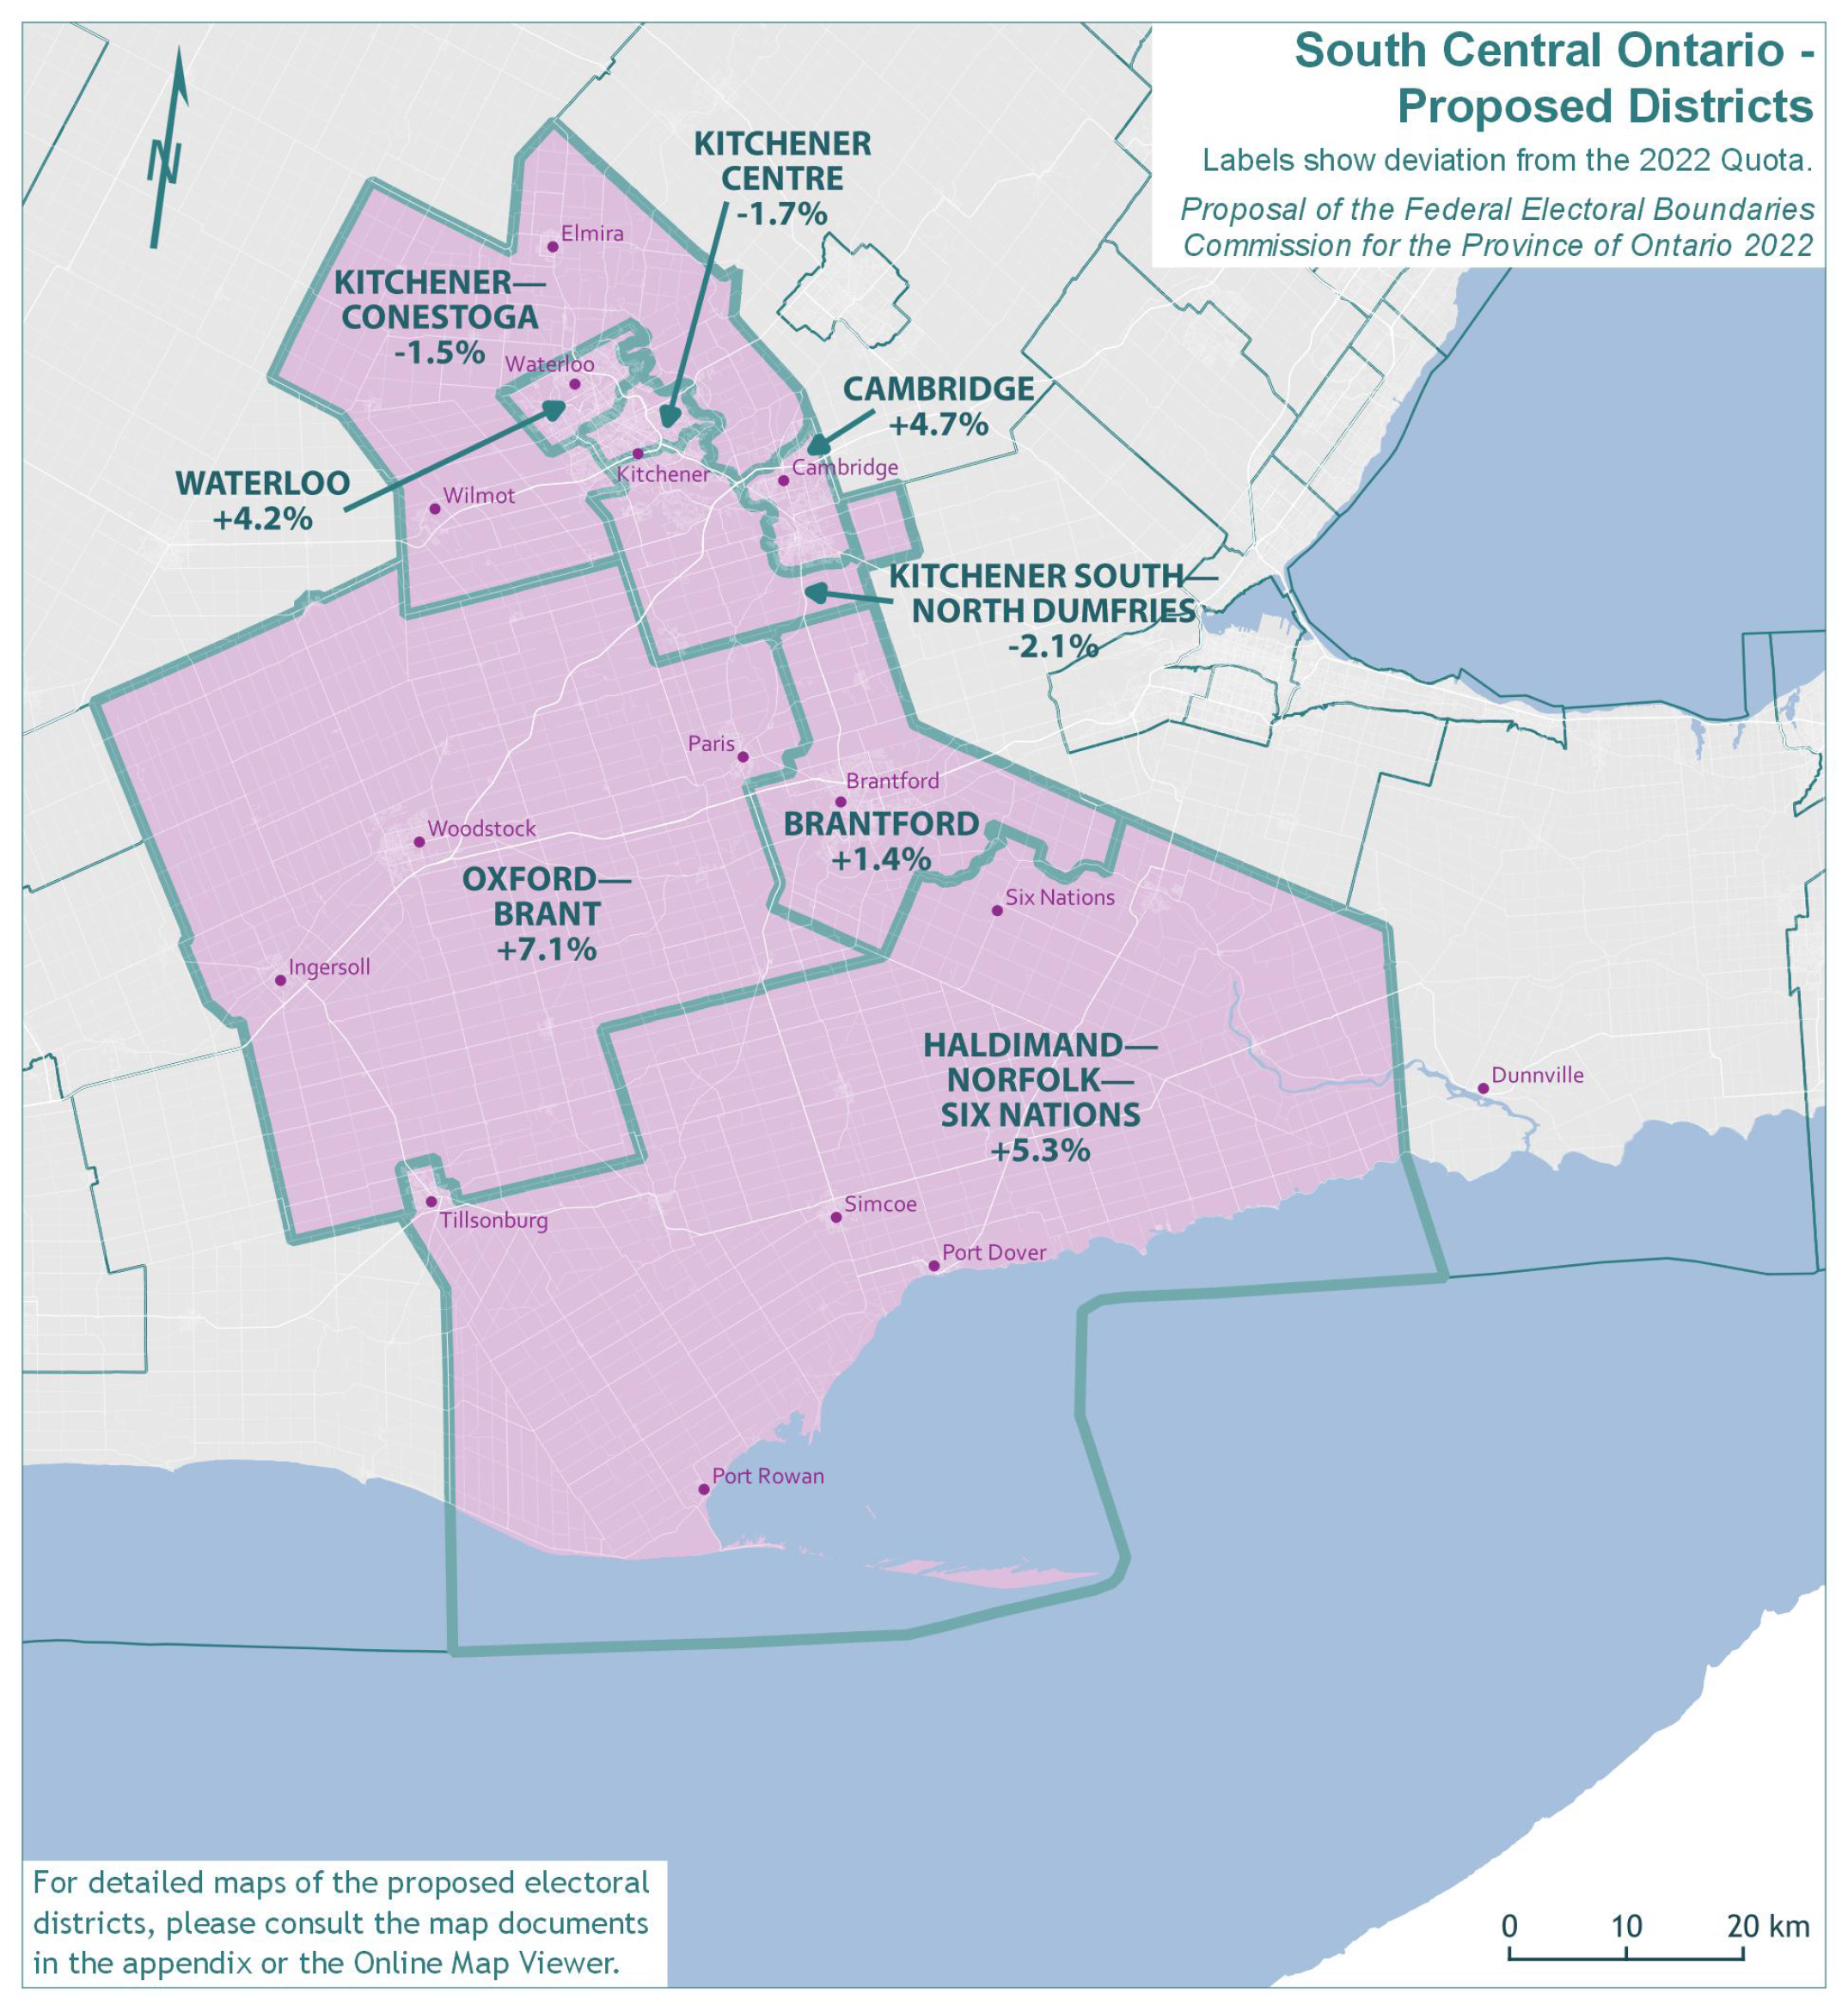
The Commission noted the significant deviation from the Quota in the prior redistribution in the existing district of Brantford—Brant. To address this, the Commission has reduced the geographic size of this district and proposed it be renamed BRANTFORD.
As a result, several communities have been re-assigned to surrounding districts to the west and south in order to balance populations. Notably, the community of Six Nations of the Grand River has been preserved but is now located within the district to the south, newly named as HALDIMAND—NORFOLK—SIX NATIONS.
Additionally, in the interest of achieving voter parity, a series of minor boundary changes were made to balance populations in the districts surrounding Kitchener, Waterloo, and Cambridge.
The community of Hespeler, south of the Speed River, has been added to the proposed district of CAMBRIDGE to better unify the City of Cambridge. The Township of North Dumfries has been shifted from the existing district of Cambridge and into the proposed district of KITCHENER SOUTH—NORTH DUMFRIES.
Several district names have been changed to better describe their locations or reflect communities of interest within the districts.
The new deviations from the Quota in the proposed redistribution plan are shown in Table 13B.
| Electoral Districts | Population — 2021 | Deviation from Quota — 2022 |
|---|---|---|
| Brantford | 118,167 | 1.35% |
| Cambridge | 122,099 | 4.73% |
| Haldimand—Norfolk—Six Nations | 122,813 | 5.34% |
| Kitchener Centre | 114,595 | -1.71% |
| Kitchener—Conestoga | 114,856 | -1.49% |
| Kitchener South—North Dumfries | 114,179 | -2.07% |
| Oxford—Brant | 124,844 | 7.08% |
| Waterloo | 121,436 | 4.16% |
| Average | 119,124 | 2.17% |
| Range (most populous to least populous) | 10,665 | 9.15 pp |
pp = percentage points
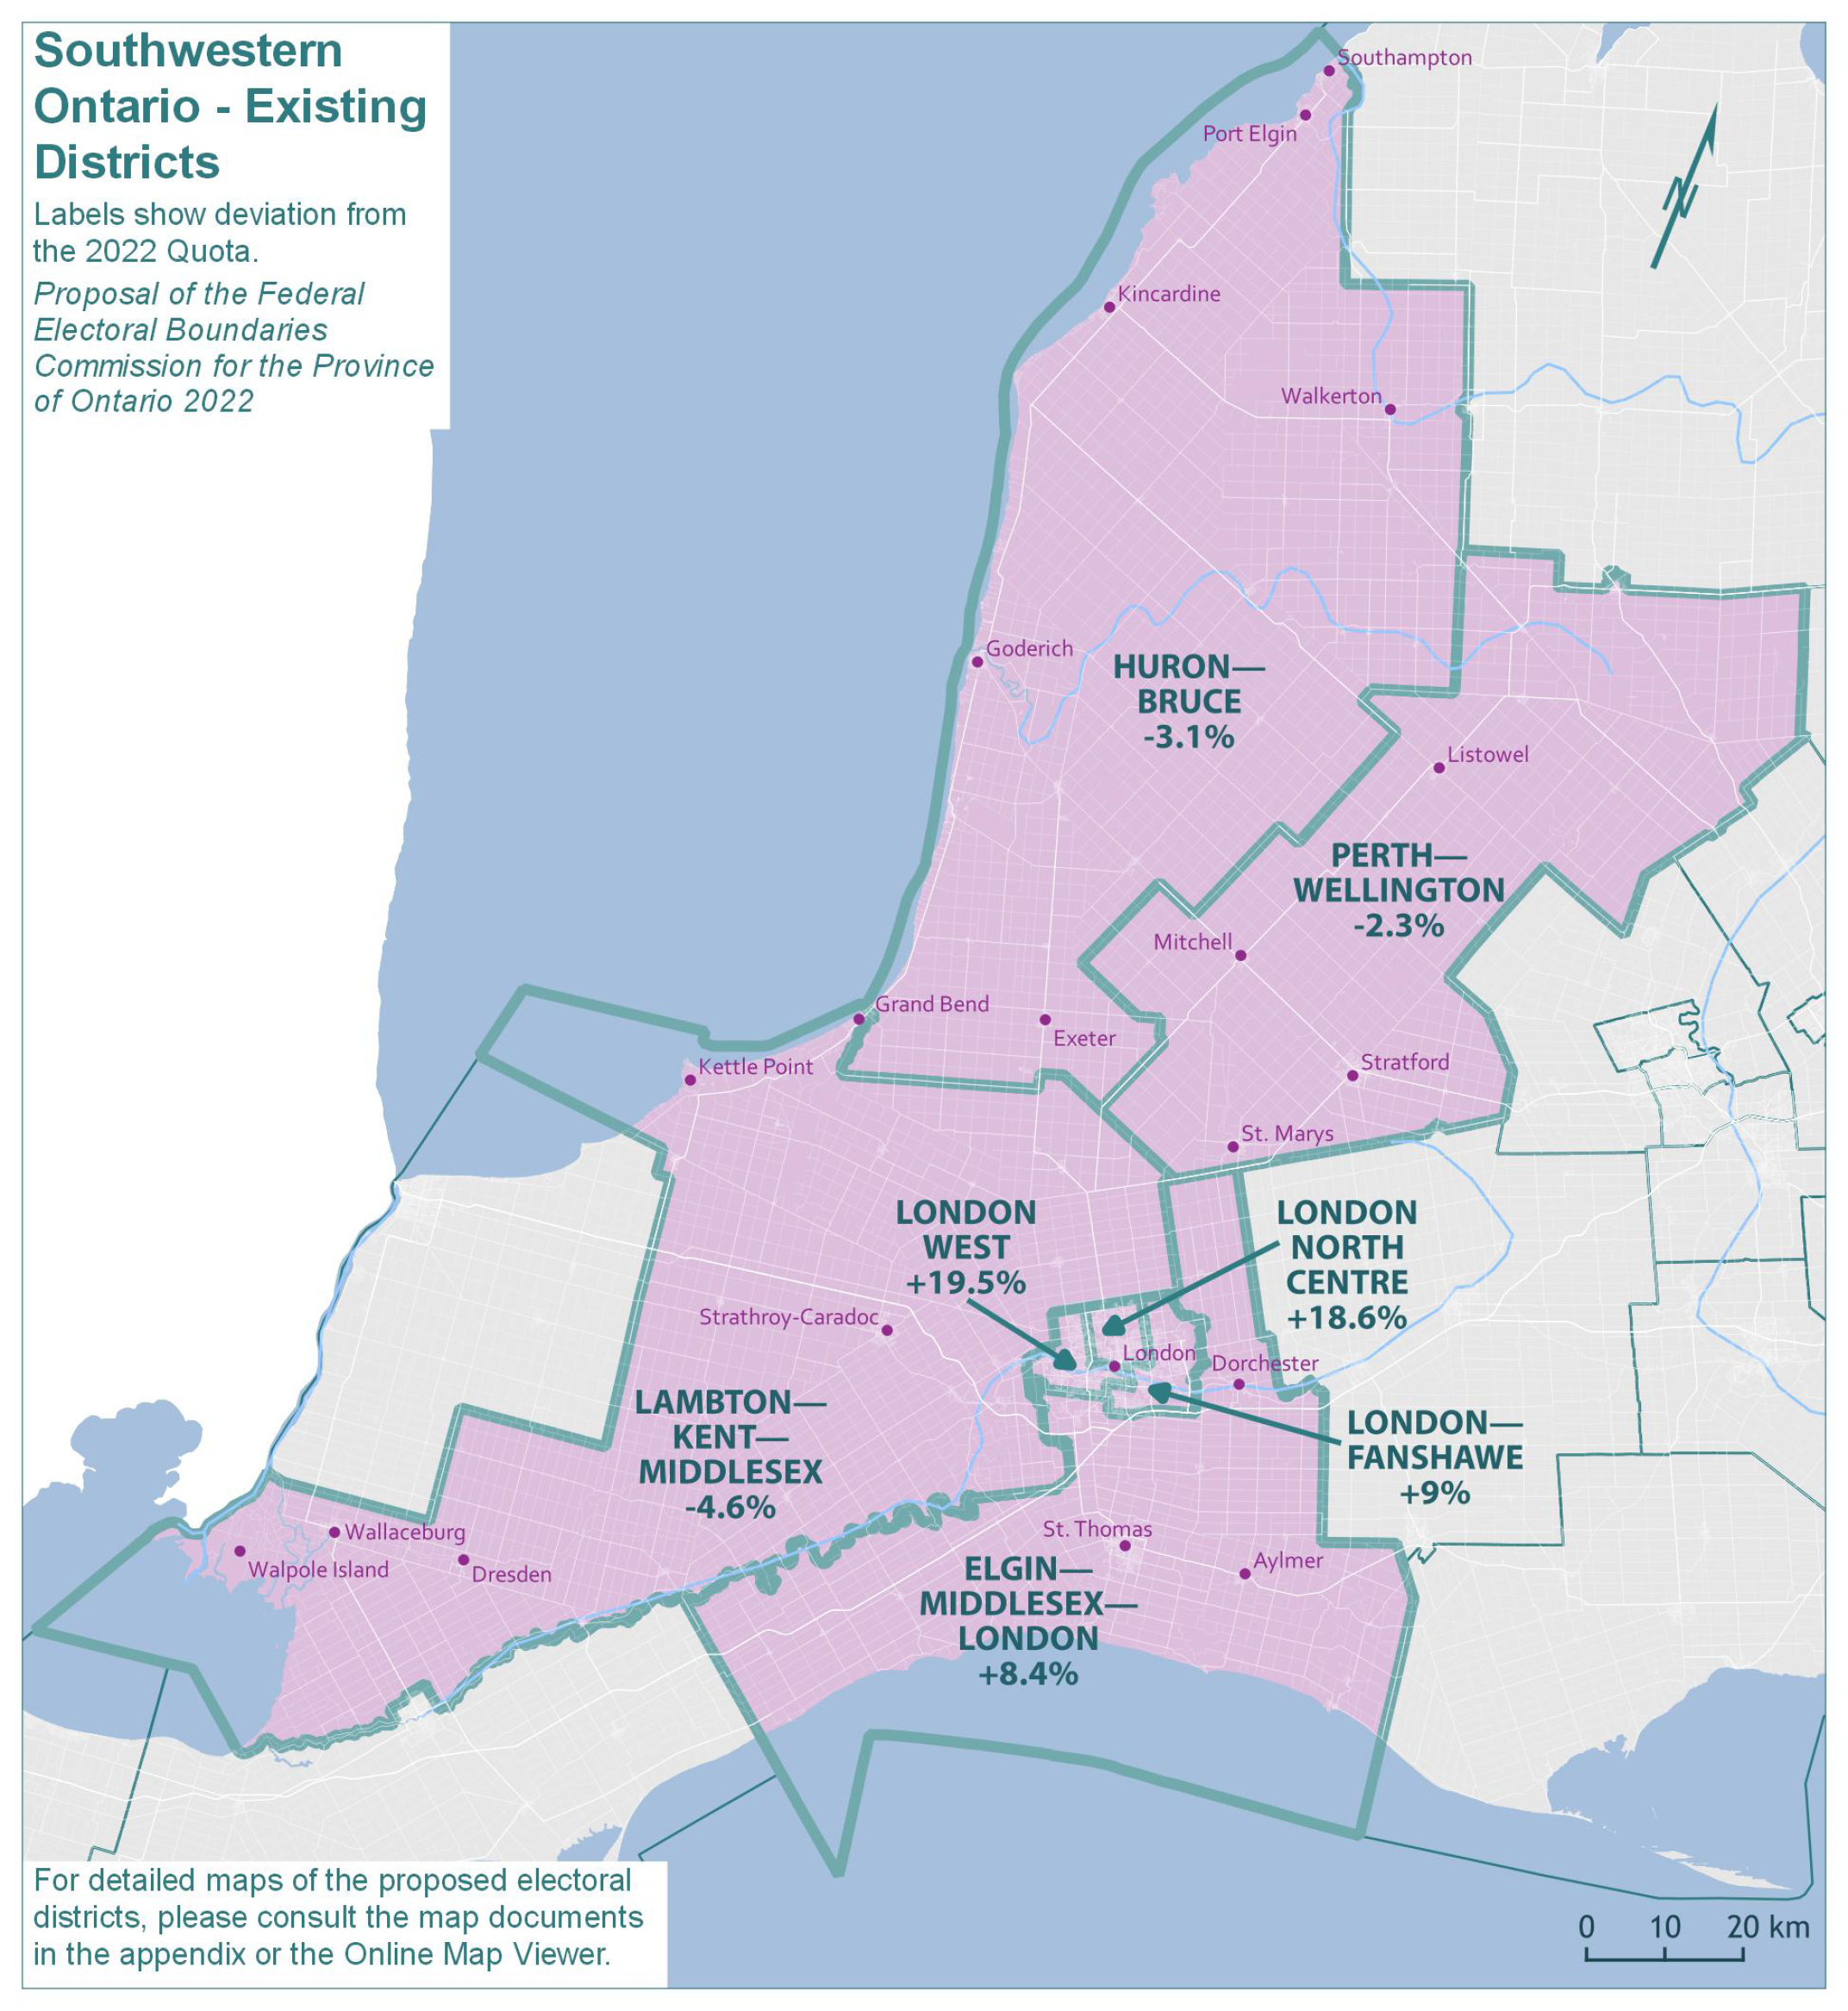
Southwestern Ontario
The population of Southwestern Ontario grew by 11.1%, from 782,285 in 2011 to 869,137 in 2021. The remainder of Ontario grew by 10.6% in the same period.
The existing seven electoral districts in this geographic piece would have an average 2021 population of 124,162 and an average deviation of 6.5% from the Quota. The absolute range between the least and most populous districts would be 24.1 percentage points. The populations and deviations from the Quota for the existing electoral districts are shown in Table 14A.
| Electoral Districts | Population — 2011 | Deviation from Quota — 2012 | Population — 2021 | Deviation from Quota — 2022 |
|---|---|---|---|---|
| Elgin—Middlesex—London | 110,109 | 3.67% | 126,428 | 8.44% |
| Huron—Bruce | 104,842 | -1.29% | 112,929 | -3.14% |
| Lambton—Kent—Middlesex | 105,919 | -0.28% | 111,242 | -4.59% |
| London—Fanshawe | 119,334 | 12.35% | 127,068 | 8.99% |
| London North Centre | 118,079 | 11.17% | 138,255 | 18.58% |
| London West | 119,090 | 12.12% | 139,305 | 19.48% |
| Perth—Wellington | 104,912 | -1.23% | 113,910 | -2.30% |
| Average | 111,755 | 5.22% | 124,162 | 6.49% |
| Range (most populous to least populous) | 14,492 | 13.64 pp | 28,063 | 24.07 pp |
pp = percentage points
The Commission noted that the three existing and largely urban districts within the City of London are underrepresented with populations that are 9%, 18.6% and 19.5% above the Quota. Consequently, considerable redrawing was required. Recognizing the urban growth in all directions, the boundaries of these three districts are reconfigured to better balance populations with adjacent and more rural districts.
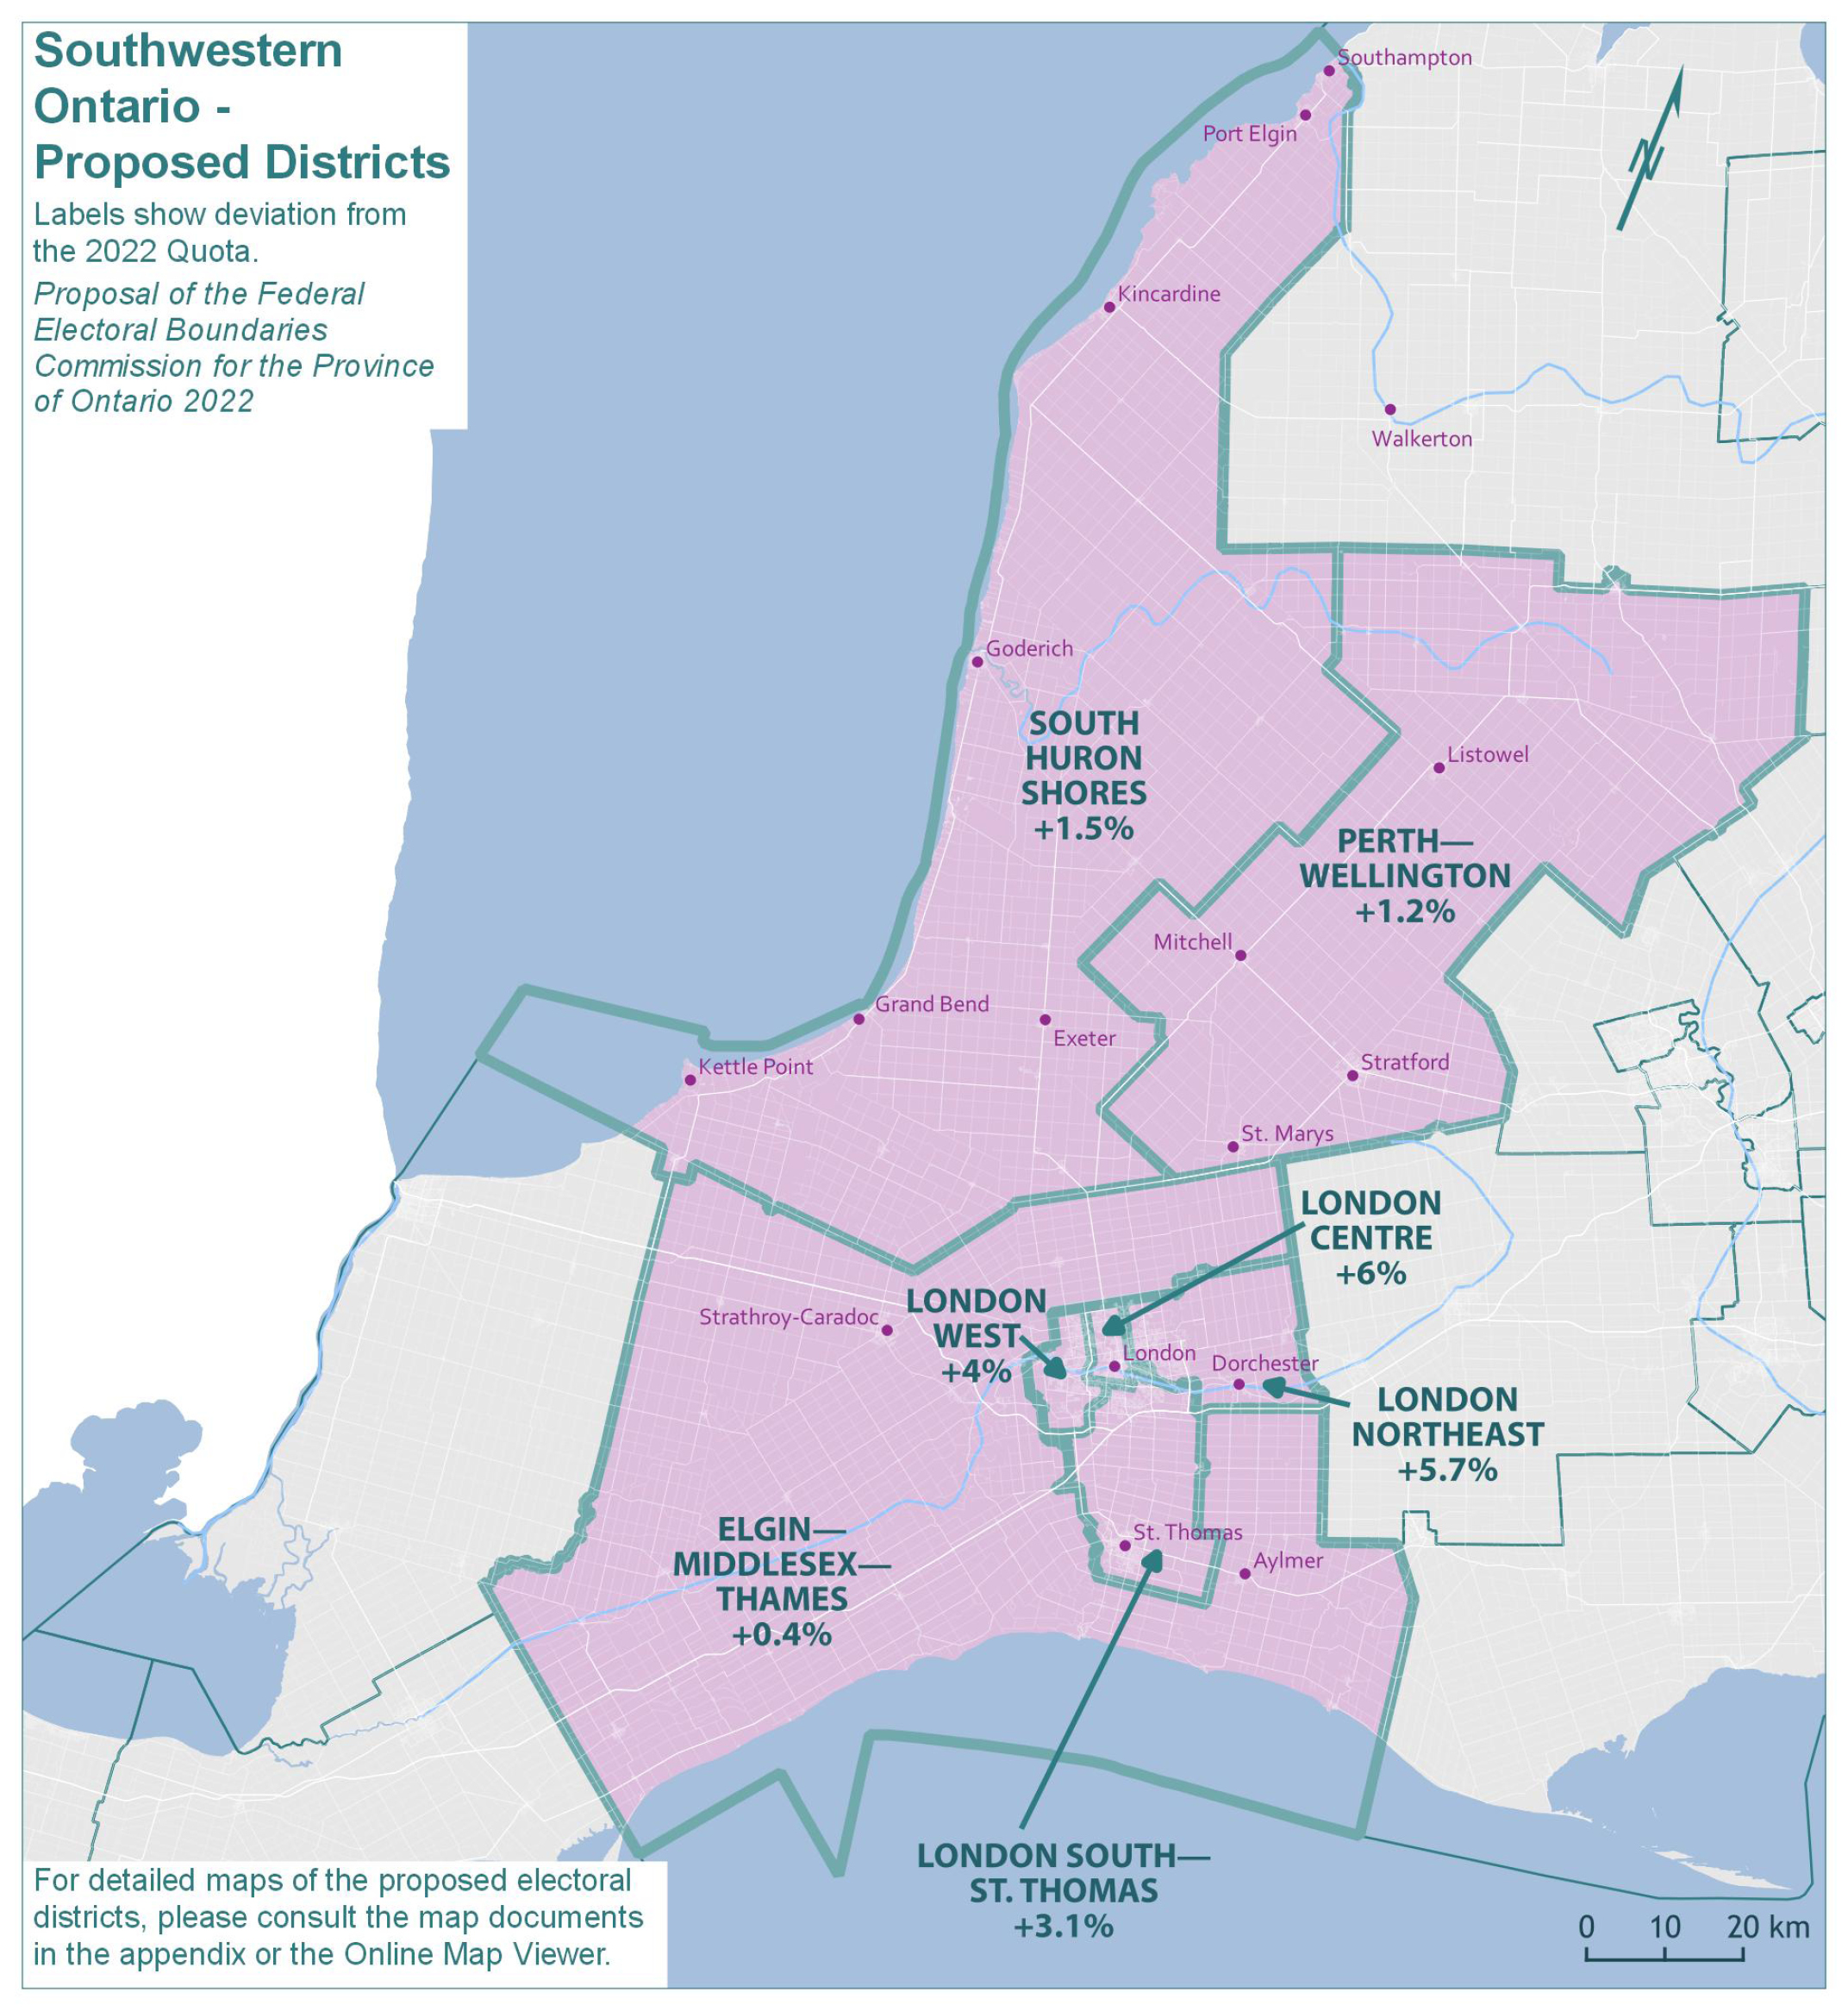
Recognizing the development in the southern part of the City of London and the northern part of the City of St. Thomas, these areas are both included in the proposed district of LONDON SOUTH—ST. THOMAS.
In the more northern part of the City of London, the boundaries of LONDON WEST and the newly named LONDON CENTRE (the existing district of London North Centre) are modestly changed. The boundaries of the existing district of London—Fanshawe are shifted to the east, and this district is renamed LONDON NORTHEAST.
In the southern portion of this geographic piece, the newly named ELGIN—MIDDLESEX—THAMES extends from Kent Bridge Road (County Road 15) in Chatham-Kent at its western edge and wraps around the City of London along the east. This district comprises portions of the existing districts of Elgin—Middlesex—London and Lambton—Kent—Middlesex.
In the northern portion of this geographic piece, the districts of PERTH—WELLINGTON and the newly named SOUTH HURON SHORES (the existing district of Huron—Bruce) are largely unchanged.
Many of the districts in this piece are renamed to better describe their locations and reflect their communities of interest.
The new deviations from the Quota in the proposed redistribution plan are shown in Table 14B.
| Electoral Districts | Population — 2021 | Deviation from Quota — 2022 |
|---|---|---|
| Elgin—Middlesex—Thames | 117,082 | 0.42% |
| London Centre | 123,531 | 5.95% |
| London Northeast | 123,241 | 5.70% |
| London South—St. Thomas | 120,208 | 3.10% |
| London West | 121,199 | 3.95% |
| Perth—Wellington | 117,974 | 1.19% |
| South Huron Shores | 118,316 | 1.48% |
| Average | 120,222 | 3.11% |
| Range (most populous to least populous) | 6,449 | 5.53 pp |
pp = percentage points
Southernmost Ontario
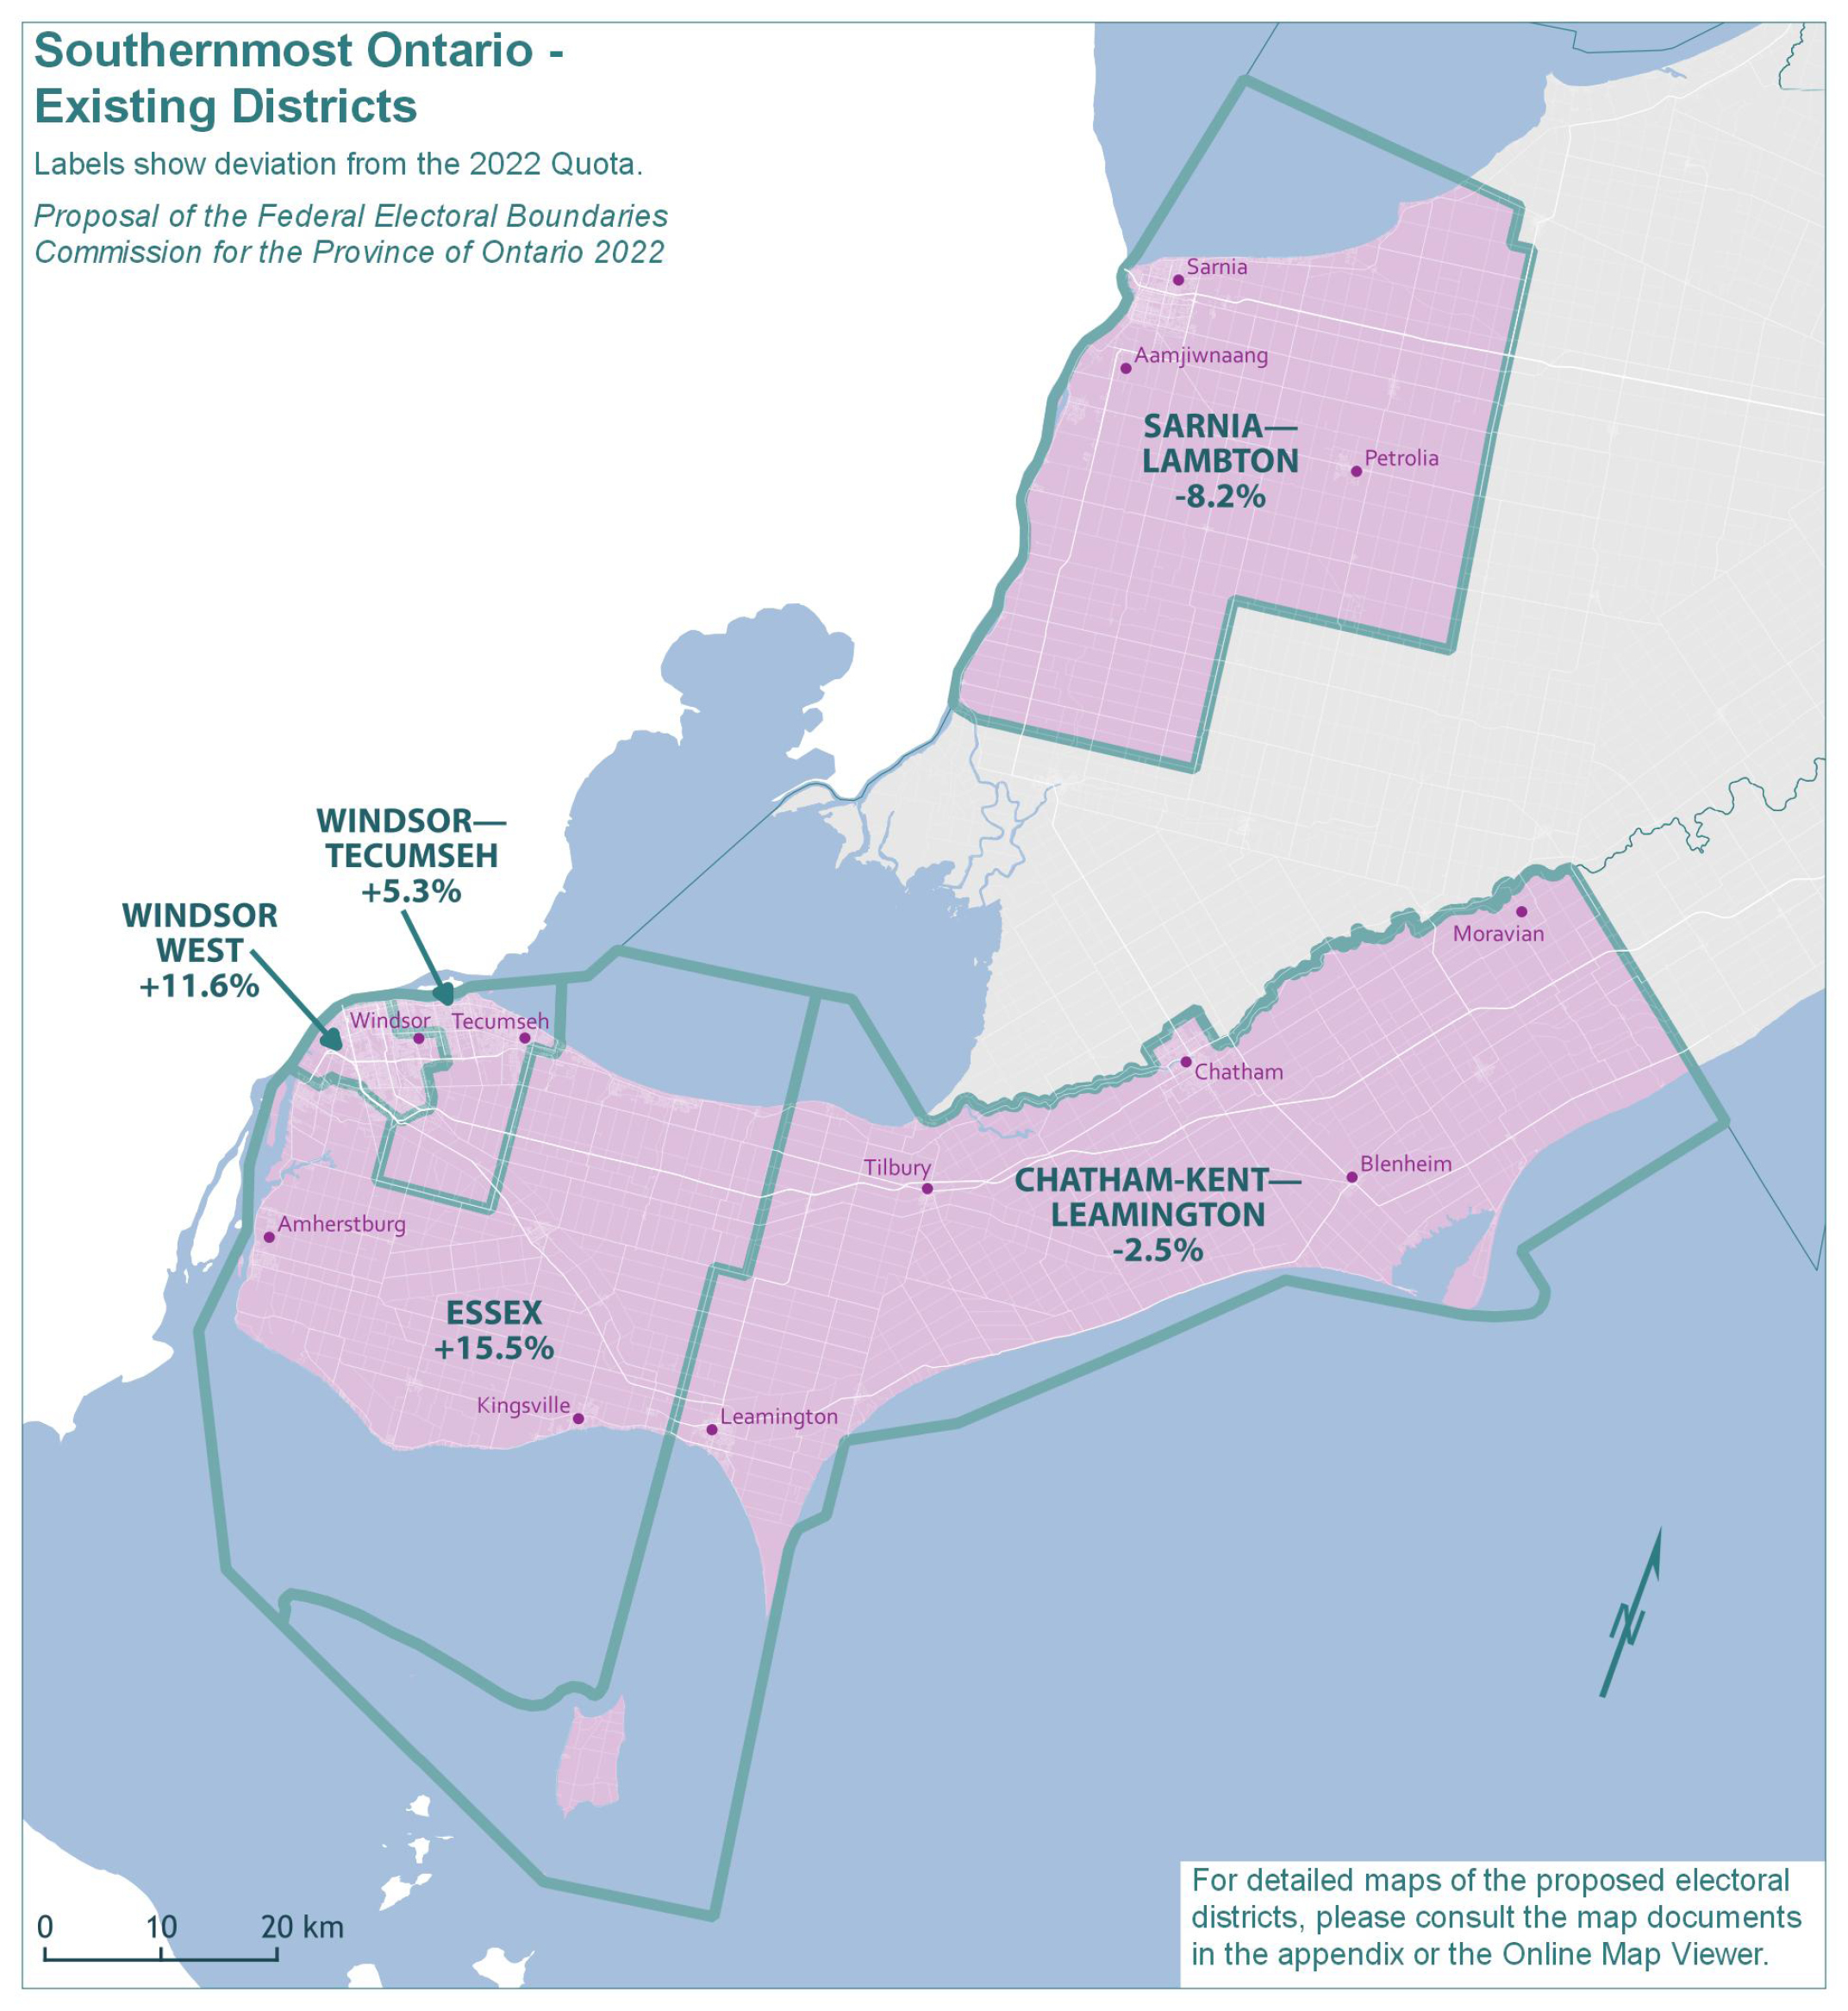
The population of the southernmost part of Ontario grew by 6.1%, from 573,137 in 2011 to 608,347 in 2021. The remainder of Ontario grew by 10.9% in the same period.
The existing five electoral districts in this geographic piece would have an average 2021 population of 121,669 and an average deviation of 4.4% above the Quota. As indicated by the deviation range (23.7 percentage points), there are substantial disparities in the population size of districts. The populations and deviations from the Quota for the existing electoral districts are shown in Table 15A.
| Electoral Districts | Population — 2011 | Deviation from Quota — 2012 | Population — 2021 | Deviation from Quota — 2022 |
|---|---|---|---|---|
| Chatham-Kent—Leamington | 111,866 | 5.32% | 113,654 | -2.52% |
| Essex | 120,477 | 13.43% | 134,656 | 15.50% |
| Sarnia—Lambton | 106,293 | 0.07% | 107,077 | -8.16% |
| Windsor—Tecumseh | 115,528 | 8.77% | 122,798 | 5.32% |
| Windsor West | 118,973 | 12.01% | 130,162 | 11.64% |
| Average | 114,627 | 7.92% | 121,669 | 4.36% |
| Range (most populous to least populous) | 14,184 | 13.36 pp | 27,579 | 23.66 pp |
pp = percentage points
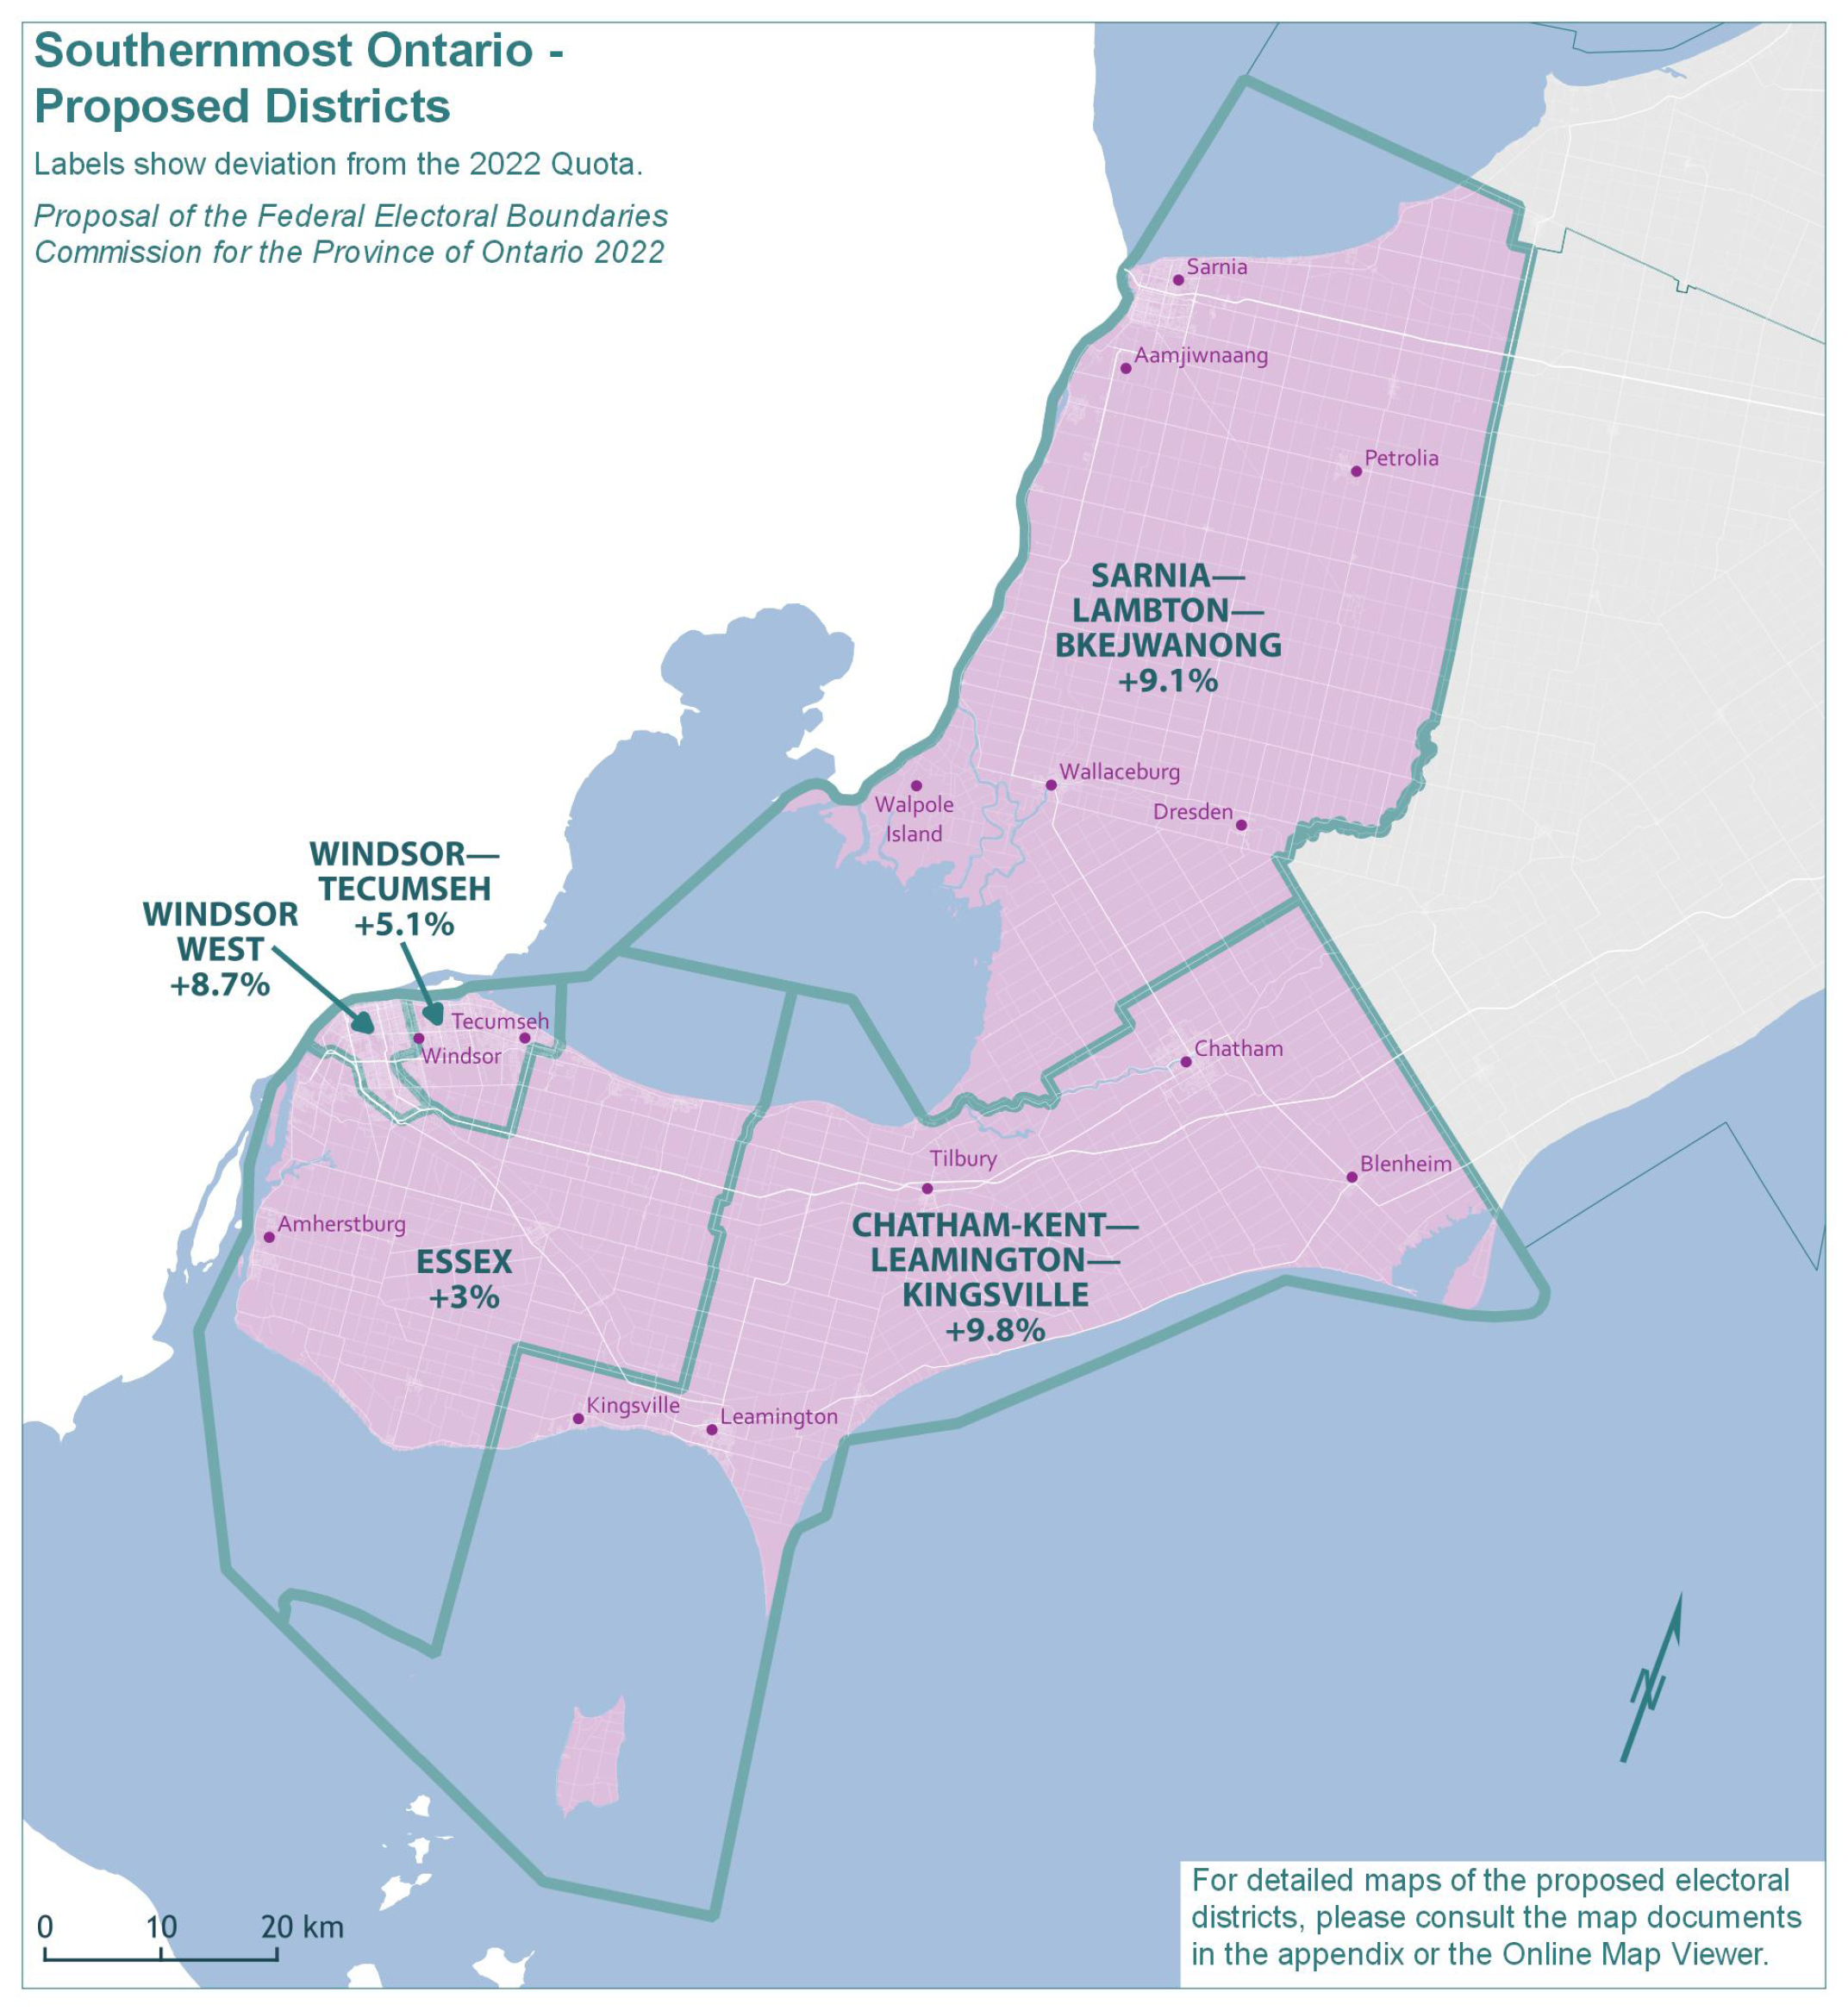
In this area, the Commission aimed to reduce the significant population disparities among districts. This necessitates shifting the boundary of ESSEX westward to reduce its population size. The community of Kingsville is incorporated into the proposed district of CHATHAM-KENT—LEAMINGTON—KINGSVILLE. The communities of Wallaceburg and Dresden and the Walpole Island First Nation are added to the proposed district of SARNIA—LAMBTON—BKEJWANONG. The boundaries of the proposed districts of WINDSOR WEST and WINDSOR—TECUMSEH have been adjusted to balance population equality.
The proposed boundary reconfiguration reduces the range of deviations in this area to seven percentage points. The proposed districts remain manageable in geographic size and respect as much as possible historical patterns.
The new population counts and deviations from the Quota in the proposed redistribution plan are shown in Table 15B.
| Electoral Districts | Population — 2021 | Deviation from Quota — 2022 |
|---|---|---|
| Chatham-Kent—Leamington—Kingsville | 128,045 | 9.83% |
| Essex | 120,132 | 3.04% |
| Sarnia—Lambton—Bkejwanong | 127,200 | 9.10% |
| Windsor—Tecumseh | 122,533 | 5.10% |
| Windsor West | 126,695 | 8.67% |
| Average | 124,921 | 7.15% |
| Range (most populous to least populous) | 7,913 | 6.79 pp |
pp = percentage points
Process for Public Consultation
Public consultation
Before drafting the proposed redistribution plan, the Commission welcomed public input.
Written submissions were received from interested parties, which were very helpful in the preparation of the proposal.
The Commission’s proposed redistribution plan is publicly available on the Commission’s website (redistribution2022.ca).
There is an opportunity for further public comment by written submissions or representation at the virtual and in-person meetings planned pursuant to the proposed schedule below.
The Commission looks forward to hearing from all interested parties in relation to boundaries and/or names of proposed districts either in person, virtually or in writing.
How to make a submission
The Electoral Boundaries Readjustment Act requires that parties wishing to make representations to the Commission give notice in writing to the Secretary of the Commission.
A Public Hearing Participation Form is available at redistribution2022.ca and is the form of notice to be completed by those who wish to make oral representations.
The Commission has set Sunday, September 25, 2022, as the date by which the Public Hearing Participation Form is to be filed.
The Public Hearing Participation Form must state the name and address of the person who seeks to make the representation and concisely indicate the nature of the representation and the interest of the person.
The Public Hearing Participation Form, or alternatively written submissions (for those who only wish to make a submission in writing), may be filed by email or by mail to: on@redecoupage-federal-redistribution.ca
Ms. Paula Puddy
Commission Secretary
Federal Electoral Boundaries Commission for Ontario
PO Box 37018 Southdale
London, Ontario N6E 3T3
Schedule of public meetings
The Commission has scheduled in-person hearings in areas where significant changes to districts are proposed.
The Commission noted the vastness of the province (the second largest in Canada), the recent extensive use of remote hearings, the public’s ability to utilize and access remote meeting technology in their homes or community facilities, the efficiency of remote hearings, and the potential for restrictions on in-person meetings in light of the pandemic.
As a result, the Commission has also scheduled many opportunities for participation in a virtual hearing.
The Commission reiterates that a submission may be made in writing as an alternative to appearing at an in-person or virtual hearing.
| Location | Place of hearing | Date of hearing | Time of hearing |
|---|---|---|---|
| Virtual hearing | Central Ontario; Northern GTA; Eastern GTA; and Central East Ontario The link will be provided to participants. |
Monday, September 26, 2022 | 6:30 p.m. |
| Virtual hearing | Hamilton and Niagara; South Central Ontario; Southwestern Ontario; and Southernmost Ontario The link will be provided to participants. |
Tuesday, September 27, 2022 | 6:30 p.m. |
| Virtual hearing | Halton, Guelph, and Wellington; Brampton, Caledon, and Dufferin; and Mississauga The link will be provided to participants. |
Wednesday, September 28, 2022 | 6:30 p.m. |
| Virtual hearing | City of Toronto The link will be provided to participants. |
Thursday, September 29, 2022 | 6:30 p.m. |
| Sioux Lookout | The Forest Inn & Conference Centre 11 May Street |
Monday, October 3, 2022 | 6:30 p.m. |
| Kenora | Douglas Family Art Centre–The Muse 224 Main Street South |
Tuesday, October 4, 2022 | 6:30 p.m. |
| Timmins | The Senator Hotel 14 Mountjoy Street South |
Tuesday, October 11, 2022 | 6:30 p.m. |
| Milton | FirstOntario Arts Centre Milton 1010 Main Street East |
Wednesday, October 12, 2022 | 6:30 p.m. |
| Brampton | Peel Art Gallery, Museum and Archives, 9 Wellington Street East |
Thursday, October 13, 2022 | 6:30 p.m. |
| Whitchurch-Stouffville | The Whitchurch-Stouffville Museum & Community Centre 14732 Woodbine Avenue |
Monday, October 17, 2022 | 6:30 p.m. |
| Scarborough | Scarborough Civic Centre Committee Rooms 1 & 2 150 Borough Drive |
Tuesday, October 18, 2022 | 6:30 p.m. |
| Toronto | Beeton Hall, Toronto Reference Library 789 Yonge Street |
Wednesday, October 19, 2022 | 6:30 p.m. |
| Ottawa | Rotunda, Canadian Museum of Nature 240 McLeod Street |
Thursday, October 20, 2022 | 6:30 p.m. |
| St. Catharines | Pond Inlet, Mackenzie Chown Complex, Brock University 1812 Sir Isaac Brock Way |
Friday, October 21, 2022 | 6:30 p.m. |
| Virtual hearing | Northern Ontario; Eastern Ontario; and Ottawa The link will be provided to participants. |
Wednesday, October 26, 2022 | 6:30 p.m. |
| London | Ivey Spencer Leadership Centre 551 Windermere Road |
Friday, October 28, 2022 | 6:30 p.m. |
| Virtual Hearing | Ontario Open Virtual Hearing The link will be provided to participants. |
Saturday, October 29, 2022 | 12 p.m. |
We ask that all interested parties pay particular attention to the rules set out herein and check the Commission website (redistribution2022.ca) regularly for any changes of schedule.
Note: If there are no expressions of interest to make a submission at any particular hearing, the Commission may cancel the hearing. In such instances, the Commission will post a notice of postponement or cancellation on its website.
The Commission’s rules of procedure for public submissions
Pursuant to the Electoral Boundaries Readjustment Act, the Commission has established the following rules to regulate its proceedings and the conduct including public hearings.
- All persons wishing to make an oral submission must complete the Public Hearing Participation Form described above.
- In the interest of transparency, the Commission will make public all written submissions that it receives in response to the proposed redistribution plan. These will be published on the Commission’s website and will include the person’s name and the date of the submission. The home address of those making written submissions will not be shared.
- Two members of the Commission shall constitute a quorum for the holding of a hearing.
- If a quorum cannot be present at a hearing, the Commission may postpone that hearing to a later date.
- If the Commission cannot complete hearing representations within the time allowed, the Commission may adjourn the hearing to a later date at the same place or may—taking into account the convenience of persons whose representations have not been heard or have been only partly heard—adjourn the hearing elsewhere or to a virtual hearing.
- At each hearing the Commission shall decide the order in which the representations are heard.
- The Commission may restrict the time available for oral representations if necessary to meet timing constraints.
- Only one person shall be heard in the presentation of any single representation, including a representation on behalf of an association or group, unless the Commission, in its discretion, decides otherwise.
- The link to the virtual public hearing is not public and may only be shared with participants/observers who have registered with the Commission and with members of the media.
- A moderator will manage the agenda, the speaking time and microphones of the participants.
- The use of a headset by presenters at a virtual public hearing is recommended.
The process following the public hearings
Following the receipt of submissions, the Commission will finalize its redistribution plan and submit a final report to the Chief Electoral Officer of Canada.
The report will be delivered to the House of Commons for consideration.
After Parliament has considered the report, it is returned to the Commission with any objections, the minutes, and evidence of the House of Commons committee. The Commission will consider any objections and then prepare a final report.
While the Commission will consider all submissions, the Commission is an independent body and, as such, makes all final decisions.
The Commission will deliver a final certified copy of its report to the Chief Electoral Officer of Canada.
Once the Chief Electoral Officer of Canada has received the final reports of all Commissions, a representation order is prepared describing and naming the electoral districts established by all Commissions.
The Governor in Council announces the new boundaries in a proclamation published in the Canada Gazette.
New boundaries can first be used in an election if at least seven months have passed between the date that the representation order was proclaimed and the date that Parliament is dissolved for a general election.
APPENDIX – Maps, Proposed Boundaries and Names of Electoral Districts
There shall be in the Province of Ontario one hundred and twenty-two (122) electoral districts, named and described as follows, each of which shall return one member. In the following descriptions:
- (a) references to “roads,” “electric power transmission lines,” “water features” and “railways” signify their centre lines unless otherwise described;
- (b) any reference to a “township” signifies a township that has its own local administration;
- (c) any reference to a “geographic township” signifies a township without local administration;
- (d) all cities, municipalities, towns, villages, Indian reserves and First Nations territories lying within the perimeter of the electoral district are included unless otherwise described;
- (e) wherever a word or expression is used to denote a territorial division, such word or expression shall indicate the territorial division as it existed or was delimited on the first day of January 2021;
- (f) the translation of the terms “street,” “avenue,” and “boulevard” follows Treasury Board standards; the translation of all other public thoroughfare designations is based on commonly used terms but has no official recognition; and
- (g) all coordinates are in reference to the North American Datum of 1983 (NAD 83).
The population figure of each electoral district is derived from the 2021 decennial census.
Ajax
(Population: 126,666)
(Map 9)
Consists of the Town of Ajax.
Algonquin—Renfrew—Pembroke
(Population: 116,900)
(Maps 2 and 4)
Consists of:
- (a) the City of Pembroke;
- (b) that part of the City of Ottawa described as follows: commencing at the intersection of the westerly limit of said city and Highway 417 (Trans-Canada Highway); thence generally southeasterly along said highway to Vaughan Side Road; thence northeasterly along Vaughan Side Road, Donald B. Munro Drive and Craig’s Side Road to Carp Road; thence northwesterly along said road to Holland Hill Road; thence northeasterly along said road and its northeasterly production to the southwesterly production of Murphy Side Road; thence northeasterly along Murphy Side Road, Constance Lake Road, its intermittent production, Berry Side Road and its northeasterly production to the interprovincial boundary between Ontario and Quebec; thence generally westerly along said boundary to the northerly limit of said city; thence southerly and southwesterly along the westerly limit of said city to the point of commencement;
- (c) the towns of Arnprior, Deep River, Laurentian Hills, Petawawa and Renfrew;
- (d) the townships of Admaston/Bromley; Bonnechere Valley; Brudenell, Lyndoch and Raglan; Head, Clara and Maria; Horton; Killaloe, Hagarty and Richards; Laurentian Valley; Madawaska Valley; McNab/Braeside; North Algona Wilberforce; South Algonquin; and Whitewater Region;
- (e) that part of the Unorganized Area of Nipissing (South Part) described as follows: commencing at the intersection of the southerly limit of said unorganized area and the northerly limit of Nightingale Geographic Township; thence easterly along said limit and the northerly limit of Airy Geographic Township to the westerly limit of Preston Geographic Township; thence northerly along said limit and the westerly limit of the Geographic Township of Dickson to the southerly limit of Anglin Geographic Township; thence westerly and northerly along the southerly and westerly limits of said geographic township to the northerly limit of Freswick Geographic Township; thence westerly along said limit to the westerly limit of Lister Geographic Township; thence northerly along said limit and easterly along the northerly limit of said geographic township to the westerly limit of Deacon Geographic Township; thence northerly along said limit to the northerly limit of said unorganized area; thence generally easterly, southeasterly, generally southwesterly and northwesterly along the northerly, easterly, southerly and westerly limits of said unorganized area to the point of commencement; and
- (f) the Pikwàkanagàn (Golden Lake) Indian Reserve No. 39.
Aurora—Oak Ridges—Richmond Hill
(Population: 114,676)
(Map 22)
Consists of:
- (a) that part of the City of Richmond Hill lying northerly of a line described as follows: commencing at the intersection of the easterly limit of said city and Elgin Mills Road East; thence westerly along said road and along Elgin Mills Road West to the westerly limit of said city; and
- (b) that part of the Town of Aurora lying southerly and westerly of a line described as follows: commencing at the intersection of the easterly limit of said town and Wellington Street East; thence westerly along said street to Yonge Street; thence northerly along said street to Orchard Heights Boulevard; thence generally westerly along said boulevard to the westerly limit of said town.
Barrie—Innisfil
(Population: 120,378)
(Map 3)
Consists of:
- (a) that part of the City of Barrie lying southerly of Dunlop Street West, Tiffin Street and its northeasterly production to Kempenfelt Bay; and
- (b) the Town of Innisfil.
Barrie—Springwater—Oro-Medonte
(Population: 115,495)
(Map 3)
Consists of:
- (a) that part of the City of Barrie lying northerly of Dunlop Street West, Tiffin Street and its northeasterly production to Kempenfelt Bay; and
- (b) the townships of Oro-Medonte and Springwater.
Bay of Quinte
(Population: 116,016)
(Map 4)
Consists of:
- (a) the City of Quinte West;
- (b) that part of the City of Belleville lying southerly of Highway 401 (Macdonald-Cartier Freeway); and
- (c) the County of Prince Edward.
Bayview—Finch
(Population: 110,908)
(Map 20)
Consists of that part of the City of Toronto described as follows: commencing at the intersection of the northerly limit of said city and German Mills Creek; thence generally southwesterly along said creek to the Don River (East Branch); thence generally southerly along said river to Highway 401 (Macdonald-Cartier Freeway, Ontario 401 Express); thence generally southwesterly along said highway to Yonge Street; thence northerly along said street to Finch Avenue West; thence westerly along said avenue to Grantbrook Street; thence northerly along said street to Drewry Avenue; thence westerly along said avenue to Chelmsford Avenue; thence generally northerly along said avenue to Greenwin Village Road; thence westerly along said road to Village Gate; thence northerly along said road to the northerly limit of said city; thence easterly along said limit to the point of commencement.
Black Creek
(Population: 117,740)
(Map 20)
Consists of that part of the City of Toronto described as follows: commencing at the intersection of the northerly limit of said city and Keele Street; thence southerly along said street to Highway 401 (Macdonald-Cartier Freeway, Ontario 401 Express); thence westerly along said highway to Weston Road; thence generally northerly along said road to Fenmar Drive; thence northwesterly along said drive to the northerly limit of said city; thence easterly along said limit to the point of commencement.
Bowmanville—Oshawa North
(Population: 123,036)
(Map 9)
Consists of:
- (a) that part of the City of Oshawa described as follows: commencing at the intersection of the easterly limit of said city and Taunton Road East; thence westerly along said road and Taunton Road West to Oshawa Creek; thence generally northwesterly along said creek to Highway 407; thence generally easterly along said highway to the easterly limit of said city; thence southerly along said limit to the point of commencement; and
- (b) that part of the Municipality of Clarington described as follows: commencing at the intersection of Highway 407 and Darlington-Clarke Townline Road; thence southeasterly along said road and its production to Highway 401 (Macdonald-Cartier Freeway, Highway of Heroes); thence easterly along said highway to Cobbledick Road; thence southeasterly along said road to Waterfront Trail at approximate latitude 43°54′09″N and longitude 78°36′24″W; thence southerly in a straight line to the shoreline of Lake Ontario at approximate latitude 43°53′50″N and longitude 78°36′15″W; thence generally westerly along said shoreline to the westerly limit of said municipality; thence northerly along said limit to Highway 407; thence generally easterly along said highway to the point of commencement.
Brampton Centre
(Population: 114,422)
(Map 17)
Consists of that part of the City of Brampton described as follows: commencing at the intersection of Bovaird Drive East and Dixie Road; thence southeasterly along said road to Queen Street East; thence southwesterly along said street to Kennedy Road South; thence southeasterly along said road to Clarence Street; thence southwesterly along said street to Main Street South; thence southeasterly along said street to Harold Street; thence generally southwesterly along said street to McLaughlin Road South; thence northwesterly along said road to the former Orangeville-Brampton Railway; thence southerly and southwesterly along said railway to Chinguacousy Road; thence northwesterly along said road to Bovaird Drive West; thence northeasterly along said drive to the point of commencement.
Brampton—Chinguacousy
(Population: 113,201)
(Map 17)
Consists of that part of the City of Brampton described as follows: commencing at the intersection of Bovaird Drive East and Airport Road; thence southeasterly along said road to Queen Street East; thence southwesterly along said street to Dixie Road; thence northwesterly along said road to Bovaird Drive East; thence southwesterly along said drive to Highway 410; thence northwesterly along said highway to the northwesterly limit of said city; thence northeasterly along said limit to Torbram Road; thence southeasterly along said road to Sandalwood Parkway East; thence northeasterly and easterly along said parkway to Mountainash Road; thence southeasterly along said road to Bovaird Drive East; thence northeasterly along said drive to the point of commencement.
Brampton—Mayfield West
(Population: 112,994)
(Map 17)
Consists of:
- (a) that part of the City of Brampton described as follows: commencing at the intersection of the northwesterly limit of said city and Highway 410; thence southeasterly along said highway to Bovaird Drive East; thence southwesterly along said drive and Bovaird Drive West to Chinguacousy Road; thence northwesterly along said road to Fairhill Avenue; thence southwesterly and southerly along said avenue to Brisdale Drive; thence generally northwesterly along said drive to the northwesterly limit of said city; thence generally northeasterly along said limit to the point of commencement; and
- (b) that part of the Town of Caledon lying southeasterly and southwesterly of a line described as follows: commencing at the intersection of the southwesterly limit of said town and King Street; thence generally northeasterly along said street to The Gore Road; thence southeasterly along said road to the southeasterly limit of said town.
Brampton North
(Population: 112,082)
(Map 17)
Consists of that part of the City of Brampton lying northerly of a line described as follows: commencing at the intersection of the northeasterly limit of said city and Queen Street East; thence westerly and southwesterly along said street to Airport Road; thence northwesterly along said road to Bovaird Drive East; thence southwesterly along said drive to Mountainash Road; thence generally northwesterly along said road to Sandalwood Parkway East; thence westerly and southwesterly along said parkway to Torbram Road; thence northwesterly along said road to the northwesterly limit of said city.
Brampton Southeast
(Population: 114,952)
(Map 17)
Consists of that part of the City of Brampton described as follows: commencing at the intersection of the northeasterly limit of said city and Queen Street East; thence westerly and southwesterly along said street to Kennedy Road South; thence southeasterly along said road to Clarence Street; thence southwesterly along said street to Main Street South; thence southeasterly along said street to Harold Street; thence generally southwesterly along said street to McLaughlin Road South; thence northwesterly along said road to the former Orangeville-Brampton Railway; thence generally southerly and generally southeasterly along said railway to the southeasterly limit of said city; thence generally northeasterly and northwesterly along the southeasterly and northeasterly limits of said city to the point of commencement.
Brampton Southwest
(Population: 110,855)
(Map 17)
Consists of that part of the City of Brampton lying southwesterly of a line described as follows: commencing at the intersection of the northwesterly limit of said city and Brisdale Drive; thence generally southeasterly along said drive to Fairhill Avenue; thence generally northerly along said avenue to Chinguacousy Road; thence southeasterly along said road to the former Orangeville-Brampton Railway; thence generally southerly and southeasterly along said railway to the southeasterly limit of said city.
Brantford
(Population: 118,167)
(Map 7)
Consists of:
- (a) the City of Brantford; and
- (b) the County of Brant, excluding those parts described as follows:
- (i) that part lying southwesterly, westerly and northerly of a line described as follows: commencing at the intersection of the southerly limit of said county and Indian Line Road; thence westerly along said road and its production to Highway 24 at approximate latitude 43°04′28″N and longitude 80°21′35″W; thence generally northerly along said highway and along Rest Acres Road to Powerline Road; thence easterly along said road and along its easterly production to a point at approximate latitude 43°10′26″N and longitude 80°21′11″W on the westerly limit of the City of Brantford; thence generally northeasterly along the northerly and westerly limits of said city to a point on its northerly limit at approximate latitude 43°11′59″N and longitude 80°18′48″W; thence northerly along Clarke Road, McPherson School Road and Princess Street to East River Road; thence northeasterly along said road to Glen Morris Road West; thence northwesterly and westerly along said road to West River Road North; thence generally northeasterly along said road to the northerly limit of said county;
- (ii) that part lying northerly and easterly of a line described as follows: commencing at the intersection of the southerly limit of said county and Highway 54; thence northwesterly along said highway to Painter Road; thence northerly along said road to the limit of said county; and
- (c) that part of the Six Nations Indian Reserve No. 40 lying northwesterly of the Grand River.
Bruce—Grey—Owen Sound
(Population: 118,588)
(Map 2)
Consists of:
- (a) the City of Owen Sound;
- (b) the towns of Hanover and South Bruce Peninsula;
- (c) the municipalities of Arran-Elderslie, Brockton, Meaford, Northern Bruce Peninsula, South Bruce and West Grey;
- (d) the townships of Chatsworth, Georgina Bluffs and South Gate; and
- (e) the Indian reserves of Chief’s Point No. 28, Neyaashiinigmiing No. 27, and Saugeen No. 29.
Burlington Lakeshore
(Population: 116,984)
(Map 12)
Consists of that part of the City of Burlington described as follows: commencing at the intersection of the northwesterly limit of said city and King Road; thence generally southeasterly along said road to Highway 403; thence northeasterly along said highway to Highway 407; thence northerly along said highway to Dundas Street; thence northeasterly along said street to Appleby Line; thence southeasterly along Appleby Line and its southeasterly production to the southeasterly limit of said city; thence generally southwesterly, westerly, northwesterly, generally southwesterly, northwesterly and northeasterly along the southeasterly, southerly, southwesterly and northwesterly limits of said city to the point of commencement.
Burlington—Milton West
(Population: 114,218)
(Map 12)
Consists of:
- (a) that part of the City of Burlington described as follows: commencing at the intersection of the northwesterly limit of said city and King Road; thence generally southeasterly along said road to Highway 403; thence northeasterly along said highway to Highway 407; thence northerly along said highway to Dundas Street; thence northeasterly along said street to the northeasterly limit of said city; thence generally northwesterly, southwesterly and southeasterly along the northeasterly, northwesterly and southwesterly limits of said city to the point of commencement;
- (b) that part of the Town of Halton Hills lying southeasterly of 15 Side Road and southwesterly of Regional Road 25;
- (c) the Town of Milton, excluding those parts described as follows:
- (i) that part lying northwesterly of 15 Side Road; and
- (ii) that part lying northeasterly of a line described as follows: commencing at the intersection of Lower Base Line West and Regional Road 25; thence northwesterly along said road to Britannia Road; thence northeasterly along said road to Thompson Road South; thence northwesterly along said road to Main Street East; thence southwesterly along said street to Ontario Street North; thence northwesterly along said street to Steeles Avenue East; thence southwesterly along said avenue to Martin Street; thence northwesterly along said street and Regional Road 25 to the northerly limit of said town (5 Side Road); and
- (d) that part of the Town of Oakville lying southwesterly of Regional Road 25 and northwesterly of Dundas Street West.
Cambridge
(Population: 122,099)
(Map 8)
Consists of that part of the City of Cambridge lying southerly and easterly of a line described as follows: commencing at a point on the easterly limit of said city at approximate latitude 43°27′16″N and longitude 80°17′52″W; thence southerly in a straight line to the Speed River; thence generally southwesterly along said river (running southerly of Speed Island) to Highway 401 (Macdonald-Cartier Freeway); thence westerly and southwesterly along said highway to the westerly limit of said city and Shantz Hill Road; thence southeasterly along said road and its production to the Speed River; thence generally southerly along said river to the Grand River and the westerly limit of said city at approximate latitude 43°23′13″N and longitude 80°22′01″W.
Carleton
(Population: 119,737)
(Map 16)
Consists of that part of the City of Ottawa described as follows: commencing at the intersection of Conroy Road and Hunt Club Road; thence northeasterly along Hunt Club Road to Highway 417 (Trans-Canada Highway); thence easterly along said highway to Leitrim Road; thence southwesterly along said road to Farmers Way; thence generally easterly and southeasterly along said road to Thunder Road; thence southwesterly along said road to Farmers Way; thence southeasterly along said road to Mitch Owens Road; thence southwesterly along said road to 9th Line Road; thence southeasterly along said road to Marionville Road and the southeasterly limit of the City of Ottawa; thence generally southwesterly and northwesterly along the southeasterly and southwesterly limits of said city to Highway 7; thence generally northeasterly along said highway to Hazeldean Road; thence northeasterly along said road to Terry Fox Drive; thence southeasterly along said drive and northeasterly along Hope Side Road to Old Richmond Road; thence northerly along said road to West Hunt Club Road; thence northeasterly along said road to Highway 416 (Veterans Memorial Highway); thence generally southerly and southeasterly along said highway to Barnsdale Road; thence northeasterly along said road to the Rideau River (westerly of Long Island); thence northerly along said river (westerly of Nicolls Island) to Hunt Club Road; thence easterly along said road to Riverside Drive; thence generally southerly and southeasterly along said drive and Limebank Road to Leitrim Road; thence northeasterly along said road to the O-Train light-rail line (Trillium Rail Corridor); thence northwesterly along said light-rail line to Lester Road; thence northeasterly along said road and Davidson Road to Conroy Road; thence northwesterly along said road to the point of commencement.
Chatham-Kent—Leamington—Kingsville
(Population: 128,045)
(Map 3)
Consists of:
- (a) that part of the Town of Kingsville lying southerly of Road 4 East and Road 4 West;
- (b) the Municipality of Leamington;
- (c) that part of the Municipality of Chatham-Kent lying southerly of a line described as follows: commencing at the intersection of the westerly limit of said municipality and the Thames River; thence generally northeasterly along said river to the southeasterly production of Jacob Road; thence northwesterly along said production and said road to Pain Court Line; thence northeasterly along Pain Court Line to Bear Line Road; thence northwesterly along said road to St Andrews Line; thence northeasterly along St Andrews Line and Eberts Line to Kent Bridge Road; thence southeasterly along said road and its southeasterly production to the southeasterly limit of said municipality;
- (d) that part of the Municipality of Lakeshore lying easterly of a line described as follows: commencing at the southerly limit of said municipality and County Road 31; thence northerly along said road to South Middle Road; thence westerly along said road to County Road 31; thence generally northerly along said road to County Road 42; thence easterly along said road to County Road 31; thence generally northerly along said road to County Road 2; thence easterly along said road to the Ruscom River; thence generally northerly along said river to the northerly limit of said municipality (Lake St. Clair); and
- (e) the Township of Pelee.
Cochrane—Timmins—Timiskaming
(Population: 107,092)
(Map 1)
Consists of:
- (a) the cities of Temiskaming Shores and Timmins;
- (b) the towns of Cobalt, Cochrane, Englehart, Hearst, Iroquois Falls, Kapuskasing, Kirkland Lake, Latchford and Smooth Rock Falls;
- (c) the Municipality of Charlton and Dack;
- (d) the townships of Armstrong, Black River-Matheson, Brethour, Casey, Chamberlain, Coleman, Evanturel, Fauquier-Strickland, Gauthier, Harley, Harris, Hilliard, Hornepayne, Hudson, James, Kerns, Larder Lake, Matachewan, Mattice-Val Côté, McGarry, Moonbeam, Opasatika and Val Rita-Harty;
- (e) the Village of Thornloe;
- (f) the unorganized areas of Cochrane (South East Part), Cochrane (South West Part), Timiskaming (East Part) and Timiskaming (West Part);
- (g) that part of the Unorganized Area of Algoma (North Part) lying northerly of a line described as follows: commencing at a point on the westerly limit of said unorganized area at approximate latitude 49°00′05″N and longitude 85°19′59″W; thence easterly in a straight line to the easterly limit of said unorganized area;
- (h) that part of the Unorganized Area of Cochrane (North Part) lying southerly of a line described as follows: commencing at a point on the westerly limit of said unorganized area at approximate latitude 50°30′02″N and longitude 86°32′55″W; thence easterly in a straight line to a point on the easterly limit of said unorganized area at approximate latitude 50°30′00″N and longitude 79°31′05″W;
- (i) that part of the Unorganized Area of Sudbury (North Part) lying northerly and easterly of a line described as follows: commencing at the intersection of the northerly limit of said unorganized area and the westerly limit of Oates Geographic Township; thence southerly along said limit and along the westerly limits of the geographic townships of Foleyet, Ivanhoe, Silk, Whigham, Coppell, Dore, Garnet, Fawn and Hong Kong to the northerly limit of Singapore Geographic Township; thence easterly along said limit to the westerly limit of Ceylon Geographic Township; thence southerly along said limit and along the westerly limit of Faust Geographic Township to its southerly limit; thence easterly along said limit and along the southerly limit of Hall Geographic Township to its easterly limit; thence northerly along the westerly limit of Elizabeth Geographic Township to its northerly limit; thence easterly along said limit and along the northerly limit of Margaret Geographic Township to its easterly limit; thence southerly along said limit to the northerly limit of Lillie Geographic Township; thence easterly along said limit and along the northerly limits of the geographic townships of Chalet, Paudash and Brebeuf to the westerly limit of Hennessy Geographic Township; thence southerly along said limit to the northerly limit of Blewett Geographic Township; thence easterly along said limit along the northerly limit of Beulah Geographic Township to its easterly limit; thence southerly along said limit to the northerly limit of Hodgetts Geographic Township; thence easterly along said limit and along the northerly limit of Unwin Geographic Township to the westerly limit of said unorganized area; and
- (j) the Indian reserves of Abitibi No. 70, Constance Lake No. 92, Flying Post No. 73, Matachewan No. 72, Mattagami No. 71 and New Post No. 69A.
Collingwood—Blue Mountains
(Population: 116,511)
(Map 3)
Consists of:
- (a) the towns of Collingwood, The Blue Mountains and Wasaga Beach;
- (b) the Municipality of Grey Highlands;
- (c) the townships of Clearview, Essa and Mulmur; and
- (d) that part of the Township of Adjala-Tosorontio lying northerly of Highway 89 and Young Street.
Davenport
(Population: 116,728)
(Map 20)
Consists of that part of the City of Toronto described as follows: commencing at the intersection of Eglinton Avenue West and Oakwood Avenue; thence southerly along said avenue to St. Clair Avenue West; thence westerly along said avenue to Oakwood Avenue; thence southerly along said avenue to Davenport Road; thence westerly along said road to Dovercourt Road; thence southerly along said road to the Canadian Pacific Railway; thence easterly along said railway to Ossington Avenue; thence southerly along said avenue to Queen Street West; thence westerly along said street to the GO Transit rail line; thence generally northwesterly along said rail line to Black Creek Drive; thence northwesterly along said drive to Eglinton Avenue West; thence generally easterly along said avenue to the point of commencement.
Don Valley East
(Population: 115,456)
(Map 20)
Consists of that part of the City of Toronto described as follows: commencing at the intersection of Highway 401 (Macdonald-Cartier Freeway, Ontario 401 Express) and Warden Avenue; thence southerly along said avenue to Eglinton Avenue East; thence generally westerly along said avenue to Don Valley Parkway; thence generally southerly along said parkway to Taylor Creek; thence westerly along said creek to the Don River East Branch; thence generally westerly along said river to the Don River West Branch; thence generally northwesterly along said branch to Wilket Creek; thence generally northwesterly along said creek to its northwesterly production at approximate latitude 43°44′55″N and longitude 79°22′56″W; thence northwesterly in a straight line to York Mills Road; thence easterly along said road to Leslie Street; thence northerly along said street to Highway 401 (Macdonald-Cartier Freeway, Ontario 401 Express); thence easterly along said highway to the point of commencement.
Don Valley North
(Population: 113,537)
(Map 20)
Consists of that part of the City of Toronto described as follows: commencing at the intersection of Steeles Avenue East and Pharmacy Avenue; thence southerly along Pharmacy Avenue to the electric power transmission line; thence easterly along said transmission line to Warden Avenue; thence southerly along said avenue to Highway 401 (Macdonald-Cartier Freeway, Ontario 401 Express); thence westerly along said highway to the Don River (East Branch); thence generally northerly along said river to German Mills Creek; thence generally northeasterly along said creek to Steeles Avenue East and the northerly limit of said city; thence easterly along said limit to the point of commencement.
Don Valley West
(Population: 114,229)
(Map 20)
Consists of that part of the City of Toronto described as follows: commencing at the intersection of Highway 401 (Macdonald-Cartier Freeway, Ontario 401 Express) and Leslie Street; thence southerly along said street to York Mills Road; thence westerly along said road to approximate latitude 43°44′56″N and longitude 79°22′58″W; thence southeasterly in a straight line to the northwesterly production of Wilket Creek; thence generally southeasterly and generally southwesterly along said creek to the Don River West Branch; thence generally southeasterly along said river to the Don River; thence generally southwesterly along said river to Millwood Road; thence northwesterly and westerly along said road to Laird Drive; thence northerly along Laird Drive to Eglinton Avenue East; thence westerly along said avenue and Eglinton Avenue West to Avenue Road; thence generally northerly along said road to Highway 401 (Macdonald-Cartier Freeway, Ontario 401 Express); thence northeasterly and easterly along said highway to the point of commencement.
Dufferin—Caledon
(Population: 119,767)
(Map 3)
Consists of:
- (a) the towns of Grand Valley, Mono, Orangeville and Shelburne;
- (b) that part of the Town of Caledon lying northwesterly and northeasterly of a line described as follows: commencing at the intersection of the southwesterly limit of said town and King Street; thence generally northeasterly along said street to The Gore Road; thence southeasterly along said road to the southeasterly limit of said town;
- (c) the townships of Amaranth and Melancthon; and
- (d) that part of the Township of Adjala-Tosorontio lying southerly of Highway 89 and Young Street.
Eglinton—Lawrence
(Population: 116,139)
(Map 20)
Consists of that part of the City of Toronto described as follows: commencing at the intersection of Highway 401 (Macdonald-Cartier Freeway, Ontario 401 Express) and Avenue Road; thence southerly along said road to Eglinton Avenue West; thence westerly along said avenue to Black Creek Drive; thence generally northerly along said drive and Highway 400 to Highway 401 (Macdonald-Cartier Freeway, Ontario 401 Express); thence easterly and northeasterly along said highway to the point of commencement.
Elgin—Middlesex—Thames
(Population: 117,082)
(Map 3)
Consists of:
- (a) the Town of Aylmer;
- (b) the municipalities of Bayham, Brooke-Alvinston, Dutton/Dunwich, Middlesex Centre, Southwest Middlesex, Strathroy-Caradoc and West Elgin;
- (c) that part of the Municipality of Central Elgin lying southerly of John Wise Line;
- (d) that part of the Municipality of Chatham-Kent described as follows: commencing at the intersection of the northerly limit of said municipality and the Sydenham River; thence generally southwesterly along said river to Dawn Mills Road; thence southerly along said road to Base Line; thence westerly along said line to Kent Bridge Road; thence southeasterly along said road and its production to the southerly limit of said municipality; thence northeasterly, northwesterly, northerly and westerly along the southerly, easterly and northerly limits of said municipality to the point of commencement;
- (e) those parts of the Municipality of Thames Centre described as follows:
- (i) that part lying northerly of a line described as follows: commencing at the intersection of the westerly limit of said municipality and Thorndale Road; thence northeasterly along said road to Nissouri Road; thence northwesterly along said road to approximate latitude 43°06′21″N and longitude 81°09′32″W; thence northeasterly in a straight line to Fairview Road at approximate latitude 43°06′39″N and longitude 81°08′35″W; thence southeasterly along said road to Thorndale Road; thence northeasterly along said road to the easterly limit of said municipality;
- (ii) that part lying southerly and easterly of a line described as follows: commencing at the intersection of the easterly limit of said municipality and Highway 401 (Macdonald-Cartier Freeway); thence westerly along said highway to Westchester Bourne road; thence southerly along said road to the southerly limit of said municipality;
- (f) the townships of Adelaide-Metcalfe, Malahide and Warwick;
- (g) that part of the Township of Dawn-Euphemia lying easterly of a line described as follows: commencing at the intersection of the northerly limit of said township and Forest Road; thence southerly along said road and its southerly production to the Sydenham River; thence generally southerly along said river to the southerly limit of said township;
- (h) the Township of Southwold, excluding the part lying easterly of Sunset Road;
- (i) that part of the Township of Zorra lying northerly and westerly of a line described as follows: commencing at the intersection of the westerly limit of said township and Road 84; thence northeasterly along said road to 23rd Line; thence northwesterly along said line to the northerly limit of said township;
- (j) the Village of Newbury; and
- (k) the Indian reserves of Chippewa of the Thames First Nation No. 42, Moravian No. 47, Munsee-Delaware Nation No. 1 and Oneida No. 41.
Essex
(Population: 120,132)
(Map 3)
Consists of:
- (a) that part of the City of Windsor lying southerly and westerly of a line described as follows: commencing at a point on the westerly limit of said city at approximate latitude 42°16′37″N and longitude 83°06′12″W; thence easterly along the westerly production of Broadway Street and along said street to Ojibway Parkway; thence northerly and easterly along said parkway and E.C. Row Expressway to Huron Church Road; thence southeasterly along said road to the southerly limit of said city;
- (b) the towns of Amherstburg, Essex and LaSalle;
- (c) that part of the Town of Kingsville lying northerly of Road 4 East and Road 4 West;
- (d) that part of the Town of Tecumseh lying southerly of Highway 401 (Macdonald-Cartier Freeway); and
- (e) that part of the Municipality of Lakeshore lying westerly of a line described as follows: commencing at the intersection of the southerly limit of said municipality and County Road 31; thence northerly along said road to South Middle Road; thence westerly along said road to County Road 31; thence generally northerly along said road to County Road 42; thence easterly along said road to County Road 31; thence generally northerly along said road to County Road 2; thence easterly along said road to the Ruscom River; thence generally northerly along said river to its mouth at Lake St. Clair; thence north in a straight line to the northerly limit of said municipality.
Etobicoke Centre
(Population: 120,157)
(Map 20)
Consists of that part of the City of Toronto described as follows: commencing at the intersection of Highway 401 (Macdonald-Cartier Freeway, Ontario 401 Express) and Islington Avenue; thence southeasterly along said avenue to Bloor Street West; thence generally southwesterly along said street and Dundas Street West to the westerly limit of said city (shoreline of Etobicoke Creek); thence generally northwesterly, northeasterly and northwesterly along the southwesterly and westerly limits of said city to Highway 401 (Macdonald-Cartier Freeway, Ontario 401 Express); thence generally northeasterly along said highway to the point of commencement.
Etobicoke Lakeshore
(Population: 114,714)
(Map 20)
Consists of that part of the City of Toronto described as follows: commencing at the intersection of Bloor Street West and the Humber River; thence generally southeasterly along said river to its southeasterly production; thence southeasterly in a straight line to the southerly limit of said city (Lake Ontario); thence southwesterly and generally northwesterly along the southerly and westerly limits of said city to Dundas Street West; thence easterly and northeasterly along said street to Bloor Street West; thence generally northeasterly along said street to the point of commencement.
Etobicoke North
(Population: 121,107)
(Map 20)
Consists of that part of the City of Toronto described as follows: commencing at the intersection of the northerly limit of said city and Fenmar Drive; thence southeasterly and easterly along said drive to Weston Road; thence generally southerly along said road to Highway 401 (Macdonald-Cartier Freeway, Ontario 401 Express); thence generally southwesterly along said highway to the westerly limit of said city; thence northwesterly and easterly along the westerly and northerly limits of said city to the point of commencement.
Flamborough—Glanbrook
(Population: 114,701)
(Map 13)
Consists of that part of the City of Hamilton described as follows: commencing at the intersection of the easterly limit of said city on the Niagara Escarpment; thence generally westerly along said escarpment to Redhill Creek; thence westerly along said creek to Mountain Brow Boulevard; thence southerly along said boulevard to Arbour Road; thence generally southerly along said road, its intermittent production, Anchor Road and its southerly production to the intersection of Rymal Road East and Glover Road; thence southerly along Glover Road to an electric power transmission line at approximate latitude 43°10′51″N and longitude 79°49′42″W; thence westerly and southwesterly along said electric power transmission line to Trinity Road South; thence generally northerly along said road, Highway 52 South and Highway 52 North to the Canadian National Railway; thence generally northeasterly along said railway to Highway 403 (Alexander Graham Bell Parkway); thence northeasterly along said highway to the northeasterly limit of said city; thence northwesterly, generally northeasterly, northwesterly, generally southwesterly, generally southeasterly and generally northerly along the northerly, westerly, southerly and easterly limits of said city to the point of commencement.
Gananoque—Brockville—Prescott
(Population: 113,266)
(Map 4)
Consists of:
- (a) the City of Brockville;
- (b) that part of the City of Kingston lying northerly of Highway 401 (Macdonald-Cartier Freeway);
- (c) the towns of Gananoque and Prescott;
- (d) the Municipality of North Grenville;
- (e) the townships of Athens, Augusta, Edwardsburgh/Cardinal, Front of Yonge, and Leeds and the Thousand Islands;
- (f) that part of the Township of Elizabethtown-Kitley lying southeasterly of a line described as follows: commencing at the intersection of the southwesterly limit of said township and Kitley-Elizabethtown Townline Road; thence northeasterly along said road and its northeasterly production to the northeasterly limit of said township; and
- (g) that part of the Township of South Frontenac lying southerly of the southerly limit of Bedford Geographic Township.
Georgetown—Milton East
(Population: 118,559)
(Map 12)
Consists of:
- (a) that part of the Town of Halton Hills described as follows: commencing at the intersection of the southeasterly limit of said town (5 Side Road) and Regional Road 25; thence generally northwesterly along said road to 15 Side Road; thence generally northeasterly along said road to Trafalgar Road; thence northwesterly along said road and along Highway 7 to 22 Side Road; thence northeasterly along said road and its intermittent production to the northeasterly limit of said town; thence southeasterly and generally southwesterly along the northeasterly and southeasterly limits of said city to the point of commencement;
- (b) that part of the Town of Milton lying northeasterly of a line described as follows: commencing at the intersection of the southeasterly limit of said town (Burnhamthorpe Road West) and Regional Road 25; thence northwesterly along said road to Britannia Road; thence northeasterly along said road to Thompson Road South; thence northwesterly along said road to Main Street East; thence southwesterly along said street to Ontario Street North; thence northwesterly along said street to Steeles Avenue East; thence southwesterly along said avenue to Martin Street; thence northwesterly along said street and along Regional Road 25 to the northerly limit of said town (5 Side Road); and
- (c) that part of the Town of Oakville lying northwesterly of Dundas Street West, Dundas Street East and northeasterly of Regional Road 25.
Guelph
(Population: 118,686)
(Map 11)
Consists of that part of the City of Guelph lying northerly and westerly of a line described as follows: commencing at the intersection of Fife Road and Wellington Street West; thence northerly along said street to Hanlon Parkway; thence easterly and southeasterly along said parkway to Hanlon’s Creek; thence generally northeasterly along said creek to approximate latitude 43°30′46″N and longitude 80°12′13″W; thence northeasterly in a straight line to Gordon Street; thence northeasterly along Arkell Road to the easterly limit of said city.
Haldimand—Norfolk—Six Nations
(Population: 122,813)
(Map 3)
Consists of:
- (a) the City of Norfolk County;
- (b) that part of the City of Haldimand County lying westerly of a line described as follows: commencing at the intersection of the northeasterly limit of said city and Caistorville Road; thence southerly along said road to Haldimand-Dunnville Townline Road; thence generally southerly along said road and its intermittent productions to Lake Erie and the southerly limit of said city;
- (c) the Town of Tillsonburg;
- (d) that part of the County of Brant lying northerly and easterly of a line described as follows: commencing at the intersection of the southerly limit of said county and Highway 54; thence northwesterly along said highway to Painter Road; thence northerly along said road to the limit of said county;
- (e) the New Credit Indian Reserve No. 40A; and
- (f) the Six Nations Indian Reserve No. 40, excluding that part lying northwesterly of the Grand River.
Haliburton—Kawartha Lakes—Brock
(Population: 120,254)
(Map 4)
Consists of:
- (a) the City of Kawartha Lakes;
- (b) the Municipality of Dysart et al;
- (c) that part of the Municipality of Highlands East lying westerly of a line described as follows: commencing at the intersection of the northwesterly limit of said municipality with Highway 118; thence generally southeasterly along said highway to County Road 503; thence generally southwesterly along said road to Buckhorn Road; thence generally southerly along said road to the southeasterly limit of said municipality;
- (d) the Municipality of Trent Lakes, excepting the islands of the Curve Lake Indian Reserve No. 35A;
- (e) the townships of Algonquin Highlands, Brock and Minden Hills; and
- (f) that part of the Township of Cavan Monaghan lying northerly of Highway 115 and westerly of Highway 7 (Trans-Canada Highway).
Hamilton Centre
(Population: 123,520)
(Map 13)
Consists of those parts of the City of Hamilton described as follows:
- (a) that part lying northerly and easterly of a line described as follows: commencing at the intersection of Red Hill Valley Parkway and the Niagara Escarpment; thence generally southwesterly, generally northerly and generally westerly along said escarpment to the electric power transmission line situated westerly of Chateau Court; thence northerly along said transmission line to Highway 403 (Alexander Graham Bell Parkway); thence generally northeasterly and generally northerly along said highway to the northeasterly limit of said city; and
- (b) that part lying westerly of a line described as follows: commencing at the intersection of Red Hill Valley Parkway and the Niagara Escarpment; thence generally northerly along said parkway to King Street East; thence northwesterly along said street to Walter Avenue South; thence northerly along said avenue and along Walter Avenue North to Barton Street East; thence westerly along said street to Strathearne Avenue; thence northerly along said street and its intermittent production to Pier 24 Gateway; thence easterly, northerly and northeasterly along said gateway to the northeasterly shoreline of Hamilton Harbour.
Hamilton Mountain
(Population: 115,634)
(Map 13)
Consists of that part of the City of Hamilton described as follows: commencing at the intersection of James Mountain Road and the Niagara Escarpment; thence generally easterly and generally southerly along said escarpment to Red Hill Creek; thence southwesterly along said creek to Mountain Brow Boulevard; thence southerly along said boulevard to Arbour Road; thence generally southerly along said road, its intermittent production, Anchor Road and its southerly production to the intersection of Rymal Road East and Glover Road; thence southerly along Glover Road to the electric power transmission line at approximate latitude 43°10′51″N and longitude 79°49′42″W; thence westerly along said transmission line to Garth Street; thence generally northerly along said street to Lincoln M. Alexander Parkway; thence easterly along said parkway to West 5th Street; thence northerly along said street and James Mountain Road to the point of commencement.
Hamilton—Stoney Creek—Grimsby Lakeshore
(Population: 121,709)
(Maps 3 and 13)
Consists of:
- (a) that part of the City of Hamilton lying northerly and easterly of a line described as follows: commencing at the intersection of the easterly limit of said city and the Niagara Escarpment; thence generally westerly along said escarpment to Red Hill Valley Parkway; thence generally northerly along said parkway to King Street East; thence northwesterly along said street to Walter Avenue South; thence northerly along said avenue and along Walter Avenue North to Barton Street East; thence westerly along said street to Strathearne Avenue; thence northerly along said street and its intermittent production to Pier 24 Gateway; thence easterly, northerly and northeasterly along said gateway to the northeasterly shoreline of Hamilton Harbour; thence generally northwesterly along said shoreline to the Burlington Canal; thence northeasterly along said canal to Lake Ontario; and
- (b) that part of the Town of Grimsby lying northerly of the Niagara Escarpment.
Hamilton West—Ancaster—Dundas
(Population: 120,551)
(Map 13)
Consists of that part of the City of Hamilton described as follows: commencing at the intersection of Highway 403 (Alexander Graham Bell Parkway) and the Canadian National Railway; thence generally southerly and generally southwesterly along said highway to the electric power transmission line at approximate latitude 43°14′48″N and longitude 79°55′55″W; thence southerly in a straight line to the Niagara Escarpment limit; thence generally easterly along said limit to James Mountain Road; thence generally southerly along said road and West 5th Road to Lincoln M. Alexander Parkway; thence westerly along said parkway to Garth Street; thence generally southerly along said street to the electric power transmission line at approximate latitude 43°12′05″N and longitude 79°54′54″W; thence westerly and southwesterly along said electric power transmission line to Trinity Road South; thence generally northerly along said road, Highway 52 South and Highway 52 North to the Canadian National Railway; thence generally northeasterly and easterly along said railway to the point of commencement.
Hastings—Lennox and Addington—Tyendinaga
(Population: 111,331)
(Map 4)
Consists of:
- (a) that part of the City of Belleville lying northerly of Highway 401 (Macdonald-Cartier Freeway);
- (b) the towns of Bancroft, Deseronto and Greater Napanee;
- (c) the municipalities of Centre Hastings, Hastings Highlands, Marmora and Lake and Tweed;
- (d) that part of the Municipality of Highlands East lying easterly of a line described as follows: commencing at the intersection of the northwesterly limit of said municipality with Highway 118; thence generally southeasterly along said highway to County Road 503; thence generally southwesterly along said road to Buckhorn Road; thence generally southerly along said road to the southerly limit of said municipality;
- (e) the townships of Addington Highlands, Carlow/Mayo, Faraday, Havelock-Belmont-Methuen, Limerick, Loyalist, Madoc, North Kawartha, Stirling-Rawdon, Stone Mills, Tudor and Cashel, Tyendinaga and Wollaston; and
- (f) Tyendinaga Mohawk Territory.
Humber
(Population: 122,220)
(Map 20)
Consists of that part of the City of Toronto described as follows: commencing at the intersection of Highway 401 (Macdonald-Cartier Freeway, Ontario 401 Express) and Highway 400; thence generally southeasterly and southerly along Highway 400 and Black Creek Drive to the Canadian Pacific Railway; thence southeasterly along said railway to St. Clair Avenue West; thence westerly along said avenue to Scarlett Road; thence southerly along said road to the Canadian Pacific Railway; thence westerly and southwesterly along said railway to the Humber River; thence easterly and generally southeasterly along said river to Bloor Street West; thence westerly along said street to Islington Avenue; thence northerly along said avenue to Highway 401 (Macdonald-Cartier Freeway, Ontario 401 Express); thence easterly along said highway to the point of commencement.
Kanata
(Population: 121,458)
(Map 16)
Consists of that part of the City of Ottawa described as follows: commencing at the intersection of Davidson’s Side Road and Carling Avenue; thence generally northeasterly along said avenue to Moodie Drive; thence southerly along said drive to Highway 417 (Trans-Canada Highway, Queensway); thence northeasterly along said highway to Highway 416 (Veterans Memorial Highway); thence southeasterly along said highway to West Hunt Club Road; thence southwesterly along said road to Old Richmond Road; thence southerly along said road to Hope Side Road; thence southwesterly along said road and generally northwesterly along Terry Fox Drive to Hazeldean Road; thence southwesterly along said road to Highway 7 (Trans-Canada Highway); thence northerly along said highway to Highway 417 (Trans-Canada Highway); thence generally northwesterly along said highway to Vaughan Side Road; thence northeasterly along said road, Donald B. Munro Drive and Craig’s Side Road to Carp Road; thence northwesterly along said road to Holland Hill Road; thence northeasterly along Holland Hill Road and its northeasterly production, Murphy Side Road, Constance Lake Road and its northeasterly production, Berry Side Road and its northeasterly production to the interprovincial boundary between Ontario and Quebec; thence southeasterly along said boundary to a point at approximate latitude 45°22′58″N and longitude 75°51′26″W; thence southerly in a straight line to the northwesterly end point of Davidson’s Side Road; thence southeasterly along said road to the point of commencement.
Kenora—Thunder Bay—Rainy River
(Population: 101,097)
(Map 1)
Consists of:
- (a) the cities of Dryden and Kenora;
- (b) that part of the City of Thunder Bay lying southerly of a line described as follows: commencing at the intersection of the westerly limit of said city and Arthur Street West; thence generally easterly along said street to Highway 61 (Thunder Bay Expressway); thence generally northerly along said highway to Neebing River; thence generally northeasterly along said river to McIntyre River; thence generally easterly along said river to the westerly shoreline of Lake Superior; thence easterly in a straight line and along the northerly limit of said city to its easterly limit at approximate latitude 48°23′58″N and longitude 89°02′41″W;
- (c) the towns of Atikokan, Fort Frances and Rainy River;
- (d) the Municipality of Neebing;
- (e) that part of the Municipality of Oliver Paipoonge lying southerly of a line described as follows: commencing at the intersection of the westerly limit of said municipality and Highway 11/17 (Trans-Canada Highway); thence generally southeasterly and easterly along said highway to Highway 130; thence easterly along said highway to Twin City Cross Road; thence generally easterly along Arthur Street and Arthur Street West to the easterly limit of said municipality;
- (f) the townships of Alberton, Chapple, Dawson, Emo, Gillies, Ignace, La Vallee, Lake of the Woods, Machin, Morley, O’Connor and Sioux Narrows-Nestor Falls;
- (g) that part of the Township of Conmee lying westerly of Highway 11/17 (Trans-Canada Highway);
- (h) the Unorganized Area of Rainy River;
- (i) that part of the Unorganized Area of Kenora lying southerly of a line described as follows: commencing at the intersection of the interprovincial boundary between Ontario and Manitoba with the Canadian National Railway at approximate latitude 49°53′12″N and longitude 95°09′10″W; thence generally northeasterly along said railway to approximate latitude 49°56′54″N and longitude 94°45′09″W (westerly of Camp Four Lake); thence southerly in a straight line to the northerly limit of Umbach Geographic Township; thence easterly along said limit to the westerly boundary of The Dalles Indian Reserve No. 38C; thence generally northerly and generally southeasterly along the westerly and northerly boundaries of said Indian reserve to the northerly limit of the City of Kenora; thence generally easterly along said limit to the westerly limit of Pettypiece Geographic Township; thence northerly, easterly and southerly along the westerly, northerly and easterly limits of said geographic township to the northerly limit of Jackman Geographic Township; thence generally northeasterly and easterly along said limit and easterly along the northerly limits of the geographic townships of MacNicol, Tustin, Bridges, Docker and Langton (common with the northerly limit of the Township of Machin) to the westerly limit of Mutrie Geographic Township; thence northerly along said limit and generally northerly along the westerly limit of Colenso Geographic Township to the northerly limit of said geographic township; thence easterly along said limit and along the northerly limit of Mafeking Geographic Township to the westerly limit of Ladysmith Geographic Township; thence southerly and easterly along the westerly and southerly limits of said geographic township and easterly along the southerly limits of the geographic townships of Rowell, Daniel, Breithaupt, McIlraith and Lomond to the westerly limit of the Municipality of Sioux Lookout; thence easterly, northerly and generally easterly along the southerly and easterly limits of said municipality to the southeasternmost point of said municipality; thence easterly in a straight line to a point on the limit of said unorganized area at approximate latitude 49°57′23″N and longitude 90°57′56″W (northerly of Sturgeon Lake);
- (j) that part of the Unorganized Area of Thunder Bay lying southerly and westerly of a line described as follows: commencing at a point on the westerly limit of said unorganized area at approximate latitude 49°57′23″N and longitude 90°57′56″W (northerly of Sturgeon Lake); thence easterly in a straight line to a point at approximate latitude 49°51′52″N and longitude 90°00′00″W; thence southerly in a straight line to an unnamed road at approximate latitude 49°20′59″N and longitude 89°59′55″W, thence generally southerly along said road to its intersection with Chisamore Road at approximate latitude 49°18′30″N and longitude 89°58′13″W; thence southerly along said road to Pakashkan Road; thence generally southerly along said road to Dog River Road, thence generally southerly along said road to Highway 17 (Trans-Canada Highway); thence generally southerly along said highway to Highway 11/17 (Trans-Canada Highway); thence generally southeasterly along said highway to the northerly limit of the Township of Conmee;
- (k) the Indian reserves of Agency No. 1, Assabaska, Big Grassy River No. 35G, Big Island Mainland No. 93, Couchiching No. 16A, Eagle Lake No. 27, Fort William No. 52, Kenora No. 38B, Lac des Mille Lacs No. 22A1, Lake of the Woods No. 37, Manitou Rapids No. 11, Neguaguon Lake No. 25D, Northwest Angle No. 33B, Rainy Lake nos. 17A, 17B, 18C and 26A, Rat Portage No. 38A, Sabaskong Bay No. 35D, Saug-a-Gaw-Sing No. 1, Seine River No. 23A, Shoal Lake nos. 34B2 and 39A, Sturgeon Falls No. 23, The Dalles No. 38C, Wabigoon Lake No. 27, Whitefish Bay nos. 32A, 33A and 34A; and
- (l) that part of Shoal Lake Indian Reserve No. 40 lying easterly of the interprovincial boundary between Ontario and Manitoba.
Kiiwetinoong—Mushkegowuk
(Population: 36,325)
(Map 1)
Consists of:
- (a) the Town of Moosonee;
- (b) the municipalities of Red Lake and Sioux Lookout;
- (c) the townships of Ear Falls and Pickle Lake;
- (d) that part of the Unorganized Area of Cochrane (North Part) lying northerly of a line described as follows: commencing at a point on the westerly limit of said unorganized area at approximate latitude 50°30′02″N and longitude 86°32′55″W; thence easterly in a straight line to a point on the interprovincial boundary between Ontario and Quebec at approximate latitude 50°30′00″N and longitude 79°31′05″W;
- (e) that part of the Unorganized Area of Kenora lying northerly of a line described as follows: commencing at the intersection of the interprovincial boundary between Ontario and Manitoba with the Canadian National Railway at approximate latitude 49°53′12″N and longitude 95°09′10″W; thence generally northeasterly along said railway to a point at approximate latitude 49°56′54″N and longitude 94°45′09″W (westerly of Camp Four Lake); thence southerly in a straight line to the northerly limit of Umbach Geographic Township; thence easterly along said limit to the westerly boundary of The Dalles Indian Reserve No. 38C; thence generally northerly and generally southeasterly along the westerly and northerly boundaries of said Indian reserve to the northerly limit of the City of Kenora; thence generally easterly along said limit to the westerly limit of Pettypiece Geographic Township; thence northerly, easterly and southerly along the westerly, northerly and easterly limits of said geographic township to the northerly limit of Jackman Geographic Township; thence generally northeasterly and easterly along said limit and easterly along the northerly limits of the geographic townships of MacNicol, Tustin, Bridges, Docker and Langton (common with the northerly limit of the Township of Machin) to the westerly limit of Mutrie Geographic Township; thence northerly along said limit and generally northerly along the westerly limit of Colenso Geographic Township to the northerly limit of said geographic township; thence easterly along said limit and along the northerly limit of Mafeking Geographic Township to the westerly limit of Ladysmith Geographic Township; thence southerly and easterly along the westerly and southerly limits of said geographic township and easterly along the southerly limits of the geographic townships of Rowell, Daniel, Breithaupt, McIlraith and Lomond to the westerly limit of the Municipality of Sioux Lookout; thence easterly, northerly and generally easterly along the southerly and easterly limits of said municipality to the southeasternmost point of said municipality; thence easterly in a straight line to a point on the limit of said unorganized area at approximate latitude 49°57′23″N and longitude 90°57′56″W (northerly of Sturgeon Lake);
- (f) that part of the Unorganized Area Thunder Bay lying northerly and westerly of a line described as follows: commencing at a point on the westerly limit of said unorganized area at approximate latitude 49°57′23″N and longitude 90°57′56″W; thence easterly in a straight line to the southwesternmost point of Gull River Indian Reserve No. 55; thence easterly along the southerly boundary of said Indian reserve to the westerly shoreline of Lake Nipigon (Gull Bay); thence northerly and southerly along said bay and generally northeasterly along the westerly shoreline of Lake Nipigon to a point at approximate latitude 50°17′01″N and longitude 88°39′00″W; thence northerly in a straight line to a point at approximate latitude 50°30′00″N and longitude 88°38′50″W; thence easterly in a straight line to the easterly limit of said unorganized area;
- (g) the Indian reserves of Attawapiskat No. 91A, Bearskin Lake, Cat Lake No. 63C, Deer Lake, English River No. 21, Factory Island No. 1, Fort Albany No. 67, Fort Hope No. 64, Fort Severn No. 89, Gull River No. 55, Kasabonika Lake, Keewaywin, Kingfisher Lake No. 1, Kitchenuhmaykoosib Aaki No. 84, Lac Seul No. 28, Marten Falls No. 65, Moose Factory No. 68, Muskrat Dam Lake, Neskantaga, North Spirit Lake, Ojibway Nation of Saugeen (Savant Lake), Osnaburgh No. 63A, Osnaburgh No. 63B, Pikangikum No. 14, Poplar Hill, Sachigo Lake No. 1, Sandy Lake No. 88, Slate Falls Nation, Wabaseemoong, Wabauskang No. 21, Wapekeka No. 2, Wawakapewin, Weagamow Lake No. 87, Webequie, Whitesand and Wunnumin No. 1; and
- (h) the Indian settlements of Lansdowne House, Peawanuck and Summer Beaver.
King—Vaughan
(Population: 116,118)
(Map 22)
Consists of:
- (a) that part of the City of Vaughan described as follows: commencing at the intersection of the westerly limit of said city and Nashville Road; thence generally easterly along said road to Highway 27; thence southerly along said highway to Humber Bridge Trail; thence easterly along said trail and its northeasterly production to Saint Padre Pio Gardens; thence easterly and southeasterly along Saint Padre Pio Gardens to Major Mackenzie Drive West; thence northeasterly and easterly along said drive to Highway 400; thence southerly along said highway to Rutherford Road; thence generally northeasterly along said road to Peter Rupert Avenue; thence generally northerly along said avenue to Major Mackenzie Drive West; thence easterly along said drive to the easterly limit of said city; thence northerly, generally westerly and generally southerly along the easterly, northerly and westerly limits of said city to the point of commencement; and
- (b) that part of the Township of King lying southeasterly of a line described as follows: commencing at a point on the westerly limit of said township at approximate latitude 43°57′21″N and longitude 79°45′21″W; thence easterly in a straight line to the 12th Concession; thence northerly along said road to 18th Sideroad; thence easterly along said road to the 11th Concession; thence northerly along said road to 18th Sideroad; thence easterly along said road to the 10th Concession; thence northerly along said road to 18th Sideroad; thence easterly along said road to Highway 27; thence southerly along said highway to 18th Sideroad; thence easterly along said road to the 8th Concession; thence southerly along said road to 18th Sideroad; thence easterly along said road to the 7th Concession; thence northerly along said road to 18th Sideroad; thence easterly along said road, its intermittent production and Lloydtown-Aurora Road to Dufferin Street; thence northerly along said street to 18th Sideroad; thence easterly along said road to the easterly limit of said township.
Kingston and the Islands
(Population: 126,106)
(Maps 4 and 14)
Consists of:
- (a) that part of the City of Kingston lying southerly of Highway 401 (Macdonald-Cartier Freeway); and
- (b) the Township of Frontenac Islands.
Kitchener Centre
(Population: 114,595)
(Map 8)
Consists of that part of the City of Kitchener described as follows: commencing at the intersection of the northerly limit of said city and Fischer-Hallman Road South; thence generally northeasterly and southeasterly along the northerly and easterly limits of said city to the southeasterly production of Woolner Trail; thence northwesterly along said production and along said trail to Fairway Road North; thence westerly and southwesterly along said road to Lackner Boulevard; thence northwesterly along said boulevard to Daimler Drive; thence southwesterly and westerly along said drive to Old Chicopee Drive; thence southerly and southwesterly along said drive to River Road East; thence southeasterly along said road to Kinzie Avenue; thence southwesterly along said avenue to Weber Street East; thence northwesterly and westerly along said street to Fergus Avenue; thence southerly along said avenue and its southerly production to Highway 8; thence westerly along said highway to Highway 7/8 (Conestoga Parkway); thence generally southwesterly along said highway to Fischer-Hallman Road; thence generally northwesterly along said road to the point of commencement.
Kitchener—Conestoga
(Population: 114,856)
(Map 3)
Consists of:
- (a) that part of the City of Cambridge lying northwesterly of a line described as follows: commencing at a point on the easterly limit of said city at approximate latitude 43°27′16″N and longitude 80°17′52″W; thence southerly in a straight line to the Speed River; thence generally southwesterly along said river (running southerly of Speed Island) to Highway 401 (Macdonald-Cartier Freeway); thence westerly and southwesterly along said highway to the westerly limit of said city;
- (b) that part of the City of Kitchener described as follows: commencing at the intersection of the westerly limit of said city and Bleams Road; thence easterly along said road to Fisher-Hallman Road; thence northerly and generally northwesterly along said road to the northerly limit of the said city; thence generally westerly along said limit to the westerly limit of said city; thence southeasterly along said limit to the point of commencement; and
- (c) the townships of Wellesley, Wilmot and Woolwich.
Kitchener South—North Dumfries
(Population: 114,179)
(Maps 3 and 8)
Consists of:
- (a) that part of the City of Cambridge lying southwesterly of a line described as follows: commencing at the intersection of the westerly limit of said city and Shantz Hill Road; thence southeasterly along said road and its production to the Speed River; thence generally southeasterly along said river to the Grand River and the westerly limit of said city at approximate latitude 43°23′13″N and longitude 80°22′01″W;
- (b) that part of the City of Kitchener described as follows: commencing at the intersection of the westerly limit of said city and Bleams Road; thence easterly along said road to Fischer-Hallman Road; thence northerly and northwesterly along said road to Highway 7/8 (Conestoga Parkway); thence generally northeasterly along said highway to Highway 8; thence southeasterly along said highway to the intersection of said road and the southerly production of Fergus Avenue; thence northerly along said production and along said avenue to Weber Street East; thence easterly and southeasterly along said street to Kinzie Avenue; thence northeasterly along said avenue to River Road East; thence northwesterly along said road to Old Chicopee Drive; thence northeasterly and northerly along said drive to Daimler Drive; thence generally northeasterly along said drive to Lackner Boulevard; thence easterly and southeasterly along said boulevard to Fairway Road North; thence northeasterly and easterly along said road to Woolner Trail; thence southeasterly along said trail and its production to the Grand River and the easterly limit of said city; thence generally southerly, southwesterly, westerly and northerly along the easterly, southerly and westerly limits of said city to the point of commencement; and
- (c) the Township of North Dumfries.
Lake Simcoe—Uxbridge
(Population: 118,867)
(Maps 3 and 4)
Consists of:
- (a) that part of the City of Oshawa lying northerly of Highway 407;
- (b) the Town of Georgina;
- (c) that part of the Town of East Gwillimbury lying easterly of a line described as follows: commencing at the intersection of the northwesterly limit of said town and Woodbine Avenue; thence southerly along said avenue to Highway 404; thence generally southerly along said highway to the southerly limit of said town;
- (d) that part of the Town of Whitchurch-Stouffville described as follows: commencing at the intersection of Bethesda Road and the easterly limit of said town; thence northwesterly, southwesterly, generally southerly and generally northeasterly along the easterly, northwesterly, westerly and southeasterly limits of said town to Highway 48; thence northerly along said highway to Bethesda Road; thence easterly along said road to Ninth Line; thence northerly along Ninth Line to Bethesda Road; thence easterly along said road to the point of commencement;
- (e) that part of the Municipality of Clarington lying northerly of Highway 407 and westerly of a line described as follows: commencing at the intersection of the northerly limit of said municipality and a point on Regional Road 20 at approximate latitude 44°03′33″N and longitude 78°41′20″W; thence southerly along said road to Concession Road 10; thence easterly along said road to Darlington-Clarke Townline Road; thence southerly along said road and its intermittent production to Highway 407;
- (f) the townships of Scugog and Uxbridge; and
- (g) the Indian reserves of Chippewas of Georgina Island First Nation and Mississauga’s of Scugog Island.
Lanark—Frontenac
(Population: 109,784)
(Map 4)
Consists of:
- (a) that part of the City of Ottawa described as follows: commencing at the intersection of the westerly limit of said city and Highway 7; thence generally northeasterly along said highway to Highway 417 (Trans-Canada Highway); thence generally northwesterly along said highway to the northwesterly limit of said city; thence southwesterly and generally southeasterly along the northwesterly and southwesterly limits of said city to the point of commencement;
- (b) the towns of Carleton Place, Perth and Smiths Falls;
- (c) the Municipality of Mississippi Mills;
- (d) the townships of Beckwith, Central Frontenac, Drummond/North Elmsley, Greater Madawaska, Lanark Highlands, Montague, North Frontenac, Rideau Lakes and Tay Valley;
- (e) that part of the Township of Elizabethtown-Kitley lying northwesterly of a line described as follows: commencing at the intersection of the southwesterly limit of said township and Kitley-Elizabethtown Townline Road; thence northeasterly along said road and its northeasterly production to the northeasterly limit of said township;
- (f) that part of the Township of South Frontenac lying northerly of the southerly limit of Bedford Geographic Township; and
- (g) the villages of Merrickville-Wolford and Westport.
London Centre
(Population: 123,531)
(Map 15)
Consists of that part of the City of London described as follows: commencing at the intersection of the northerly limit of said city and Adelaide Street North; thence southeasterly along said street to the Canadian National Railway; thence easterly along said railway to Highbury Avenue North; thence southeasterly along said avenue to the Thames River; thence generally westerly along said river to the Canadian National Railway; thence southeasterly along said railway to Commissioners Road East; thence westerly along said road and Commissioners Road West to Wonderland Road South; thence generally northerly and northwesterly along said road and Wonderland Road North to the northerly limit of said city; thence northeasterly along the limit of said city to the point of commencement.
London Northeast
(Population: 123,241)
(Maps 3 and 15)
Consists of:
- (a) that part of the City of London lying northerly and easterly of a line described as follows: commencing at the intersection of the northerly limit of said city and Adelaide Street North; thence southeasterly along said street to the Canadian National Railway; thence easterly along said railway to Highbury Avenue North; thence southeasterly along said avenue to the Thames River; thence generally easterly along said river to the easterly limit of said city;
- (b) that part of the Municipality of Thames Centre lying northerly of Highway 401 (Macdonald-Cartier Freeway) and southerly of a line described as follows: commencing at the intersection of the westerly limit of said municipality and Thorndale Road; thence northeasterly along said road to Nissouri Road; thence northwesterly along said road to approximate latitude 43°06′21″N and longitude 81°09′32″W; thence northeasterly in a straight line to Fairview Road at approximate latitude 43°06′39″N and longitude 81°08′35″W; thence southeasterly along said road to Thorndale Road; thence northeasterly along said road to the easterly limit of said municipality;
- (c) that part of the Township of Zorra lying southerly and westerly of a line described as follows: commencing at the intersection of the westerly limit of said township and Road 84; thence northeasterly along said road to 23rd Line; thence southeasterly along said line to Road 74; thence easterly along said road to 23rd Line; thence southeasterly along said line to Road 68; thence southwesterly along said road to 21st Line; thence southeasterly along said line to Road 60; thence southeasterly in a straight line to the southerly limit of said township at approximate latitude 43°00′34″N and longitude 80°56′49″W.
London South—St. Thomas
(Population: 120,208)
(Maps 3 and 15)
Consists of:
- (a) the City of St. Thomas;
- (b) that part of the City of London lying southerly and easterly of a line described as follows: commencing at the intersection of the easterly limit of said city with the Thames River; thence generally westerly along said river to the Canadian National Railway; thence southeasterly along said railway to Commissioners Road East; thence westerly along said road to Wharncliffe Road South; thence southerly and southwesterly along said road to Wonderland Road South; thence southerly along said road to Highway 402; thence generally southwesterly along said highway to the westerly limit of said city;
- (c) that part of the Municipality of Central Elgin lying northerly of John Wise Line;
- (d) that part of the Municipality of Thames Centre lying southerly of Highway 401 (Macdonald-Cartier Freeway) and westerly of Westchester Bourne; and
- (e) that part of the Township of Southwold lying easterly of Sunset Road.
London West
(Population: 121,199)
(Map 15)
Consists of that part of the City of London described as follows: commencing at the intersection of the northerly limit of said city and Wonderland Road North; thence southeasterly and generally southerly along said road and Wonderland Road South to Commissioners Road West; thence easterly along said road to Wharncliffe Road South; thence southerly and southwesterly along said road to Wonderland Road South; thence southerly along said road to Highway 402; thence generally southwesterly along said highway to the westerly limit of said city; thence generally northerly and easterly along the westerly and northerly limits of said city to the point of commencement.
Manitoulin—Nickel Belt
(Population: 99,268)
(Map 1)
Consists of:
- (a) the City of Elliot Lake;
- (b) the City of Greater Sudbury, excluding that part described as follows: commencing at a point on the easterly limit of said city at approximate latitude 46°37′29″N and longitude 80°41′39″W; thence southerly along said limit to the southerly limit of said city; thence generally westerly and northerly along the southerly and westerly limits of said city to a point in Simon Lake at approximate latitude 46°24′08″N and longitude 81°10′56″W; thence northerly in a line to Highway 144 (North-West Bypass); thence generally northerly along said highway to a point at approximate latitude 46°30′37″N and longitude 81°11′59″W; thence easterly in a straight line to the easterly limit of Snider Geographic Township; thence northerly along said limit to the northerly limit of said geographic township; thence easterly along the northerly limit of McKim Geographic Township to the intersection of Maley Drive and Barry Downe Road; thence northerly along Barry Downe Road and along its northerly production to the intersection of Notre Dame Avenue and Bodson Drive West; thence easterly along Bodson Drive East and along its easterly production to the easterly limit of Capreol Geographic Township; thence northerly along said limit to Old Poupore Mine Road; thence generally easterly along said road to Nickel Rim South Mine Road; thence generally southeasterly along said road to Pipeline Road; thence easterly and generally southerly along said road to the northerly limit of Falconbridge Geographic Township; thence easterly along said limit to the point of commencement;
- (c) the towns of Blind River, Espanola, Gore Bay, Northeastern Manitoulin and the Islands and Spanish;
- (d) the municipalities of Central Manitoulin, French River, Gordon/Barrie Island and Killarney;
- (e) that part of the Municipality of Huron Shores lying easterly of a line described as follows: commencing at a point on the easterly limit of said municipality at approximate latitude 46°15′54″N and longitude 83°11′54″W; thence southerly in a straight line to a point on the southerly limit of said municipality at approximate latitude 46°00′19″N and longitude 83°11′26″W;
- (f) the townships of Assiginack, Baldwin, Billings, Burpee and Mills, Cockburn Island, Nairn and Hyman, Sables-Spanish Rivers, Tehkummah and The North Shore;
- (g) the unorganized areas of Algoma (South East Part) and Manitoulin (West Part);
- (h) those parts of the Unorganized Area of Algoma (North Part) described as follows:
- (i) that part lying easterly of a line described as follows: commencing at a point on the easterly limit of said unorganized area at approximate latitude 46°58′38″N and longitude 82°34′43″W; thence southerly along the westerly limits of the geographic townships of Comox, Assad and Fabbro to the southerly limit of Fabbro Geographic Township; thence easterly along said limit to the westerly limit of Landriault Geographic Township; thence southerly along said limit and along the westerly limits of the geographic townships of Piche and Hughson to the southerly limit of said unorganized area; and
- (ii) that part lying southerly and easterly of a line described as follows: commencing at the intersection of the easterly limit of said unorganized area and the northeasternmost point of Nouvel Geographic Township; thence westerly and southerly along the northerly and westerly limits of said geographic township and along the westerly limit of Montgomery Geographic Township to the southerly limit of said geographic township;
- (i) the Unorganized Area of Sudbury (North Part), excluding those parts described as follows:
- (i) that part lying northerly and westerly of a line described as follows: commencing at a point on the southerly limit of said unorganized area at approximate latitude 47°14′08″N and longitude 82°34′38″W; thence northerly along the westerly limit of Hubbard Geographic Township to the northerly limit of said geographic township; thence easterly along said limit and along the northerly limit of Abney Geographic Township to the westerly limit of Elizabeth Geographic Township; thence northerly and easterly along the westerly and northerly limits of said geographic township and along the northerly limit of Margaret Geographic Township to the easterly limit of said geographic township; thence southerly along said limit to the northerly limit of Lillie Geographic Township; thence easterly along the northerly limits of the geographic townships of Lillie, Chalet, Paudash and Brebeuf to the easterly limit of Brebeuf Geographic Township; thence southerly along said limit to the northerly limit of Blewett Geographic Township; thence easterly along the northerly limits of the geographic townships of Blewett and Beulah to the easterly limit of Beulah Geographic Township; thence southerly along said limit to the northerly limit of Hodgetts Geographic Township; thence easterly along the northerly limits of the geographic townships of Hodgetts and Unwin to the northeasternmost point of Unwin Geographic Township;
- (ii) that part lying southerly of a line described as follows: commencing at a point on the southerly limit of Kelly Geographic Township at approximate latitude 46°42′40″N and longitude 80°32′56″W; thence easterly along the southerly limit of said geographic township and along the southerly limit of McNish Geographic Township to the westerly limit of said unorganized area; and
- (iii) that part lying northerly of Hendrie Geographic Township; and
- (j) the Indian reserves of M’Chigeeng No. 22, Mississagi River No. 8, Point Grondine No. 3, Sagamok, Serpent River No. 7, Sheguiandah No. 24, Sheshegwaning No. 20, Sucker Creek No. 23, Wahnapitae No. 11, Whitefish Lake No. 6, Whitefish River No. 4, Wikwemikong Unceded and Zhiibaahaasing 19A.
Markham—Stouffville
(Population: 121,176)
(Map 22)
Consists of:
- (a) that part of the City of Markham lying easterly of a line described as follows: commencing at the intersection of the northerly limit of said city and Highway 48; thence southerly along said highway, Markham Road, Main Street Markham North, Main Street Markham South and Markham Road to the southerly limit of said city; and
- (b) that part of the Town of Whitchurch-Stouffville described as follows: commencing at the intersection of the southerly limit of said town and Highway 48; thence northerly along said highway to Bethesda Road; thence easterly along said road to Ninth Line; thence northerly along said line to Bethesda Road; thence easterly along said road to the easterly limit of said town; thence southerly and generally westerly along the easterly and southerly limits of said town to the point of commencement.
Markham—Thornhill
(Population: 123,400)
(Map 22)
Consists of that part of the City of Markham described as follows: commencing at the intersection of the westerly limit of said city and the Don River (East Branch); thence generally southeasterly along said river to John Street; thence northeasterly and easterly along said street to Bayview Avenue; thence northerly along said avenue to Highway 7; thence northeasterly along said highway to Main Street Markham South; thence southerly along said street and along Markham Road to the southerly limit of said city; thence southwesterly and northerly along the southerly and westerly limits of said city to the point of commencement.
Markham—Unionville
(Population: 122,401)
(Map 22)
Consists of that part of the City of Markham described as follows: commencing at the intersection of the northerly limit of said city and Highway 48; thence southerly along said highway, Markham Road and Main Street Markham North to Highway 7; thence southwesterly along said highway to the westerly limit of said city; thence northerly and easterly along the westerly and northerly limits of said city to the point of commencement.
Mississauga Centre
(Population: 119,975)
(Map 17)
Consists of that part of the City of Mississauga described as follows: commencing at the intersection of Hurontario Street and Bristol Road West; thence southeasterly along said street to the Canadian Pacific Railway; thence southwesterly along said railway to Confederation Parkway; thence generally southeasterly along said parkway to Dundas Street West; thence southwesterly along said street to Erindale Station Road; thence northwesterly along said road to the Canadian Pacific Railway; thence generally westerly along said railway to the Credit River; thence generally northwesterly along said river (passing southwesterly of Streetsville Memorial Park Island) to Bristol Road West; thence generally northeasterly along said road to the point of commencement.
Mississauga East—Cooksville
(Population: 120,196)
(Map 17)
Consists of that part of the City of Mississauga described as follows: commencing at the intersection of the northeasterly limit of said city and Queensway East; thence generally southwesterly along Queensway East and along Queensway West to Stillmeadow Road; thence northwesterly along said road to approximate latitude 43°34′17″N and longitude 79°37′34″W; thence northwesterly in a straight line to Dundas Street West; thence northeasterly along said street to Confederation Parkway; thence generally northwesterly along said parkway to the Canadian Pacific Railway; thence northeasterly along said railway to Hurontario Street; thence northwesterly along said street to Highway 403; thence northeasterly and northwesterly along said highway to Eglinton Avenue East; thence northeasterly along said avenue to the northeasterly limit of said city; thence generally southeasterly along said limit to the point of commencement.
Mississauga—Erin Mills
(Population: 119,526)
(Map 17)
Consists of that part of the City of Mississauga described as follows: commencing at the intersection of the southwesterly limit of said city with the southwesterly production of Thomas Street; thence generally northeasterly along said production and along Thomas Street to Queen Street South; thence northwesterly along said street to Main Street; thence northeasterly and easterly along said street to the Credit River; thence generally southeasterly along said river (passing southwesterly of Streetsville Memorial Park Island) to the Canadian Pacific Railway; thence generally easterly along said railway to Erindale Station Road; thence southeasterly along said road to Dundas Street West; thence generally southwesterly along said street and along Dundas Street East to the southwesterly limit of said city; thence generally northwesterly along said limit to the point of commencement.
Mississauga Lakeshore
(Population: 119,936)
(Map 17)
Consists of that part of the City of Mississauga described as follows: commencing at the intersection of the northeasterly limit of said city with Queensway East; thence southwesterly along Queensway East and along Queensway West to Stillmeadow Road; thence northwesterly along said road to approximate latitude 43°34′17″N and longitude 79°37′34″W; thence northwesterly in a straight line to Dundas Street West; thence generally southwesterly along said street to the southwesterly limit of said city; thence southeasterly, northeasterly and generally northwesterly along the southwesterly, southeasterly and northeasterly limits of said city to the point of commencement.
Mississauga—Malton
(Population: 119,741)
(Map 17)
Consists of that part of the City of Mississauga described as follows: commencing at the intersection of the northwesterly limit of said city with the Credit River; thence generally southeasterly along said river to Creditview Road; thence southeasterly along said road to Bristol Road West; thence generally northeasterly along said road to Hurontario Street; thence southeasterly along said street to Highway 403; thence northeasterly and northwesterly along said highway to Eglinton Avenue East; thence northeasterly along said avenue to the northeasterly limit of said city; thence northeasterly, northwesterly, generally westerly and generally southwesterly along the northeasterly, northerly and northwesterly limits of said city to the point of commencement.
Mississauga—Meadowvale
(Population: 118,587)
(Map 17)
Consists of that part of the City of Mississauga described as follows: commencing at the intersection of northwesterly limit of said city and the Credit River; thence generally southeasterly along said river to Creditview Road; thence southeasterly along said road to Bristol Road West; thence generally southwesterly along said road to Main Street; thence westerly and southwesterly along said street to Queen Street South; thence southeasterly along said street to Thomas Street; thence generally southwesterly along said street and its southwesterly production to the southwesterly limit of said city; thence generally northwesterly and generally northeasterly along the southwesterly and northwesterly limits of said city to the point of commencement.
Nepean
(Population: 122,229)
(Map 16)
Consists of that part of the City of Ottawa described as follows: commencing at the intersection of Highway 416 (Veterans Memorial Highway) and the Canadian National Railway; thence generally easterly along said railway to the Rideau River; thence generally southerly along said river to Barnsdale Road in passing on the westerly side of Nicolls Island and Long Island; thence southwesterly along said road to Highway 416 (Veterans Memorial Highway); thence generally northwesterly along said highway to the point of commencement.
New Tecumseth—Bradford
(Population: 118,958)
(Map 3)
Consists of:
- (a) the towns of Bradford West Gwillimbury and New Tecumseth;
- (b) that part of the Town of East Gwillimbury lying westerly of a line described as follows: commencing at the intersection of the northwesterly limit of said town and Woodbine Avenue; thence southerly along said avenue to Highway 404; thence generally southerly along said highway to the southerly limit of said town; and
- (c) that part of the Township of King lying northwesterly of a line described as follows: commencing at the intersection of the easterly limit of said township and 18th Side Road; thence westerly along said road, Lloydtown-Aurora Road, 18th Side Road and its intermittent production to 7th Concession; thence southerly along said road to 18th Side Road; thence westerly along said road to 8th Concession; thence northerly along said road to 18th Side Road; thence westerly along said road to Highway 27; thence northerly along said highway to 18th Side Road; thence westerly along said road to 10th Concession; thence southerly along said road to 18th Side Road; thence westerly along said road to 11th Concession; thence southerly along said road to 18th Side Road; thence westerly along said road to 12th Concession; thence southerly along said road to approximate latitude 43°57′31″N and longitude 79°44′37″W; thence westerly in a straight line to the westerly limit of said township.
Newmarket—Aurora
(Population: 118,666)
(Map 22)
Consists of:
- (a) the Town of Newmarket; and
- (b) that part of the Town of Aurora lying northerly and easterly of a line described as follows: commencing at the intersection of the easterly limit of said town and Wellington Street East; thence westerly along said street to Yonge Street; thence northerly along said street to Orchard Heights Boulevard; thence generally westerly along said boulevard to the westerly limit of said town.
Niagara Falls
(Population: 113,503)
(Map 3)
Consists of:
- (a) the City of Niagara Falls; and
- (b) the Town of Niagara-on-the-Lake.
Niagara South
(Population: 112,928)
(Map 3)
Consists of:
- (a) the cities of Port Colborne and Welland;
- (b) that part of the City of Thorold lying southerly of Highway 20 (partly common with Lundy’s Lane); and
- (c) the Town of Fort Erie.
Niagara West
(Population: 118,158)
(Map 3)
Consists of:
- (a) that part of the City of Haldimand County lying easterly of a line described as follows: commencing at the intersection of the northeasterly limit of said city and Caistorville Road; thence generally southerly along said road to Haldimand-Dunnville Townline Road; thence generally southerly along said road and its intermittent productions to the northerly shoreline of Lake Erie;
- (b) that part of the City of St. Catharines lying westerly of a line described as follows: commencing at the intersection of the southerly limit of said city and the southerly production of First Street Louth; thence northerly along said production and said street to Twelve Mile Creek; thence generally northeasterly and generally northwesterly along said creek to Highway 406; thence westerly and generally northerly along said highway to Queen Elizabeth Way; thence westerly along Queen Elizabeth Way to Third Street Louth; thence northerly along said street, Courtleigh Road and its northerly production to the northerly limit of said city (Lake Ontario);
- (c) that part of the City of Thorold lying northerly of Highway 20 (partly common with Lundy’s Lane);
- (d) the towns of Lincoln and Pelham;
- (e) that part of the Town of Grimsby lying southerly of the Niagara Escarpment; and
- (f) the townships of Wainfleet and West Lincoln.
Nipissing
(Population: 99,149)
(Maps 1 and 2)
Consists of:
- (a) the City of North Bay;
- (b) the Town of Mattawa;
- (c) the municipalities of Callander, Calvin, East Ferris, Markstay-Warren, Powassan, St.-Charles, Temagami and West Nipissing;
- (d) the townships of Bonfield, Chisholm, Machar, Mattawan, Nipissing and Papineau-Cameron;
- (e) the Village of South River;
- (f) the Unorganized Areas of Nipissing (North Part) and Parry Sound (North East Part);
- (g) that part of the Unorganized Area of Nipissing (South Part) described as follows: commencing at the intersection of the westerly limit of said unorganized area and the northerly limit of Nightingale Geographic Township; thence easterly along said limit and along the northerly limit of Airy Geographic Township to the westerly limit of Preston Geographic Township; thence northerly along said limit and along the westerly limit of Dickson Geographic Township to the southerly limit of Anglin Geographic Township; thence westerly and northerly along the southerly and westerly limits of said geographic township to the northerly limit of Freswick Geographic Township; thence westerly along said limit to the westerly limit of Lister Geographic Township; thence northerly and easterly along the westerly and northerly limits of said Geographic Township to the westerly limit of Deacon Geographic Township; thence northerly along the westerly limit of said geographic township to the northwesternmost point of said geographic township; thence generally northerly, generally westerly, generally southerly and generally easterly along the easterly, northerly, westerly and southerly limits of said unorganized area to the point of commencement;
- (h) those parts of the Unorganized Area of Sudbury (North Part) described as follows:
- (i) that part lying southerly of a line described as follows: commencing at a point on the southerly limit of Kelly Geographic Township at approximate latitude 46°42′40″N and longitude 80°32′56″W; thence easterly along the southerly limit of said geographic township and along the southerly limit of McNish Geographic Township to the westerly limit of said unorganized area; and
- (ii) that part lying northerly of a line described as follows: commencing at the intersection of the easterly limit of said unorganized area and the northerly limit of Hendrie Geographic Township; thence westerly along said limit to the westerly limit of said unorganized area; and
- (i) the Indian reserves of Bear Island No. 1 and Nipissing No. 10.
Northumberland
(Population: 114,335)
(Map 4)
Consists of:
- (a) the Town of Cobourg;
- (b) the municipalities of Brighton, Port Hope and Trent Hills;
- (c) that part of the Municipality of Clarington lying easterly of a line described as follows: commencing at the intersection of the northerly limit of said municipality and a point on Regional Road 20 at approximate latitude 44°03′33″N and longitude 78°41′20″W; thence southerly along said road to Concession Road 10; thence easterly along said road to Darlington-Clarke Townline Road; thence generally southerly along said road and its intermittent productions to Highway 401 (Macdonald-Cartier Freeway, Highway of Heroes); thence easterly along said highway to Cobbledick Road; thence southeasterly along said road to Waterfront Trail at approximate latitude 43°54′09″N and longitude 78°36′24″W; thence southerly in a straight line to the shoreline of Lake Ontario at approximate latitude 43°53′50″N and longitude 78°36′15″W;
- (d) the townships of Asphodel-Norwood, Cramahe and Hamilton;
- (e) the Township of Alnwick/Haldimand, excluding that part described as follows: commencing at the intersection of the northerly limit of said township (Rice Lake) and the northerly production of Merrill Road at approximate latitude 44°15′40″N and longitude 78°03′10″W; thence generally southerly along said production and said road to County Road 45; thence southwesterly along said road to Lewis Road; thence southeasterly along said road to County Road 24; thence northeasterly along said road to the northerly production of the most easterly limit of Alderville First Nation Indian Reserve at approximate latitude 44°11′55″N and longitude 78°02′09″W; thence southeasterly along said production and said limit to 1st Line Road at approximate latitude 44°10′33″N and longitude 78°01′29″W; thence westerly along said road and its intermittent productions to the westerly limit of Alderville First Nation Indian Reserve at approximate latitude 44°09′36″N and longitude 78°05′30″W; thence northerly along said limit to County Road 18; thence westerly along said road to the southerly limit of said Indian reserve at approximate latitude 44°10′17″N and longitude 78°06′19″W; thence westerly and northerly along the southerly and westerly limits of said Indian reserve to its northerly limit; thence northerly in a straight line to the northwesterly limit of said township (Rice Lake); thence generally northeasterly along said limit (passing northwesterly of East Grape Island, Grasshopper Island, Hickory Island, Margaret Island, Rack Island and White Island) to the point of commencement; and
- (f) that part of the Township of Cavan Monaghan lying southerly of Highway 115 and easterly of County Road 28.
Oakville Lakeshore
(Population: 114,917)
(Map 12)
Consists of:
- (a) that part of the City of Burlington lying southeasterly and northeasterly of a line described as follows: commencing at the intersection of Burloak Drive and Queen Elizabeth Way; thence southwesterly along said way to Appleby Line; thence southeasterly along Appleby Line and its southeasterly production to the southeasterly limit of said city; and
- (b) that part of the Town of Oakville described as follows: commencing at the intersection of the northeasterly limit of said town (Winston Churchill Boulevard) and Dundas Street West; thence southwesterly along said street and Dundas Street East to Trafalgar Road; thence southeasterly along said road to Queen Elizabeth Way; thence southwesterly along said way to the southwesterly limit of said town; thence southeasterly, generally northeasterly and northwesterly along the southwesterly, southeasterly and northeasterly limits of said town to the point of commencement.
Oakville North
(Population: 113,574)
(Map 12)
Consists of:
- (a) that part of the City of Burlington described as follows: commencing at the intersection of the northeasterly limit of said city and Dundas Street; thence southwesterly along said street to Appleby Line; thence southeasterly along Appleby Line to Queen Elizabeth Way; thence northeasterly along said way to the northeasterly limit of said city; thence northwesterly along said limit to the point of commencement; and
- (b) that part of the Town of Oakville described as follows: commencing at the intersection of the southwesterly limit of said town and Dundas Street West; thence northeasterly along said street and along Dundas Street East to Trafalgar Road; thence southeasterly along said road to Queen Elizabeth Way; thence southwesterly along said way to the southwesterly limit of said town; thence northwesterly along said limit to the point of commencement.
Orléans
(Population: 126,662)
(Map 16)
Consists of that part of the City of Ottawa described as follows: commencing at the intersection of Regional Road 174 (Queensway) and Cardinal Creek; thence generally southeasterly along said creek to Innes Road; thence westerly along said road to Frank Kenny Road; thence generally southeasterly along said road to Wall Road; thence generally southwesterly along said road to Tenth Line Road; thence southeasterly along said road to Prescott-Russell Recreational Trail; thence westerly along said trial to a point at approximate latitude 45°25′22″N and longitude 75°31′43″W; thence northwesterly in a straight line to Renaud Road at approximate latitude 45°25′28″N and longitude 75°31′47″W; thence northerly in a straight line to Navan Road at approximate latitude 45°26′02″N and longitude 75°31′59″W; thence westerly along said road to Blackburn Hamlet Bypass; thence northerly along said bypass and Innes Road to a point at approximate latitude 45°26′26″N and longitude 75°32′27″W; thence northwesterly in a straight line to the interprovincial boundary between Ontario and Quebec; thence northeasterly along said boundary to a point at approximate latitude 45°30′44″N and longitude 75°28′54″W; thence southeasterly in a straight line to the mouth of Cardinal Creek; thence generally southeasterly along said creek to the point of commencement.
Oshawa
(Population: 126,499)
(Map 9)
Consists of that part of the City of Oshawa lying southerly and easterly of a line described as follows: commencing at the intersection of the easterly limit of said city and Taunton Road East; thence westerly along said road and Taunton Road West to Oshawa Creek; thence generally southerly along said creek to Rossland Road West; thence westerly along said road to the westerly limit of said city.
Ottawa Centre
(Population: 118,950)
(Map 16)
Consists of that part of the City of Ottawa described as follows: commencing at the intersection of the Rideau River and Highway 417 (Trans-Canada Highway, Queensway); thence generally southwesterly along said river to Heron Road; thence westerly along said road and southwesterly along Baseline Road to Fisher Avenue; thence northwesterly along said avenue to Carling Avenue; thence southwesterly along said avenue to Highway 417 (Trans-Canada Highway, Queensway); thence southwesterly along said highway to Woodroffe Avenue; thence generally northwesterly along said avenue to Carling Avenue; thence northeasterly along said avenue to Woodroffe Avenue; thence northwesterly along said avenue and its northwesterly production to the interprovincial boundary between Ontario and Quebec; thence generally northeasterly along said boundary to the northwesterly production of the Rideau Canal; thence southeasterly along said production and along said canal to the northeasterly production of Waverley Street; thence easterly in a straight line to the intersection of Nicholas Street and Greenfield Avenue; thence southeasterly along Nicholas Street to Highway 417 (Trans-Canada Highway, Queensway); thence easterly along said highway to the point of commencement.
Ottawa South
(Population: 125,075)
(Map 16)
Consists of that part of the City of Ottawa described as follows: commencing at the intersection of the Rideau River with Highway 417 (Trans-Canada Highway, Queensway); thence generally easterly and southeasterly along said highway to Hunt Club Road; thence southwesterly along said road to Conroy Road; thence southeasterly along said road to Davidson Road; thence southwesterly along said road and Lester Road to the Capital Railway (O-Train); thence southeasterly along said railway and its production to Leitrim Road; thence southwesterly along said road to Limebank Road; thence generally northwesterly along said road and Riverside Drive to West Hunt Club Road; thence westerly along said road to the Rideau River; thence generally northerly along said river to the point of commencement.
Ottawa—Vanier
(Population: 127,255)
(Map 16)
Consists of that part of the City of Ottawa described as follows: commencing at a point on the interprovincial boundary between Ontario and Quebec at approximate latitude 45°28′51″N and longitude 75°33′48″W; thence southeasterly in a straight line to a point on Innes Road at approximate latitude 45°26′26″N and longitude 75°32′27″W; thence generally southwesterly along said road, Blackburn Hamlet Bypass and Innes Road (west of Tauvette Park) to Highway 417 (Trans-Canada Highway); thence northwesterly and westerly along said highway to Nicholas Street; thence northwesterly along said street to Greenfield Avenue; thence westerly in a straight line to the intersection of the Rideau Canal and the northeasterly production of Waverley Street; thence generally northwesterly along said canal and its production to the interprovincial boundary between Ontario and Quebec; thence northeasterly and easterly along said boundary to the point of commencement.
Ottawa West—Nepean
(Population: 123,533)
(Map 16)
Consists of that part of the City of Ottawa described as follows: commencing at a point on the interprovincial boundary between Ontario and Quebec at approximate latitude 45°22′58″N and longitude 75°51′26″W; thence generally easterly and northeasterly along said boundary to the northwesterly production of Woodroffe Avenue; thence southeasterly along said production and said avenue to Carling Avenue; thence southwesterly along said avenue to Woodroffe Avenue; thence southeasterly along said avenue to Highway 417 (Trans-Canada Highway, Queensway); thence northeasterly along said highway to Carling Avenue; thence northeasterly along said avenue to Fisher Avenue; thence southeasterly along said avenue to Baseline Road; thence northeasterly along said road and easterly along Heron Road to the Rideau River; thence generally southerly along said river to the Canadian National Railway; thence westerly along said railway to Highway 416 (Veterans Memorial Highway); thence northwesterly along said highway to Highway 417 (Trans-Canada Highway, Queensway); thence westerly along said highway to Moodie Drive; thence northerly along said drive to Carling Avenue; thence generally southwesterly along said avenue to Davidson’s Side Road; thence northwesterly along said road to the end point of said road; thence northerly in a straight line to the point of commencement.
Oxford—Brant
(Population: 124,844)
(Map 3)
Consists of:
- (a) the City of Woodstock;
- (b) the Town of Ingersoll;
- (c) that part of the County of Brant lying westerly of a line described as follows: commencing at the intersection of the northerly limit of said county and West River Road North; thence generally southwesterly along said road to Glen Morris Road West; thence generally southeasterly along said road to East River Road; thence southwesterly along said road to Princess Street; thence southerly along said street, McPherson School Road and Clarke Road to the northerly limit of the City of Brantford; thence generally southwesterly along the limit of said city to a point on the westerly limit of said city at approximate latitude 43°10′26″N and longitude 80°21′11″W; thence westerly along the westerly production of Powerline Road and along said road to Rest Acres Road; thence southerly along said road and Highway 24 to the northerly limit of the Geographic Township of Oakland; thence easterly along said limit to the southerly limit of said county;
- (d) the townships of Blandford-Blenheim, East Zorra-Tavistock, Norwich and South-West Oxford; and
- (e) that part of the Township of Zorra lying easterly of a line described as follows: commencing at the intersection of the northerly limit of said township and 23rd Line; thence southerly along 23rd Line to Road 74; thence easterly along said road to 23rd Line; thence southerly along 23rd Line to Road 68; thence westerly along said road to 21st Line; thence southerly along 21st Line to Road 60; thence southeasterly in a straight line to a point along the southerly limit of said township (Thames River) at approximate latitude 43°00′34″N and longitude 80°56′49″W.
Parry Sound—Muskoka
(Population: 102,255)
(Map 2)
Consists of:
- (a) the towns of Bracebridge, Gravenhurst, Huntsville, Kearney and Parry Sound;
- (b) the municipalities of Magnetawan, McDougall and Whitestone;
- (c) the townships of Armour, Carling, Georgian Bay, Joly, Lake of Bays, McKellar, McMurrich/Monteith, Muskoka Lakes, Perry, Ryerson, Seguin, Strong and The Archipelago;
- (d) the villages of Burk’s Falls and Sundridge;
- (e) the Unorganized Area of Parry Sound (Centre Part); and
- (f) the Indian reserves of Dokis No. 9, French River No. 13, Henvey Inlet No. 2, Magnetawan No. 1, Moose Point No. 79, Naiscoutaing No. 17A, Parry Island First Nation, Shawanaga No. 17 and Wahta Mohawk Territory.
Penetanguishene—Couchiching
(Population: 112,022)
(Map 3)
Consists of:
- (a) the City of Orillia;
- (b) the towns of Midland and Penetanguishene;
- (c) the townships of Ramara, Severn, Tay and Tiny; and
- (d) the Indian reserves of Chippewas of Rama First Nation, Christian Island No. 30 and Christian Island No. 30A.
Perth—Wellington
(Population: 117,974)
(Map 3)
Consists of:
- (a) the City of Stratford;
- (b) the towns of Minto and St. Marys;
- (c) the municipalities of North Perth and West Perth; and
- (d) the townships of Howick, Mapleton, Perth East, Perth South and Wellington North.
Peterborough
(Population: 121,336)
(Map 4)
Consists of:
- (a) the City of Peterborough;
- (b) that part of the Municipality of Trent Lakes comprising the islands of the Curve Lake First Nation No. 35A;
- (c) the townships of Douro-Dummer, Otonabee-South Monaghan and Selwyn;
- (d) that part of the Township of Alnwick/Haldimand described as follows: commencing at the intersection of the northerly limit of said township (Rice Lake) and the northerly production of Merrill Road at approximate latitude 44°15′40″N and longitude 78°03′10″W; thence generally southerly along said production and said road to County Road 45; thence southwesterly along said road to Lewis Road; thence southeasterly along said road to County Road 24; thence northeasterly along said road to the northerly production of the most easterly limit of Alderville First Nation Indian Reserve at approximate latitude 44°11′55″N and longitude 78°02′09″W; thence southeasterly along said production and said limit to 1st Line Road at approximate latitude 44°10′33″N and longitude 78°01′29″W; thence westerly along said road and its intermittent productions to the westerly limit of Alderville First Nation Indian Reserve at approximate latitude 44°09′36″N and longitude 78°05′30″W; thence northerly along said limit to County Road 18; thence westerly along said road to the southerly limit of said Indian reserve at approximate latitude 44°10′17″N and longitude 78°06′19″W; thence westerly and northerly along the southerly and westerly limits of said Indian reserve to its northerly limit; thence northerly in a straight line to the northwesterly limit of said township (Rice Lake); thence generally northeasterly along said limit (passing northwesterly of East Grape Island, Grasshopper Island, Hickory Island, Margaret Island, Rack Island and White Island) to the point of commencement;
- (e) that part of the Township of Cavan Monaghan lying northeasterly of County Road 28 and Highway 7 (Trans-Canada Highway); and
- (f) the Indian reserves of Alderville First Nation, Curve Lake First Nation No. 35 and Hiawatha First Nation.
Pickering—Brooklin
(Population: 122,430)
(Map 9)
Consists of:
- (a) the City of Pickering; and
- (b) that part of the Town of Whitby lying northerly of Highway 407.
Prescott—Russell
(Population: 111,163)
(Map 4)
Consists of:
- (a) the City of Clarence-Rockland;
- (b) that part of the City of Ottawa described as follows: commencing at the intersection of the interprovincial boundary between Ontario and Quebec with the northwesterly production of Cardinal Creek; thence generally southeasterly along said production and said creek to Innes Road; thence southwesterly along said road to Frank Kenny Road; thence generally southeasterly along said road to Wall Road; thence generally southwesterly along said road to Tenth Line Road; thence southeasterly along said road to the Prescott-Russell Recreational Trail; thence westerly along said trail to a point at approximate latitude 45°25′22″N and longitude 75°31′43″W; thence northwesterly in a straight line to Renaud Road at approximate latitude 45°25′28″N and longitude 75°31′47″W; thence northerly in a straight line to Navan Road at approximate latitude 45°26′02″N and longitude 75°31′59″W; thence westerly along said road to Blackburn Hamlet Bypass; thence generally southwesterly along said bypass and Innes Road to Highway 417 (Trans-Canada Highway); thence generally southeasterly and easterly along said highway to Leitrim Road; thence southwesterly along said road to Farmers Way; thence generally easterly and southeasterly along said way to Thunder Road; thence southwesterly along said road to Farmers Way; thence southeasterly along said way to Mitch Owens Road; thence southwesterly along said road to 9th Line Road; thence southeasterly along said road to the southeasterly limit of said city; thence generally northeasterly, northwesterly and westerly along the southeasterly, southerly and northerly limits of said city to the point of commencement;
- (c) the Town of Hawkesbury;
- (d) the municipalities of Casselman and The Nation; and
- (e) the townships of Alfred and Plantagenet, Champlain, East Hawkesbury and Russell.
Richmond Hill South
(Population: 118,679)
(Map 22)
Consists of that part of the City of Richmond Hill lying southerly of a line described as follows: commencing at the intersection of the easterly limit of said city and Elgin Mills Road East; thence westerly along said road and along Elgin Mills Road West to the westerly limit of said city.
Sarnia—Lambton—Bkejwanong
(Population: 127,200)
(Map 3)
Consists of:
- (a) the City of Sarnia;
- (b) the towns of Petrolia and Plympton-Wyoming;
- (c) that part of the Municipality of Chatham-Kent described as follows: commencing at the intersection of the northerly limit of said municipality and a point on the Sydenham River at approximate latitude 42°37′29″N and longitude 82°01′26″W; thence generally southwesterly along said river to Dawn Mills Road; thence southerly along said road to Base Line; thence westerly along Base Line to Kent Bridge Road; thence southeasterly along said road to Eberts Line; thence southwesterly along Eberts Line and St Andrews Line to Bear Line Road; thence southeasterly along said road to Pain Court Line; thence southwesterly along Pain Court Line to Jacob Road; thence southeasterly along said road to the Thames River; thence generally southwesterly along said river to the westerly limit of said municipality; thence generally northerly and generally easterly along the westerly and northerly limits of said municipality to the point of commencement;
- (d) the townships of Enniskillen and St. Clair;
- (e) that part of the Township of Dawn-Euphemia lying westerly of a line described as follows: commencing at the intersection of the northerly limit of said township and Forest Road; thence southerly along said road and its southerly production to a point on the Sydenham River at approximate latitude 42°41′53″N and longitude 82°00′24″W; thence generally southerly along said river to the southerly limit of said township;
- (f) the villages of Oil Springs and Point Edward; and
- (g) the Indian reserves of Sarnia No. 45 and Walpole Island No. 46.
Sault Ste. Marie
(Population: 97,299)
(Map 1)
Consists of:
- (a) the City of Sault Ste. Marie;
- (b) the towns of Bruce Mines and Thessalon;
- (c) the Municipality of Wawa;
- (d) the Municipality of Huron Shores, excluding that part lying easterly of a line described as follows: commencing at a point on the easterly limit of said municipality at approximate latitude 46°15′54″N and longitude 83°11′54″W; thence south in a straight line to a point on the southerly limit of said municipality at approximate latitude 46°00′19″N and longitude 83°11′26″W;
- (e) the townships of Chapleau, Dubreuilville, Hilton, Jocelyn, Johnson, Laird, Macdonald, Meredith and Aberdeen Additional, Plummer Additional, Prince, St. Joseph, Tarbutt, and White River;
- (f) the Village of Hilton Beach;
- (g) the Unorganized Area of Algoma (North Part), excluding those areas described as follows:
- (i) that part lying northerly of a line described as follows: commencing at a point on the westerly limit of said unorganized area at approximate latitude 49°00′05″N and longitude 85°19′59″W; thence easterly in a straight line to the easterly limit of said unorganized area;
- (ii) that part lying easterly of a line described as follows: commencing at a point on the easterly limit of said unorganized area at approximate latitude 46°58′38″N and longitude 82°34′43″W; thence southerly along the westerly limits of the geographic townships of Comox, Assad and Fabbro to the southerly limit of Fabbro Geographic Township; thence easterly along said limit to the westerly limit of Landriault Geographic Township; thence southerly along said limit and along the westerly limits of the geographic townships of Piche and Hughson to the southerly limit of said unorganized area; and
- (iii) that part lying southerly and easterly of a line described as follows: commencing at the intersection of the easterly limit of said unorganized area and the northeasternmost point of Nouvel Geographic Township; thence westerly and southerly along the northerly and westerly limits of said geographic township and along the westerly limit of Montgomery Geographic Township to the southerly limit of said geographic township;
- (h) that part of the Unorganized Area of Sudbury (North Part) lying southerly and westerly of a line described as follows: commencing at a point on the northerly limit of said unorganized area at approximate latitude 48°27′02″N and longitude 82°36′03″W, thence southerly along the easterly limits the geographic townships of Shenango, Lemoine, Carty, Pinogami, Biggs, Rollo, Swayze, Cunningham, Blamey and Shipley to the northerly limit of Singapore Geographic Township; thence easterly along said limit to the easterly limit of said geographic township; thence southerly along said limit and along the easterly limits of the geographic townships of Burr and Edighoffer to the southerly limit of said unorganized area; thence easterly and southerly along the southerly and westerly limits of said unorganized area to its southerly limit; and
- (i) the Indian reserves of Chapleau No. 74A, Chapleau No. 75, Chapleau Cree Fox Lake, Duck Lake No. 76B, Garden River No. 14, Goulais Bay No. 15A, Gros Cap No. 49, Obadjiwan No. 15E, Rankin Location No. 15D and Thessalon No. 12.
Scarborough Centre
(Population: 115,260)
(Map 20)
Consists of that part of the City of Toronto described as follows: commencing at the intersection of Highway 401 (Macdonald-Cartier Freeway, Ontario 401 Express) and Markham Road; thence southerly along said road to the GO Transit rail line; thence southwesterly along said rail line to Eglinton Avenue East; thence westerly along said avenue to Warden Avenue; thence northerly along said avenue to Highway 401 (Macdonald-Cartier Freeway, Ontario 401 Express); thence easterly along said highway to the point of commencement.
Scarborough—Guildwood
(Population: 118,754)
(Map 20)
Consists of that part of the City of Toronto described as follows: commencing at the intersection of the easterly limit of said city and Highway 401 (Macdonald-Cartier Freeway, Ontario 401 Express); thence generally westerly along said highway to Markham Road; thence southerly along said road to the GO Transit rail line; thence easterly along said rail line to Scarborough Golf Club Road; thence southerly along said road to Hill Crescent; thence generally southwesterly along said crescent to Bethune Boulevard; thence southerly along said boulevard to Sylvan Avenue; thence northeasterly along said avenue to Rogate Place; thence southeasterly along Rogate Place and its southeasterly production to the southerly limit of said city; thence generally northeasterly and generally northwesterly along the southeasterly and northeasterly limits of said city to the point of commencement.
Scarborough Northwest
(Population: 109,568)
(Map 20)
Consists of that part of the City of Toronto described as follows: commencing at the intersection of the northerly limit of said city and McCowan Road; thence generally southerly along said road to the Canadian Pacific Railway; thence southwesterly along said railway to Midland Avenue; thence southerly along said avenue to Highway 401 (Macdonald-Cartier Freeway, Ontario 401 Express); thence southwesterly along said highway to Warden Avenue; thence northwesterly along said avenue to the electric power transmission line at approximate latitude 43°48′21″N and longitude 79°19′14″W; thence westerly along said transmission line to Pharmacy Avenue; thence northerly along said avenue to the northerly limit of said city; thence easterly along said limit to the point of commencement.
Scarborough—Rouge Park
(Population: 111,713)
(Map 20)
Consists of that part of the City of Toronto described as follows: commencing at the intersection of the easterly limit of said city and Highway 401 (Macdonald-Cartier Freeway, Ontario 401 Express); thence generally westerly along said highway to Midland Avenue; thence northerly along said avenue to the Canadian Pacific Railway; thence northeasterly along said railway to McCowan Road; thence generally northwesterly along said road to the northerly limit of said city; thence northeasterly and generally southeasterly along the northerly and easterly limits of said city to the point of commencement.
Scarborough Southwest
(Population: 121,947)
(Map 20)
Consists of that part of the City of Toronto described as follows: commencing at the intersection of the GO Transit rail line and Scarborough Golf Club Road; thence southerly along said road to Hill Crescent; thence southerly along said crescent to Bethune Boulevard; thence southerly along said boulevard to Sylvan Avenue; thence northeasterly along said avenue to Rogate Place; thence southeasterly along Rogate Place and its southeasterly production to the southeasterly limit of said city; thence generally southwesterly along said limit to its intersection with the southerly production of Victoria Park Avenue; thence northerly along said production and generally northerly along said avenue to Eglinton Avenue East; thence easterly along said avenue to the GO Transit rail line; thence northeasterly along said rail line to the point of commencement.
South Huron Shores
(Population: 118,316)
(Map 3)
Consists of:
- (a) the towns of Goderich and Saugeen Shores;
- (b) the municipalities of Bluewater, Central Huron, Huron East, Kincardine, Lambton Shores, Morris-Turnberry, North Middlesex and South Huron;
- (c) the townships of Ashfield-Colborne-Wawanosh, Huron-Kinloss, Lucan Biddulph and North Huron; and
- (d) Kettle Point Indian Reserve No. 44.
Spadina—Harbourfront
(Population: 119,497)
(Map 20)
Consists of that part of the City of Toronto described as follows: commencing at the intersection of the F.G. Gardiner Expressway and Parliament Street; thence southerly along said street to Lake Shore Boulevard East; thence southeasterly through the Inner Harbour and Eastern Channel to the mouth of said channel; thence southerly in a straight line to the southerly limit of said city at approximate latitude 43°36′45″N and longitude 79°20′39″W (south of the Outer Harbour East Headland [Tommy Thompson Park]); thence northwesterly, generally southwesterly and generally northwesterly along said limit to a point in Brigantine Cove at approximate latitude 43°37′38″N and longitude 79°24′31″W; thence northerly in a straight line to Remembrance Drive at approximate latitude 43°37′54″N and longitude 79°24′32″W; thence northerly and northwesterly along said drive to Strachan Avenue; thence northerly along said avenue to the GO Transit rail line and the Canadian Pacific Railway (north of East Liberty Street); thence westerly along said rail line to Queen Street West; thence easterly along said street to Ossington Avenue; thence northerly along said avenue to Dundas Street West; thence generally easterly along said street to Yonge Street; thence southerly along said street to the F.G. Gardiner Expressway; thence easterly along said expressway to the point of commencement.
St. Catharines
(Population: 119,873)
(Map 18)
Consists of that part of the City of St. Catharines lying easterly of a line described as follows: commencing at the intersection of the southerly limit of said city and the southerly production of First Street Louth; thence northerly along said production and said street to Twelve Mile Creek; thence generally northeasterly and generally northwesterly along said creek to Highway 406; thence westerly and generally northerly along said highway to Queen Elizabeth Way; thence westerly along Queen Elizabeth Way to Third Street Louth; thence northerly along said street and along Courtleigh Road and its northerly production to the northerly limit of said city (Lake Ontario).
St. Clair—Mount Pleasant
(Population: 119,935)
(Map 20)
Consists of that part of the City of Toronto described as follows: commencing at the intersection of Eglinton Avenue East and Laird Drive; thence southerly along said drive to Southvale Drive; thence easterly and southeasterly along Millwood Road to the Don River; thence generally southwesterly along said river to Pottery Road; thence northwesterly and southwesterly along said road to Bayview Avenue; thence generally northerly and westerly along said avenue to the Canadian Pacific Railway; thence southwesterly along said railway to an unnamed creek at approximate latitude 43°41′26″N and longitude 79°22′16″W; thence generally northwesterly along said creek to the easterly production of St. Clair Avenue East; thence westerly along said production, St. Clair Avenue East and St. Clair Avenue West to Avenue Road; thence southerly along said road to the Canadian Pacific Railway; thence southwesterly along said railway to Dovercourt Road; thence northerly along said road to Davenport Road; thence easterly along said road to Oakwood Avenue; thence northerly along said avenue to St. Clair Avenue West; thence easterly along said avenue to Oakwood Avenue; thence northerly along said avenue to Eglinton Avenue West; thence easterly along said avenue and Eglinton Avenue East to the point of commencement.
Stormont—Dundas—Glengarry
(Population: 114,637)
(Map 4)
Consists of:
- (a) the City of Cornwall;
- (b) the Municipality of South Dundas;
- (c) the townships of North Dundas, North Glengarry, North Stormont, South Glengarry and South Stormont; and
- (d) the Akwesasne Indian Reserve No. 59.
Sudbury
(Population: 113,618)
(Map 10)
Consists of that part of the City of Greater Sudbury described as follows: commencing at a point on the easterly limit of said city at approximate latitude 46°37′29″N and longitude 80°41′39″W; thence southerly along said limit to the southerly limit of said city; thence generally westerly and northerly along the southerly and westerly limits of said city to a point in Simon Lake at approximate latitude 46°24′08″N and longitude 81°10′56″W; thence northerly in a straight line to Highway 144 (North-West Bypass); thence generally northerly along said highway to a point at approximate latitude 46°30′37″N and longitude 81°11′59″W; thence easterly in a straight line to the easterly limit of Snider Geographic Township; thence northerly along said limit to the northerly limit of said geographic township; thence easterly along the northerly limit of McKim Geographic Township to the intersection of Maley Drive and Barry Downe Road; thence northerly along Barry Downe Road and along its northerly production to the intersection of Notre Dame Avenue and Bodson Drive West; thence easterly along Bodson Drive East and along its easterly production to the easterly limit of Capreol Geographic Township; thence northerly along said limit to Old Poupore Mine Road; thence generally easterly along said road to Nickel Rim South Mine Road; thence generally southeasterly along said road to Pipeline Road; thence easterly and generally southerly along said road to the northerly limit of Falconbridge Geographic Township; thence easterly along said limit to the point of commencement.
Taiaiako’n—High Park
(Population: 119,421)
(Map 20)
Consists of that part of the City of Toronto described as follows: commencing at the intersection of St. Clair Avenue West and the GO Transit rail line; thence southeasterly and easterly along said rail line to Strachan Avenue; thence southerly along said avenue to Remembrance Drive; thence easterly and southwesterly along said drive to approximate latitude 43°37′54″N and longitude 79°24′32″W; thence southerly in a straight line to the southerly limit of said city (Lake Ontario) at approximate latitude 43°37′38″N and longitude 79°24′31″W; thence westerly and generally northwesterly along said limit to the mouth of the Humber River; thence generally northwesterly along said river to the Canadian Pacific Railway; thence northeasterly and easterly along said railway to Scarlett Road; thence northerly along said road to St. Clair Avenue West; thence easterly along said avenue to the point of commencement.
The Beaches—East York
(Population: 111,805)
(Map 20)
Consists of that part of the City of Toronto described as follows: commencing at the intersection of Eglinton Avenue East and Victoria Park Avenue; thence generally southerly along Victoria Park avenue and its southerly production to the southerly limit of said city (Lake Ontario); thence generally southwesterly along said limit to approximate latitude 43°38′54″N and longitude 79°18′51″W; thence northerly in a straight line to the mouth of Ashbridges Bay (Lake Ontario); thence generally northwesterly through said bay to its northerly shoreline at approximate latitude 43°39′43″N and longitude 79°18′55″W; thence northeasterly in a straight line to the intersection of Lake Shore Boulevard East and Coxwell Avenue; thence northerly along said avenue to the GO Transit rail line; thence northeasterly along said rail line to the southerly production of Hillingdon Avenue; thence northerly along said production and said avenue to Danforth Avenue; thence easterly along said avenue to Glebemount Avenue; thence generally northerly along said avenue to O’Connor Drive; thence easterly and northeasterly along said drive to Taylor Creek; thence generally westerly along said creek to the Don Valley Parkway; thence generally northerly along said parkway to Eglinton Avenue East; thence northeasterly and easterly along said avenue to the point of commencement.
Thunder Bay—Superior North
(Population: 99,035)
(Map 1)
Consists of:
- (a) that part of the City of Thunder Bay lying northerly of a line described as follows: commencing at the intersection of the westerly limit of said city and Arthur Street West; thence generally easterly along said street to Highway 61 (Thunder Bay Expressway); thence generally northerly along said highway to Neebing River; thence generally northeasterly along said river to McIntyre River; thence generally easterly along said river to the westerly shoreline of Lake Superior; thence easterly in a straight line and along the northerly limit of said city to its easterly limit at approximate latitude 48°23′58″N and longitude 89°02′41″W;
- (b) the Town of Marathon;
- (c) the municipalities of Greenstone and Shuniah;
- (d) that part of the Municipality of Oliver Paipoonge lying northerly of a line described as follows: commencing at the intersection of the westerly limit of said municipality and Highway 11/17 (Trans-Canada Highway); thence generally southeasterly and easterly along said highway to Highway 130; thence easterly along said highway to Twin City Cross Road; thence generally easterly along Arthur Street and Arthur Street West to the easterly limit of said municipality;
- (e) the townships of Dorion, Manitouwadge, Nipigon, Red Rock, Schreiber and Terrace Bay;
- (f) that part of the Township of Conmee lying easterly of Highway 11/17 (Trans-Canada Highway);
- (g) that part of the Unorganized Area of Thunder Bay lying southerly and easterly of a line described as follows: commencing the intersection of the northerly limit of the Township of Conmee and Highway 11/17 (Trans-Canada Highway); thence generally northwesterly along said highway to Highway 17 (Trans-Canada Highway); thence northerly and northwesterly along said highway to Dog River Road; thence generally northerly along said road to Pakashkan Road; thence generally northerly along said road to Chisamore Road; thence northerly along said road to its intersection with an unnamed road at approximate latitude 49°18′30″N and longitude 89°58′13″W; thence generally northerly and westerly along said road to a point at approximate latitude 49°20′59″N and longitude 89°59′55″W; thence northerly in a straight line to a point at approximate latitude 49°51′53″N and longitude 90°00′00″W; thence easterly in a straight line to the southwesternmost point of Gull River Indian Reserve No. 55; thence easterly along the southerly boundary of said Indian reserve to the westerly shoreline of Lake Nipigon (Gull Bay); thence northerly and southerly along said bay and generally northeasterly along the westerly shoreline of Lake Nipigon to a point at approximate latitude 50°17′01″N and longitude 88°39′00″ W; thence northerly in a straight line to a point at approximate latitude 50°30′00″N and longitude 88°38′50″W; thence easterly in a straight line to the easterly limit of said unorganized area;
- (h) the Indian reserves of Ginoogaming First Nation, Lake Helen No. 53A, Lake Nipigon, Long Lake No. 58, Pays Plat No. 51, Pic Mobert North, Pic Mobert South, Pic River No. 50, Red Rock No. 53, Rocky Bay No. 1 and Sand Point First Nation; and
- (i) the Indian Settlement of Aroland.
Toronto Centre
(Population: 121,703)
(Map 20)
Consists of that part of the City of Toronto described as follows: commencing at the intersection of Bloor Street East and the Don River; thence generally southeasterly along said river to the Don Valley Parkway northbound; thence southwesterly along said parkway to the F.G. Gardiner Expressway; thence generally westerly along said expressway to Yonge Street; thence northerly along said street to Bloor Street East; thence generally easterly along said street to the point of commencement.
Toronto—Danforth
(Population: 112,119)
(Map 20)
Consists of that part of the City of Toronto described as follows: commencing at the intersection of Taylor Creek and O’Connor Drive; thence southwesterly and westerly along said drive to Glebemount Avenue; thence generally southerly along said avenue to Danforth Avenue; thence westerly along said avenue to Hillingdon Avenue; thence southerly along said avenue and its southerly production to the GO Transit rail line; thence southwesterly along said rail line to Coxwell Avenue; thence southerly along said avenue to Lake Shore Boulevard East; thence southwesterly in a straight line to the northerly shoreline of Ashbridges Bay at approximate latitude 43°39′43″N and longitude 79°18′55″W; thence generally southeasterly through said bay to its mouth (Lake Ontario); thence southerly in a straight line to the southerly limit of said city at approximate latitude 43°38′54″N and longitude 79°18′51″W; thence generally southwesterly along said limit to the southerly corner of the City of Toronto (south of the Outer Harbour East Headland [Tommy Thompson Park]); thence northerly in a straight line to the mouth of the Eastern Channel; thence northwesterly through said channel and the Inner Harbour to the intersection of Parliament Street and Lake Shore Boulevard East; thence northerly along said street to the F.G. Gardiner Expressway; thence generally northeasterly along said expressway and Don Valley Parkway to the Don River; thence generally northerly and generally easterly along said river and along the Don River East Branch to Taylor Creek; thence generally easterly along said creek to the point of commencement.
University—Rosedale
(Population: 117,119)
(Map 20)
Consists of that part of the City of Toronto described as follows: commencing at the intersection of the Canadian Pacific Railway and Bayview Avenue; thence easterly and generally southerly along said avenue to Pottery Road; thence northeasterly and southeasterly along said road to the Don River; thence generally southerly along said river to Bloor Street East; thence generally westerly along said street to Yonge Street; thence southerly along said street to Dundas Street West; thence generally westerly along said street to Ossington Avenue; thence northerly along said avenue to the Canadian Pacific Railway; thence easterly along said railway to Avenue Road; thence northerly along said road to St. Clair Avenue West; thence easterly along said avenue, St. Clair Avenue East and its easterly production to an unnamed creek at approximate latitude 43°41′32″N and longitude 79°22′25″W; thence generally southeasterly along said creek to the Canadian Pacific Railway; thence northeasterly along said railway to the point of commencement.
Vaughan—Thornhill
(Population: 119,771)
(Map 22)
Consists of:
- (a) that part of the City of Markham described as follows: commencing at the intersection of the northerly limit of said city and Bayview Avenue; thence southerly along said avenue to John Street; thence westerly along said street to the Don River (East Branch); thence generally northwesterly along said river to the westerly limit of said city; thence northerly and easterly along the westerly and northerly limits of said city to the point of commencement; and
- (b) that part of the City of Vaughan described as follows: commencing at the intersection of the easterly limit of said city and Major Mackenzie Drive West; thence westerly along said drive to Peter Rupert Avenue; thence southerly along said avenue to Rutherford Road; thence westerly along said road to Highway 400; thence southerly along said highway to the southerly limit of said city; thence easterly and generally northerly along the southerly and easterly limits of said city to the point of commencement.
Vaughan—Woodbridge
(Population: 115,957)
(Map 22)
Consists of that part of the City of Vaughan described as follows: commencing at the intersection of the southerly limit of said city and Highway 400; thence northerly along said highway to Major Mackenzie Drive West; thence westerly and southwesterly along said drive to Saint Padre Pio Gardens; thence generally westerly along Saint Padre Pio Gardens, its westerly production and Humber Bridge Trail to Highway 27; thence northerly along said highway to Nashville Road; thence generally westerly along said road to the westerly limit of said city; thence southeasterly and easterly along the westerly and southerly limits of said city to the point of commencement.
Waterloo
(Population: 121,436)
(Map 8)
Consists of the City of Waterloo.
Wellington—Halton
(Population: 111,155)
(Map 3)
Consists of:
- (a) that part of the City of Guelph lying southerly and easterly of a line described as follows: commencing at the intersection of Fife Road and Wellington Street West; thence northerly along said street to Hanlon Parkway; thence easterly and southeasterly along said parkway to Hanlon’s Creek at approximate latitude 43°30′13″N and longitude 80°13′51″W; thence generally northeasterly along said creek to approximate latitude 43°30′46″N and longitude 80°12′13″W; thence northeasterly in a straight line to Gordon Street; thence northeasterly along Arkell Road to the easterly limit of said city;
- (b) the Town of Erin;
- (c) that part of the Town of Halton Hills lying northwesterly of a line described as follows: commencing at the intersection of the northerly limit of said town and 22 Side Road; thence southwesterly along said road and its intermittent production to Highway 7; thence southeasterly along said highway and along Trafalgar Road to 15 Side Road; thence generally southwesterly along said road to the southwesterly limit of said town;
- (d) that part of the Town of Milton lying northwesterly of 15 Side Road; and
- (e) the townships of Centre Wellington, East Garafraxa, Guelph/Eramosa and Puslinch.
Whitby
(Population: 120,078)
(Map 9)
Consists of:
- (a) that part of the City of Oshawa described as follows: commencing at the intersection of the westerly limit of said city and Rossland Road West; thence easterly along said road to Oshawa Creek; thence generally northwesterly along said creek to Highway 407; thence southwesterly along said highway to the westerly limit of said city; thence southerly along said limit to the point of commencement; and
- (b) that part of the Town of Whitby lying southerly of Highway 407.
Windsor—Tecumseh
(Population: 122,533)
(Maps 3 and 21)
Consists of:
- (a) that part of the City of Windsor lying easterly of a line described as follows: commencing at the intersection of the northerly limit of said city with the northerly production of Walker Road; thence southerly along said production and Walker Road to Turkey Creek; thence generally southwesterly along said creek to E.C. Row Expressway; thence westerly along said expressway to Howard Avenue; thence southeasterly along said avenue, Division Road and Provincial Road to the southerly limit of said city; and
- (b) that part of the Town of Tecumseh lying northerly of Highway 401 (MacDonald-Cartier Freeway).
Windsor West
(Population: 126,695)
(Map 21)
Consists of that part of the City of Windsor described as follows: commencing at the intersection of the northerly limit of said city with the northerly production of Walker Road; thence southerly along said production and Walker Road to Turkey Creek; thence generally southwesterly along said creek to E.C. Row Expressway; thence westerly along said expressway to Howard Avenue; thence southeasterly along said avenue, Division Road and Provincial Road to a point on the southerly limit of said city at approximate latitude 42°14′57″N and longitude 82°57′39″W; thence generally southwesterly and generally northeasterly along the southerly and southwesterly limits of said city to approximate latitude 42°15′10″N and longitude 83°02′09″W; thence northeasterly along Huron Church Road to E. C. Row Expressway; thence westerly and southerly along said expressway and Ojibway Parkway to Broadway Street; thence westerly along said street and its westerly production to the westerly limit of said city; thence generally northeasterly along said limit to the point of commencement.
York Centre
(Population: 112,580)
(Map 20)
Consists of that part of the City of Toronto described as follows: commencing at the intersection of the northerly limit of said city and Village Gate; thence southerly along said road to Greenwin Village Road; thence easterly along said road to Chelmsford Avenue; thence generally southerly along said avenue to Drewry Avenue; thence easterly along said avenue to Grantbrook Street; thence southerly along said street to Finch Avenue West; thence easterly along said avenue to Yonge Street; thence southerly along said street to Highway 401 (Macdonald-Cartier Freeway, Ontario 401 Express); thence southwesterly and westerly along said highway to Keele Street; thence northerly along said street to the northerly limit of said city; thence easterly along said limit to the point of commencement.
- Map 1 – Province of Ontario
- Map 2 – Central Ontario
- Map 3 – Southwestern Ontario
- Map 4 – Eastern Ontario
- Map 5 – City of Barrie
- Map 6 – City of Belleville
- Map 7 – County of Brant
- Map 8 – Cities of Cambridge, Kitchener and Waterloo
- Map 9 – Regional Municipality of Durham (part)
- Map 10 – City of Greater Sudbury
- Map 11 – City of Guelph
- Map 12 – Regional Municipality of Halton
- Map 13 – City of Hamilton
- Map 14 – City of Kingston
- Map 15 – City of London
- Map 16 – City of Ottawa
- Map 17 – Regional Municipality of Peel (part)
- Map 18 – Cities of St. Catharines and Thorold
- Map 19 – City of Thunder Bay
- Map 20 – City of Toronto
- Map 21 – City of Windsor
- Map 22 – Regional Municipality of York (part)
Map 1 – Province of Ontario
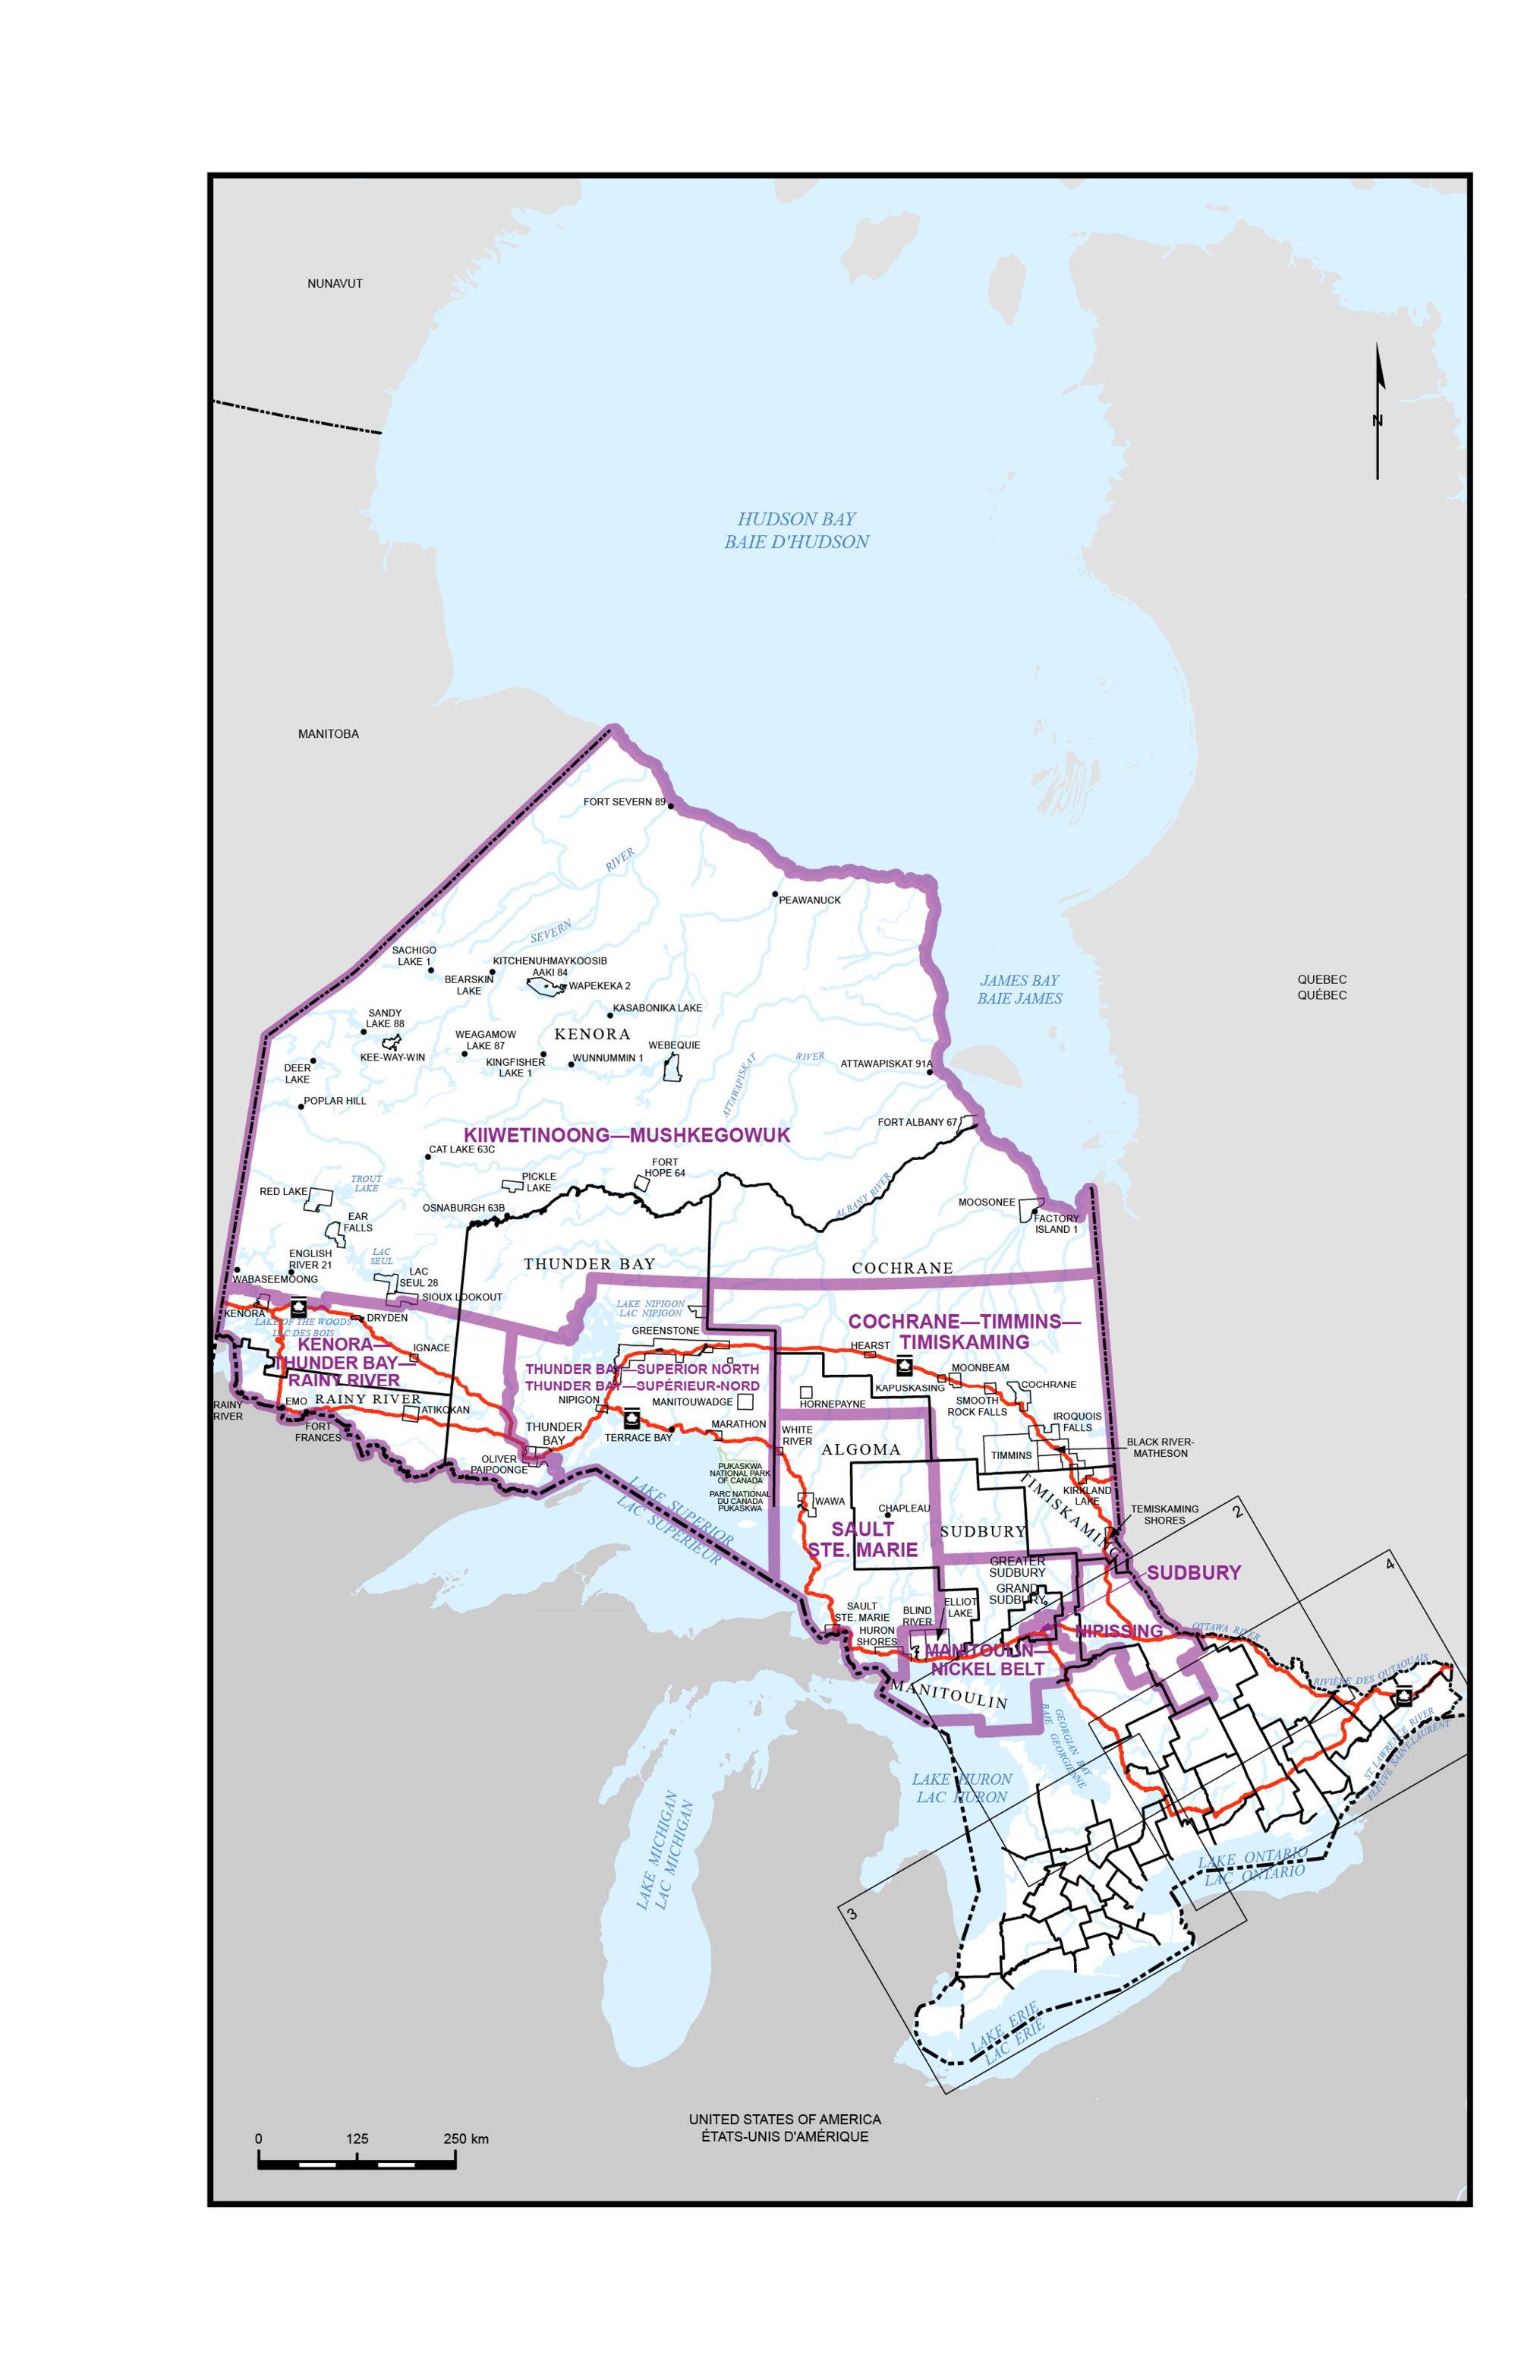
Map 2 – Central Ontario
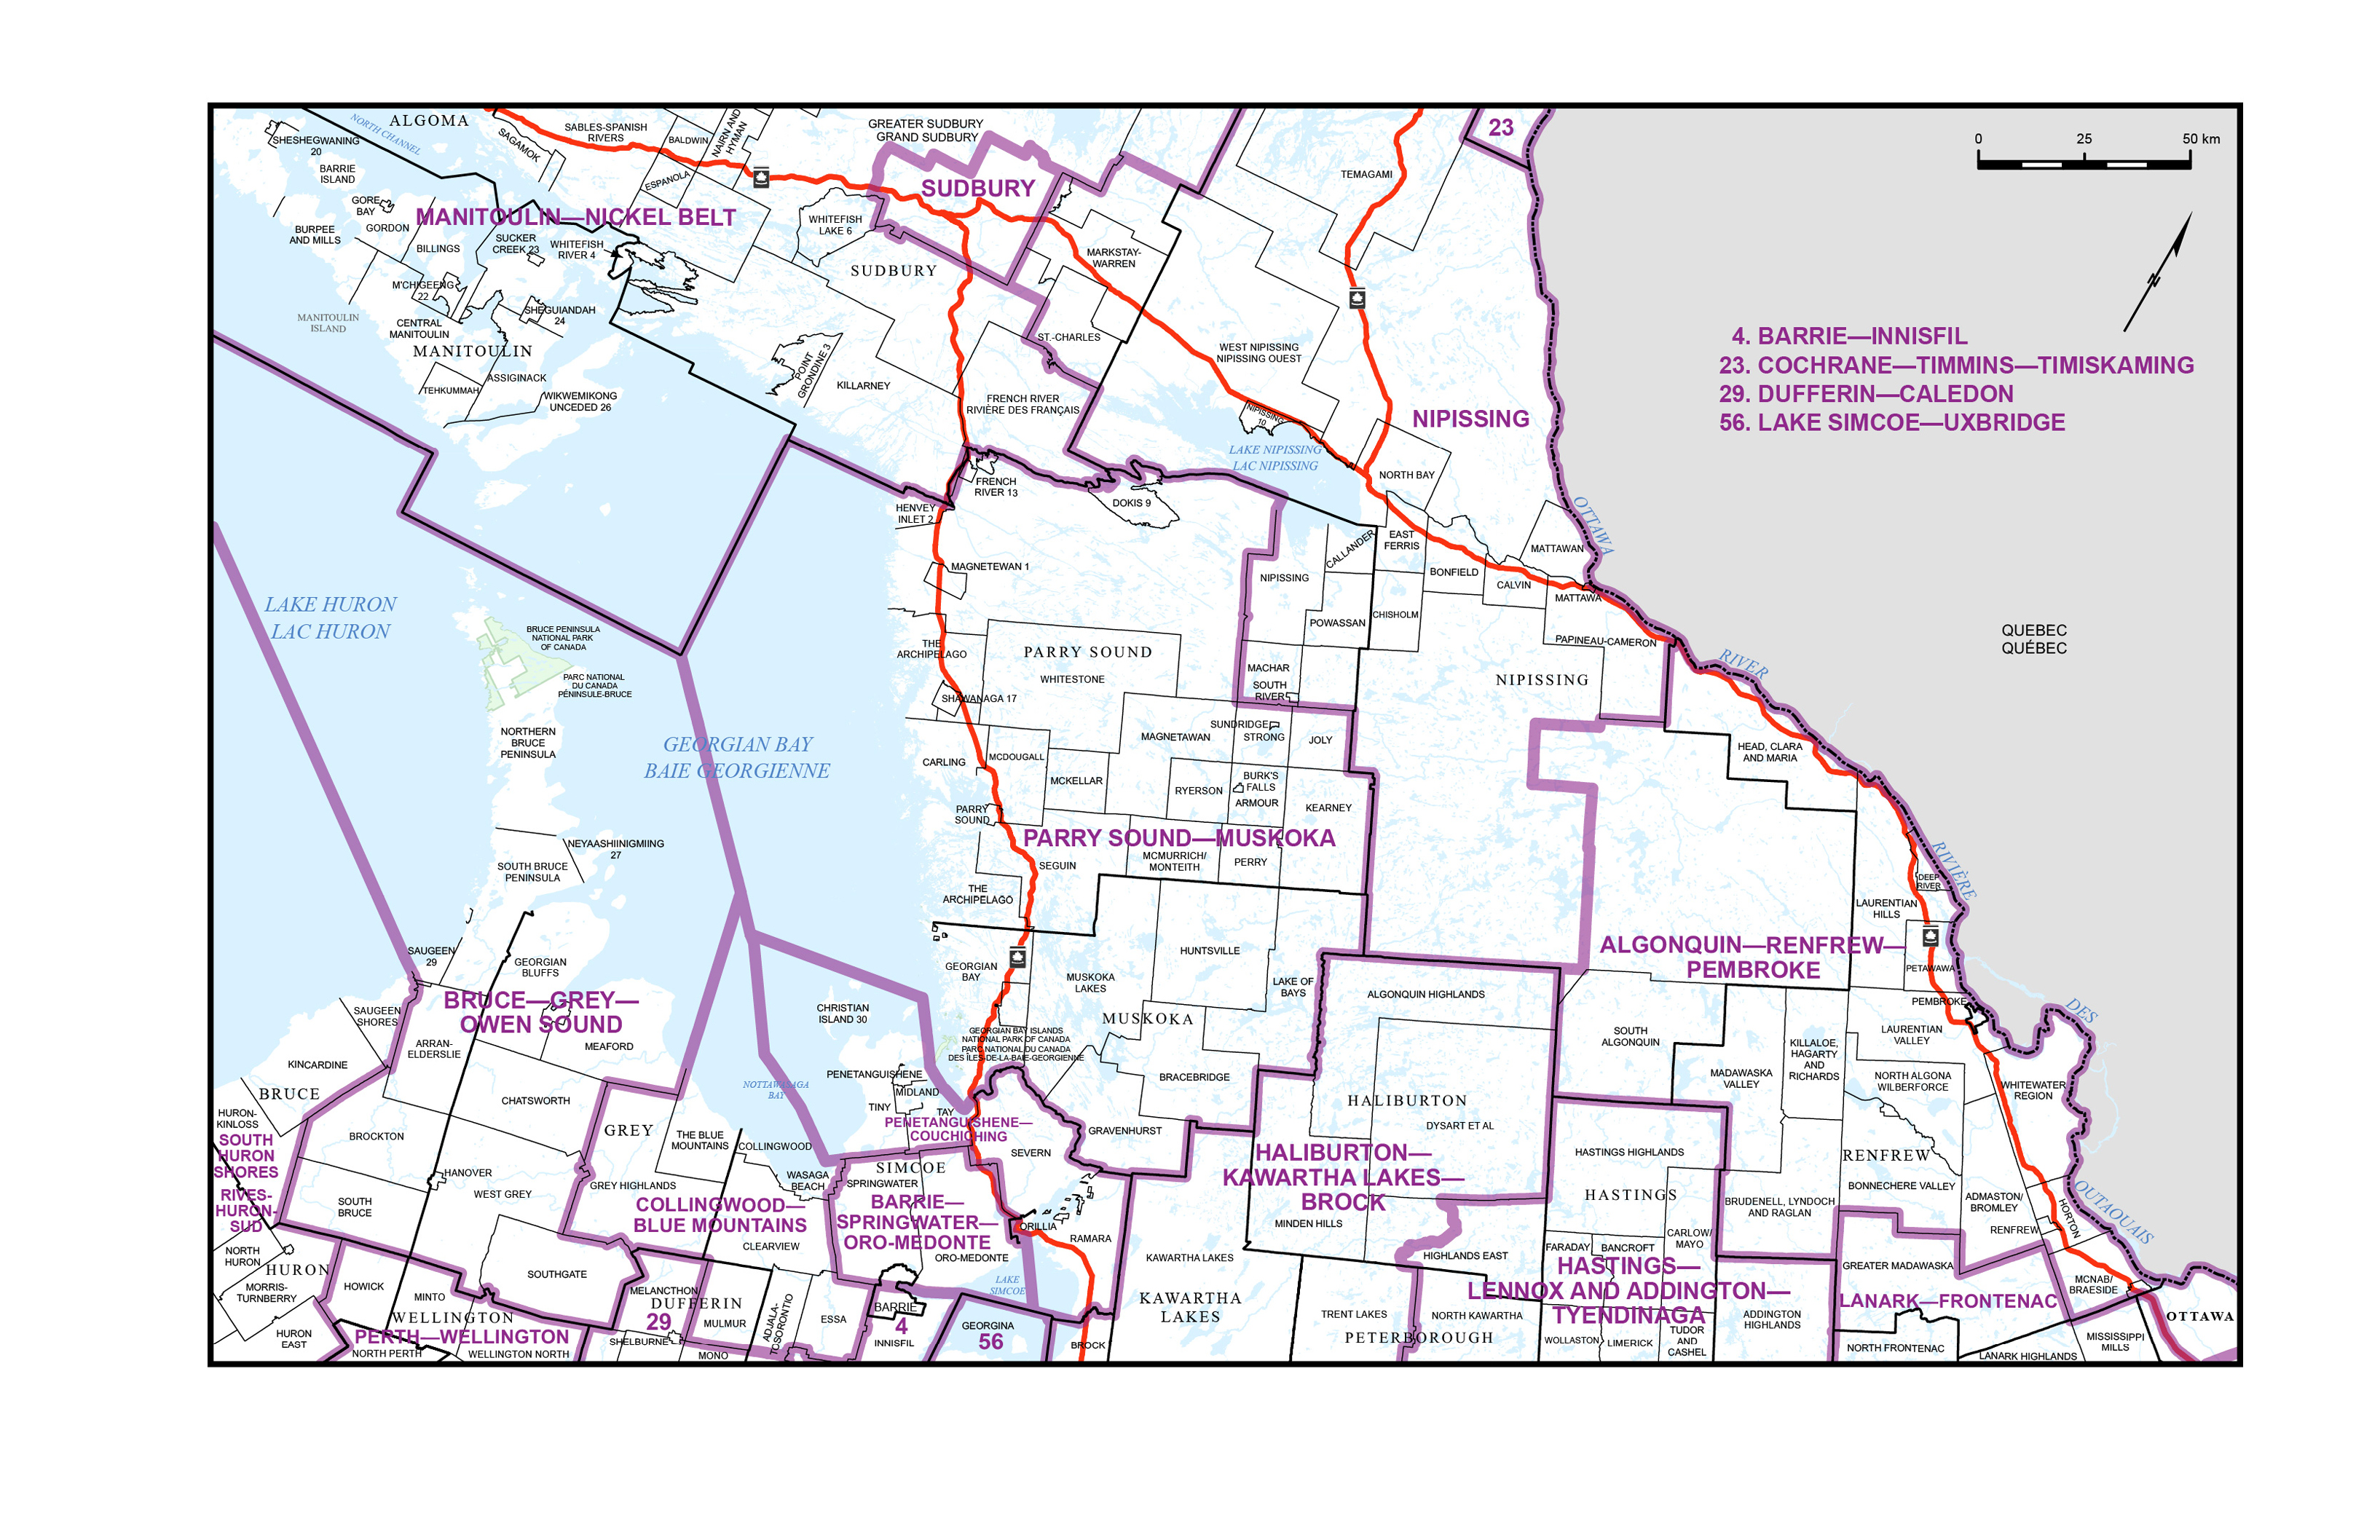
Map 3 – Southwestern Ontario
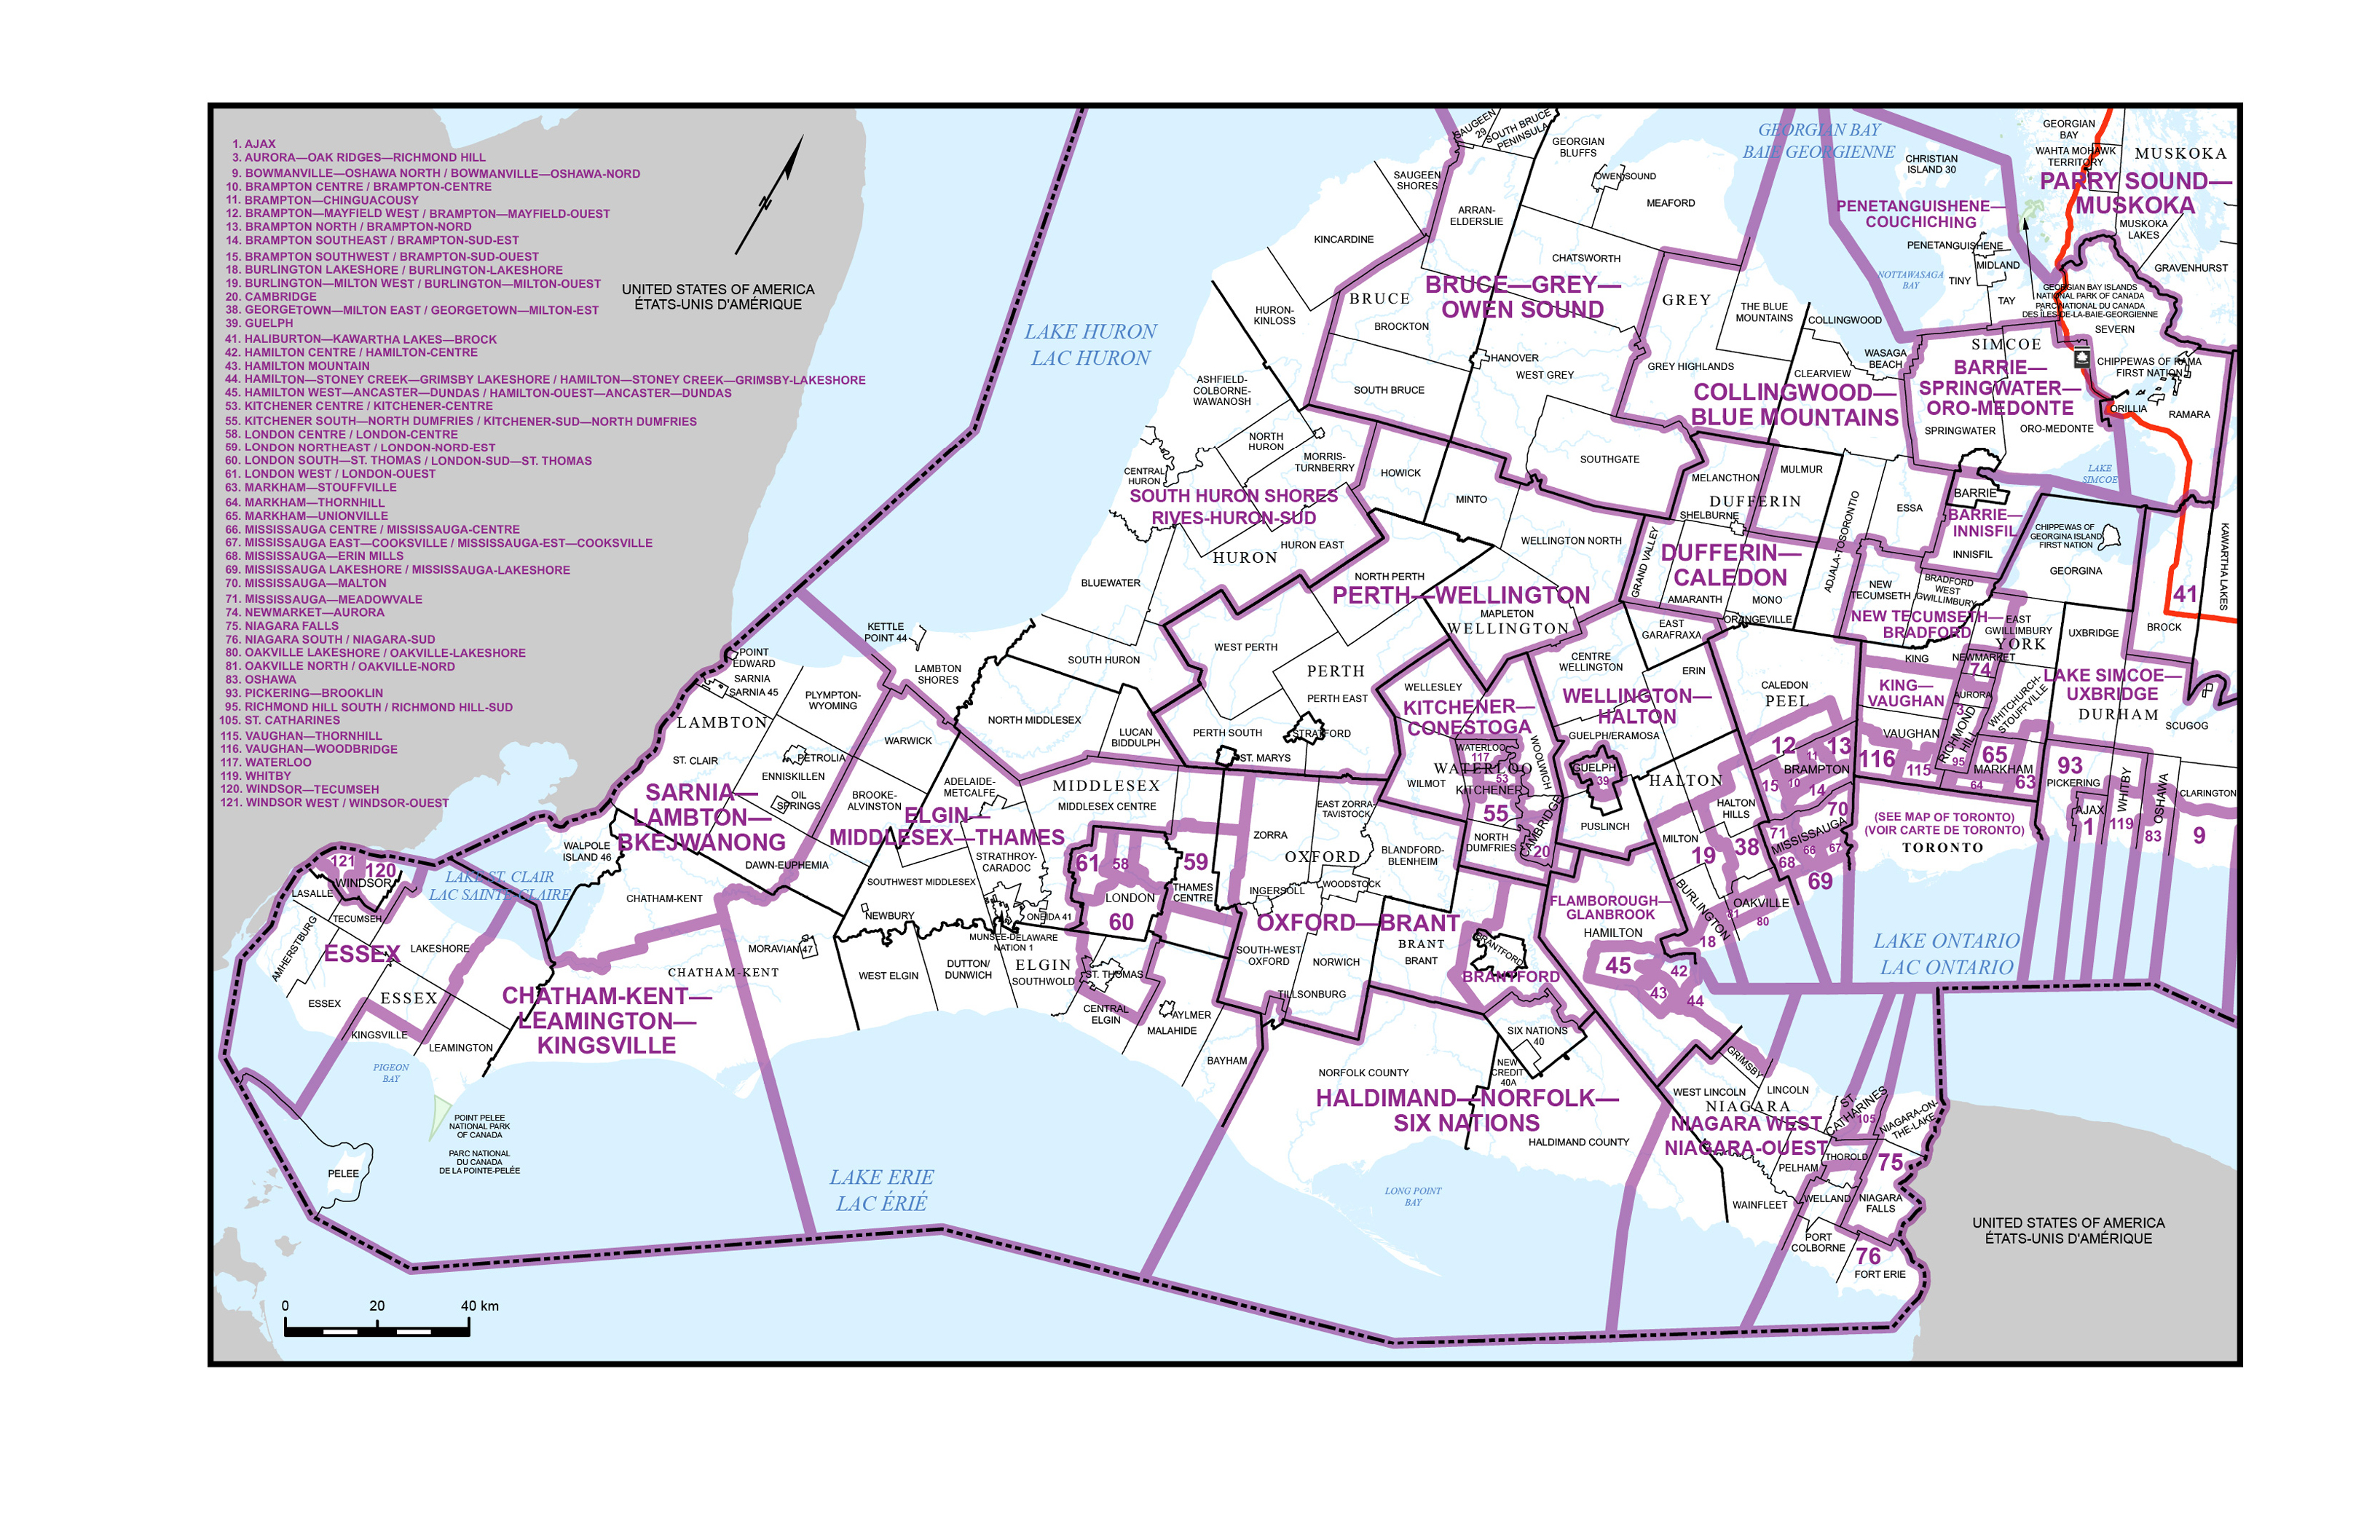
Map 4 – Eastern Ontario
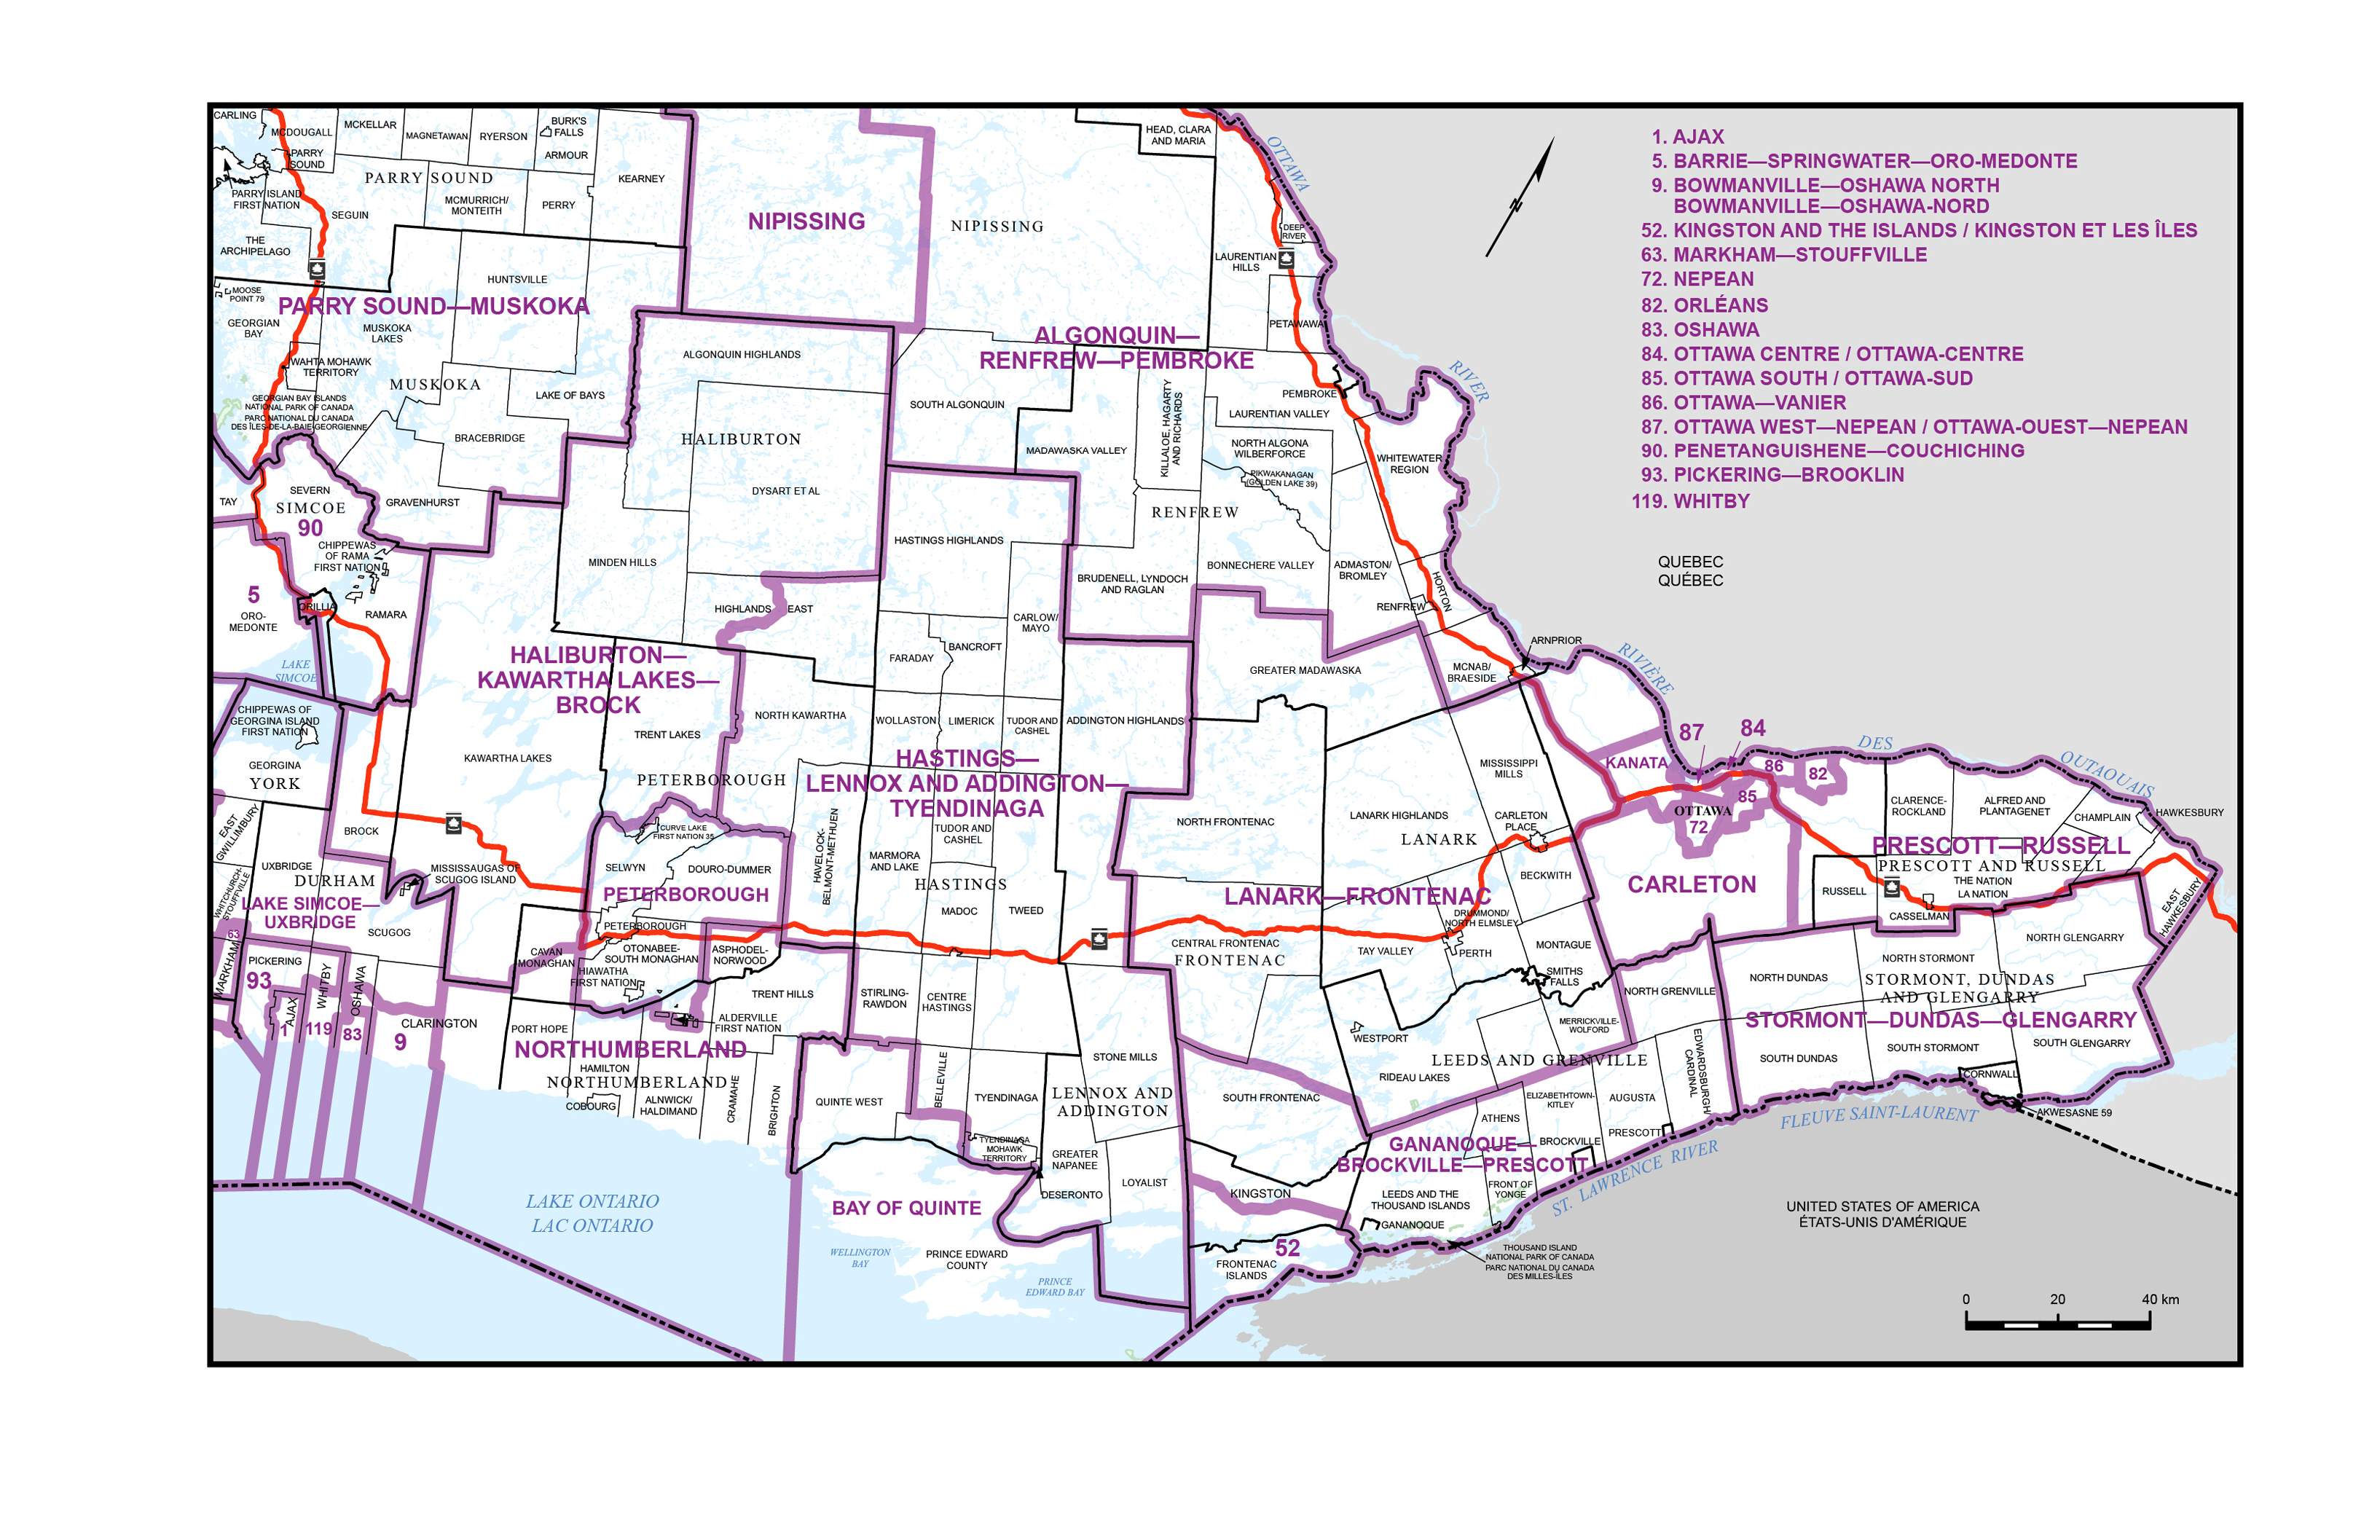
Map 5 – City of Barrie
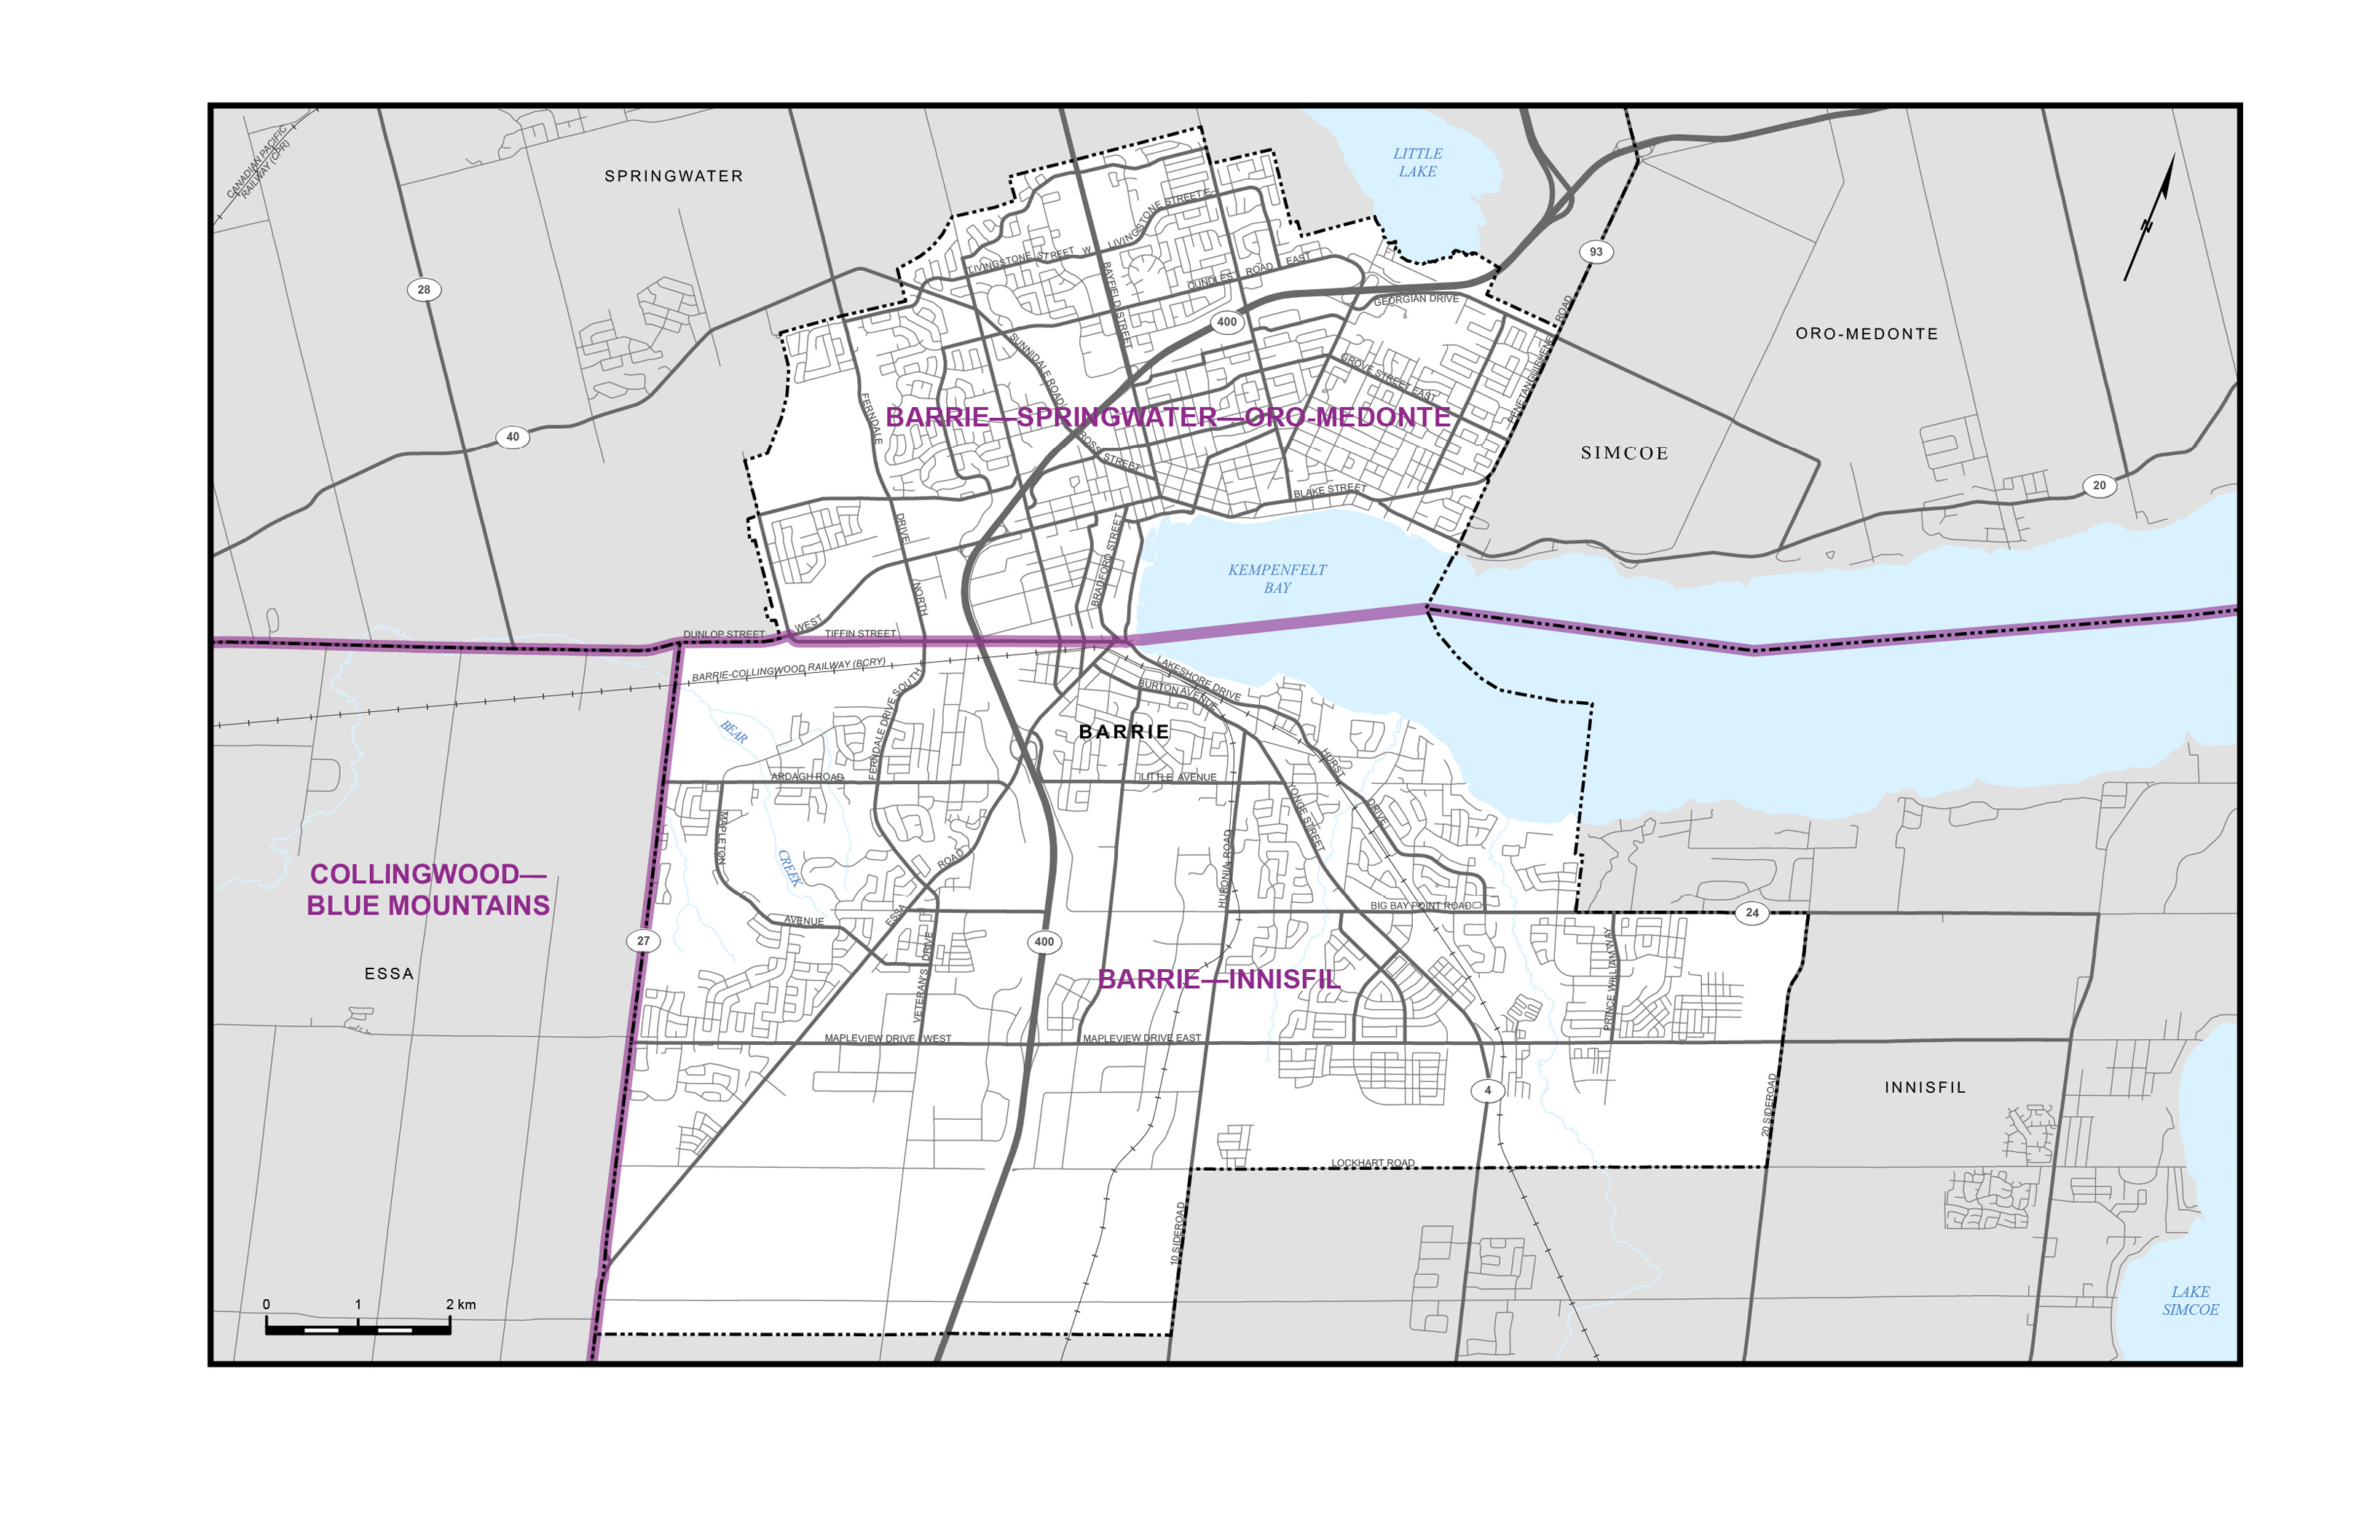
Map 6 – City of Belleville
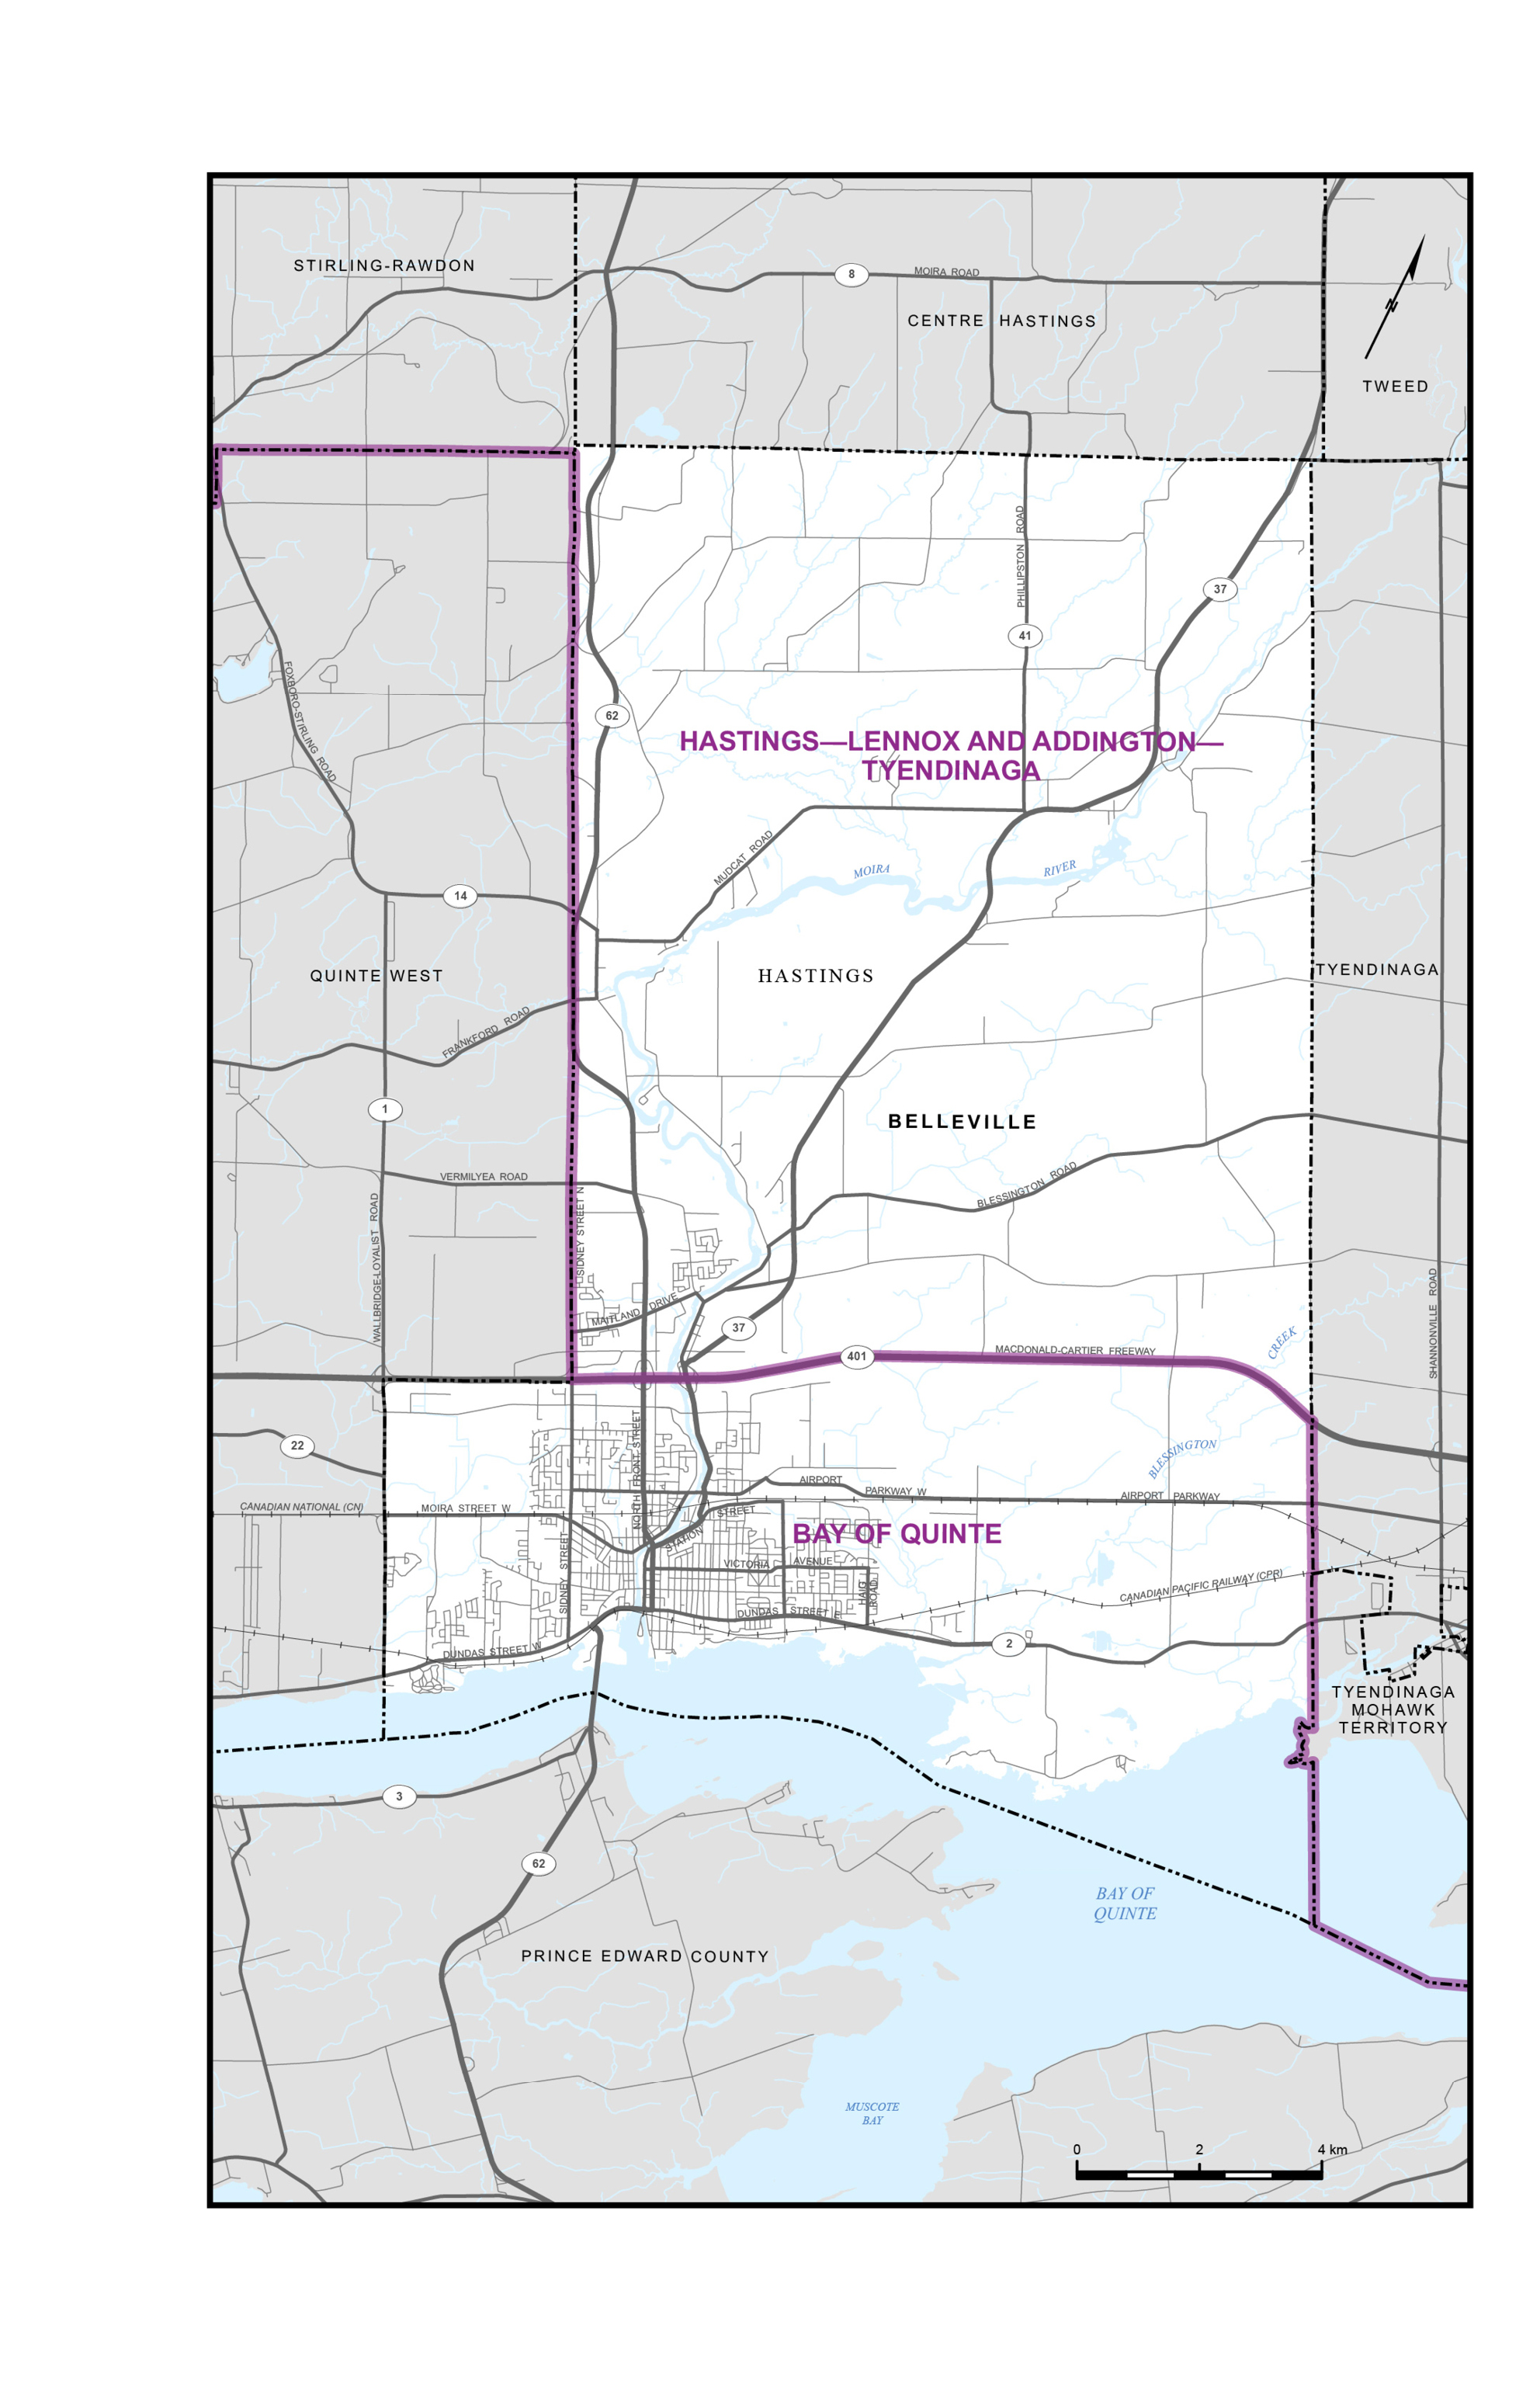
Map 7 – County of Brant
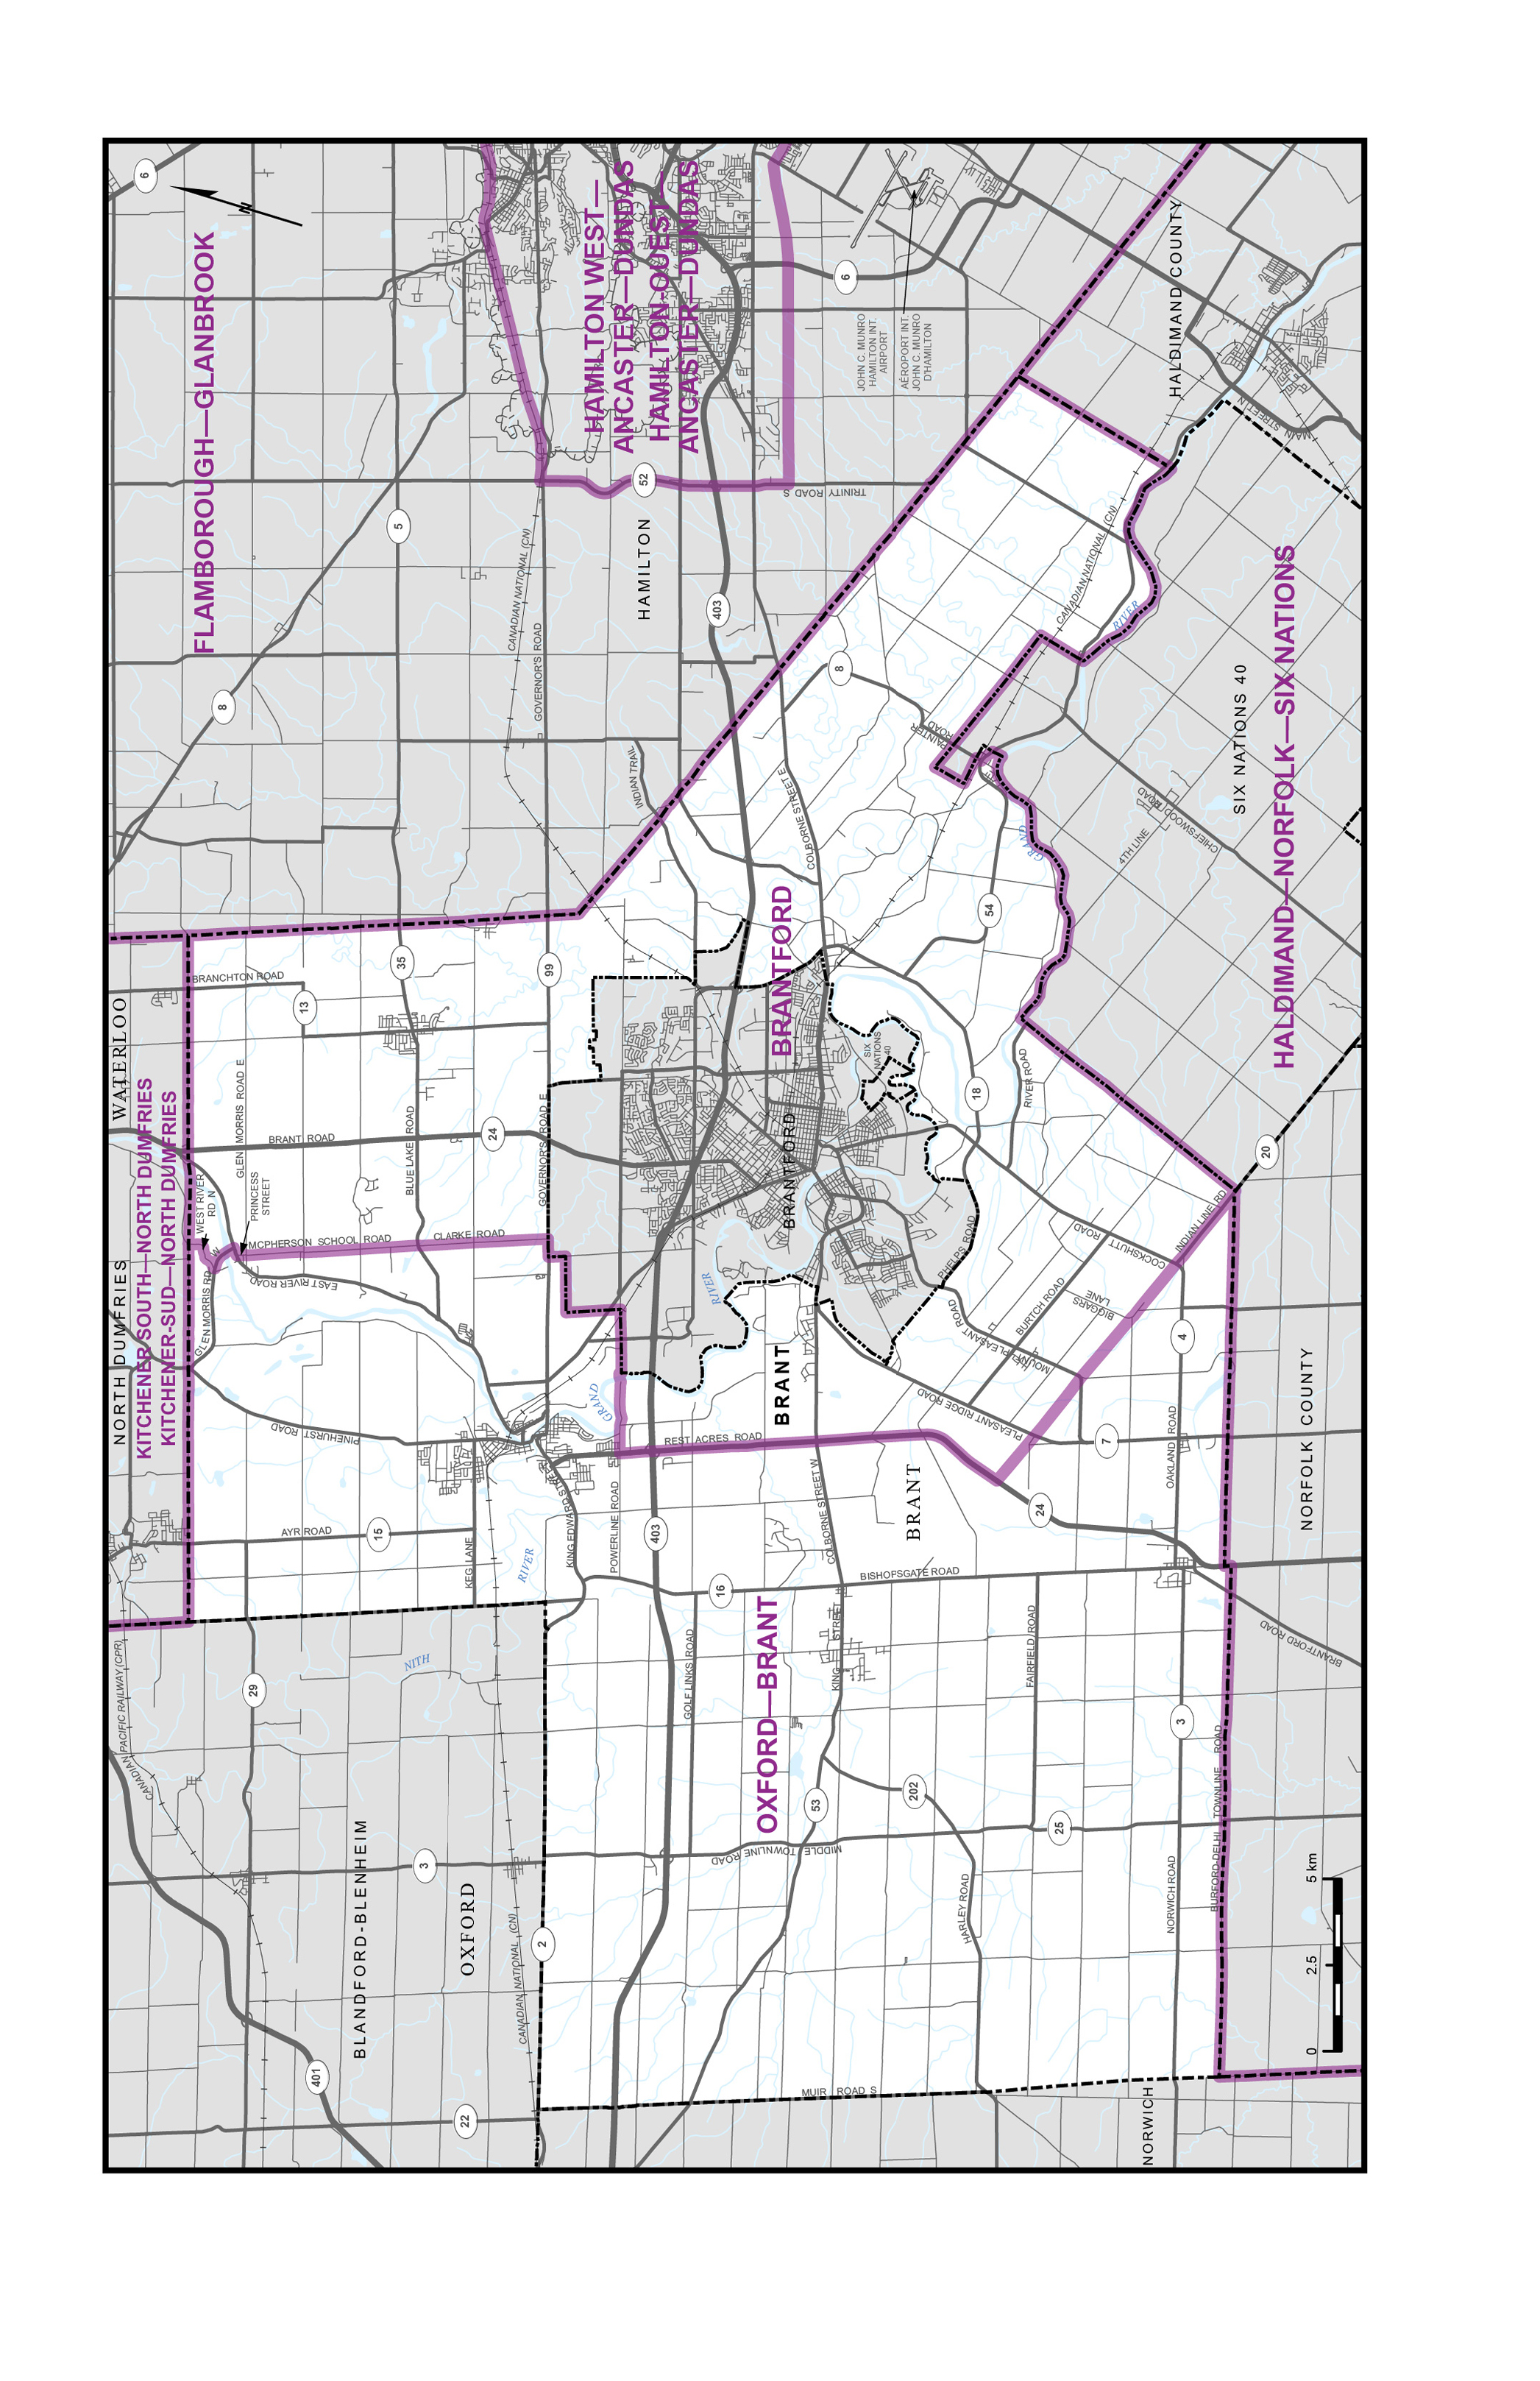
Map 8 – Cities of Cambridge, Kitchener and Waterloo
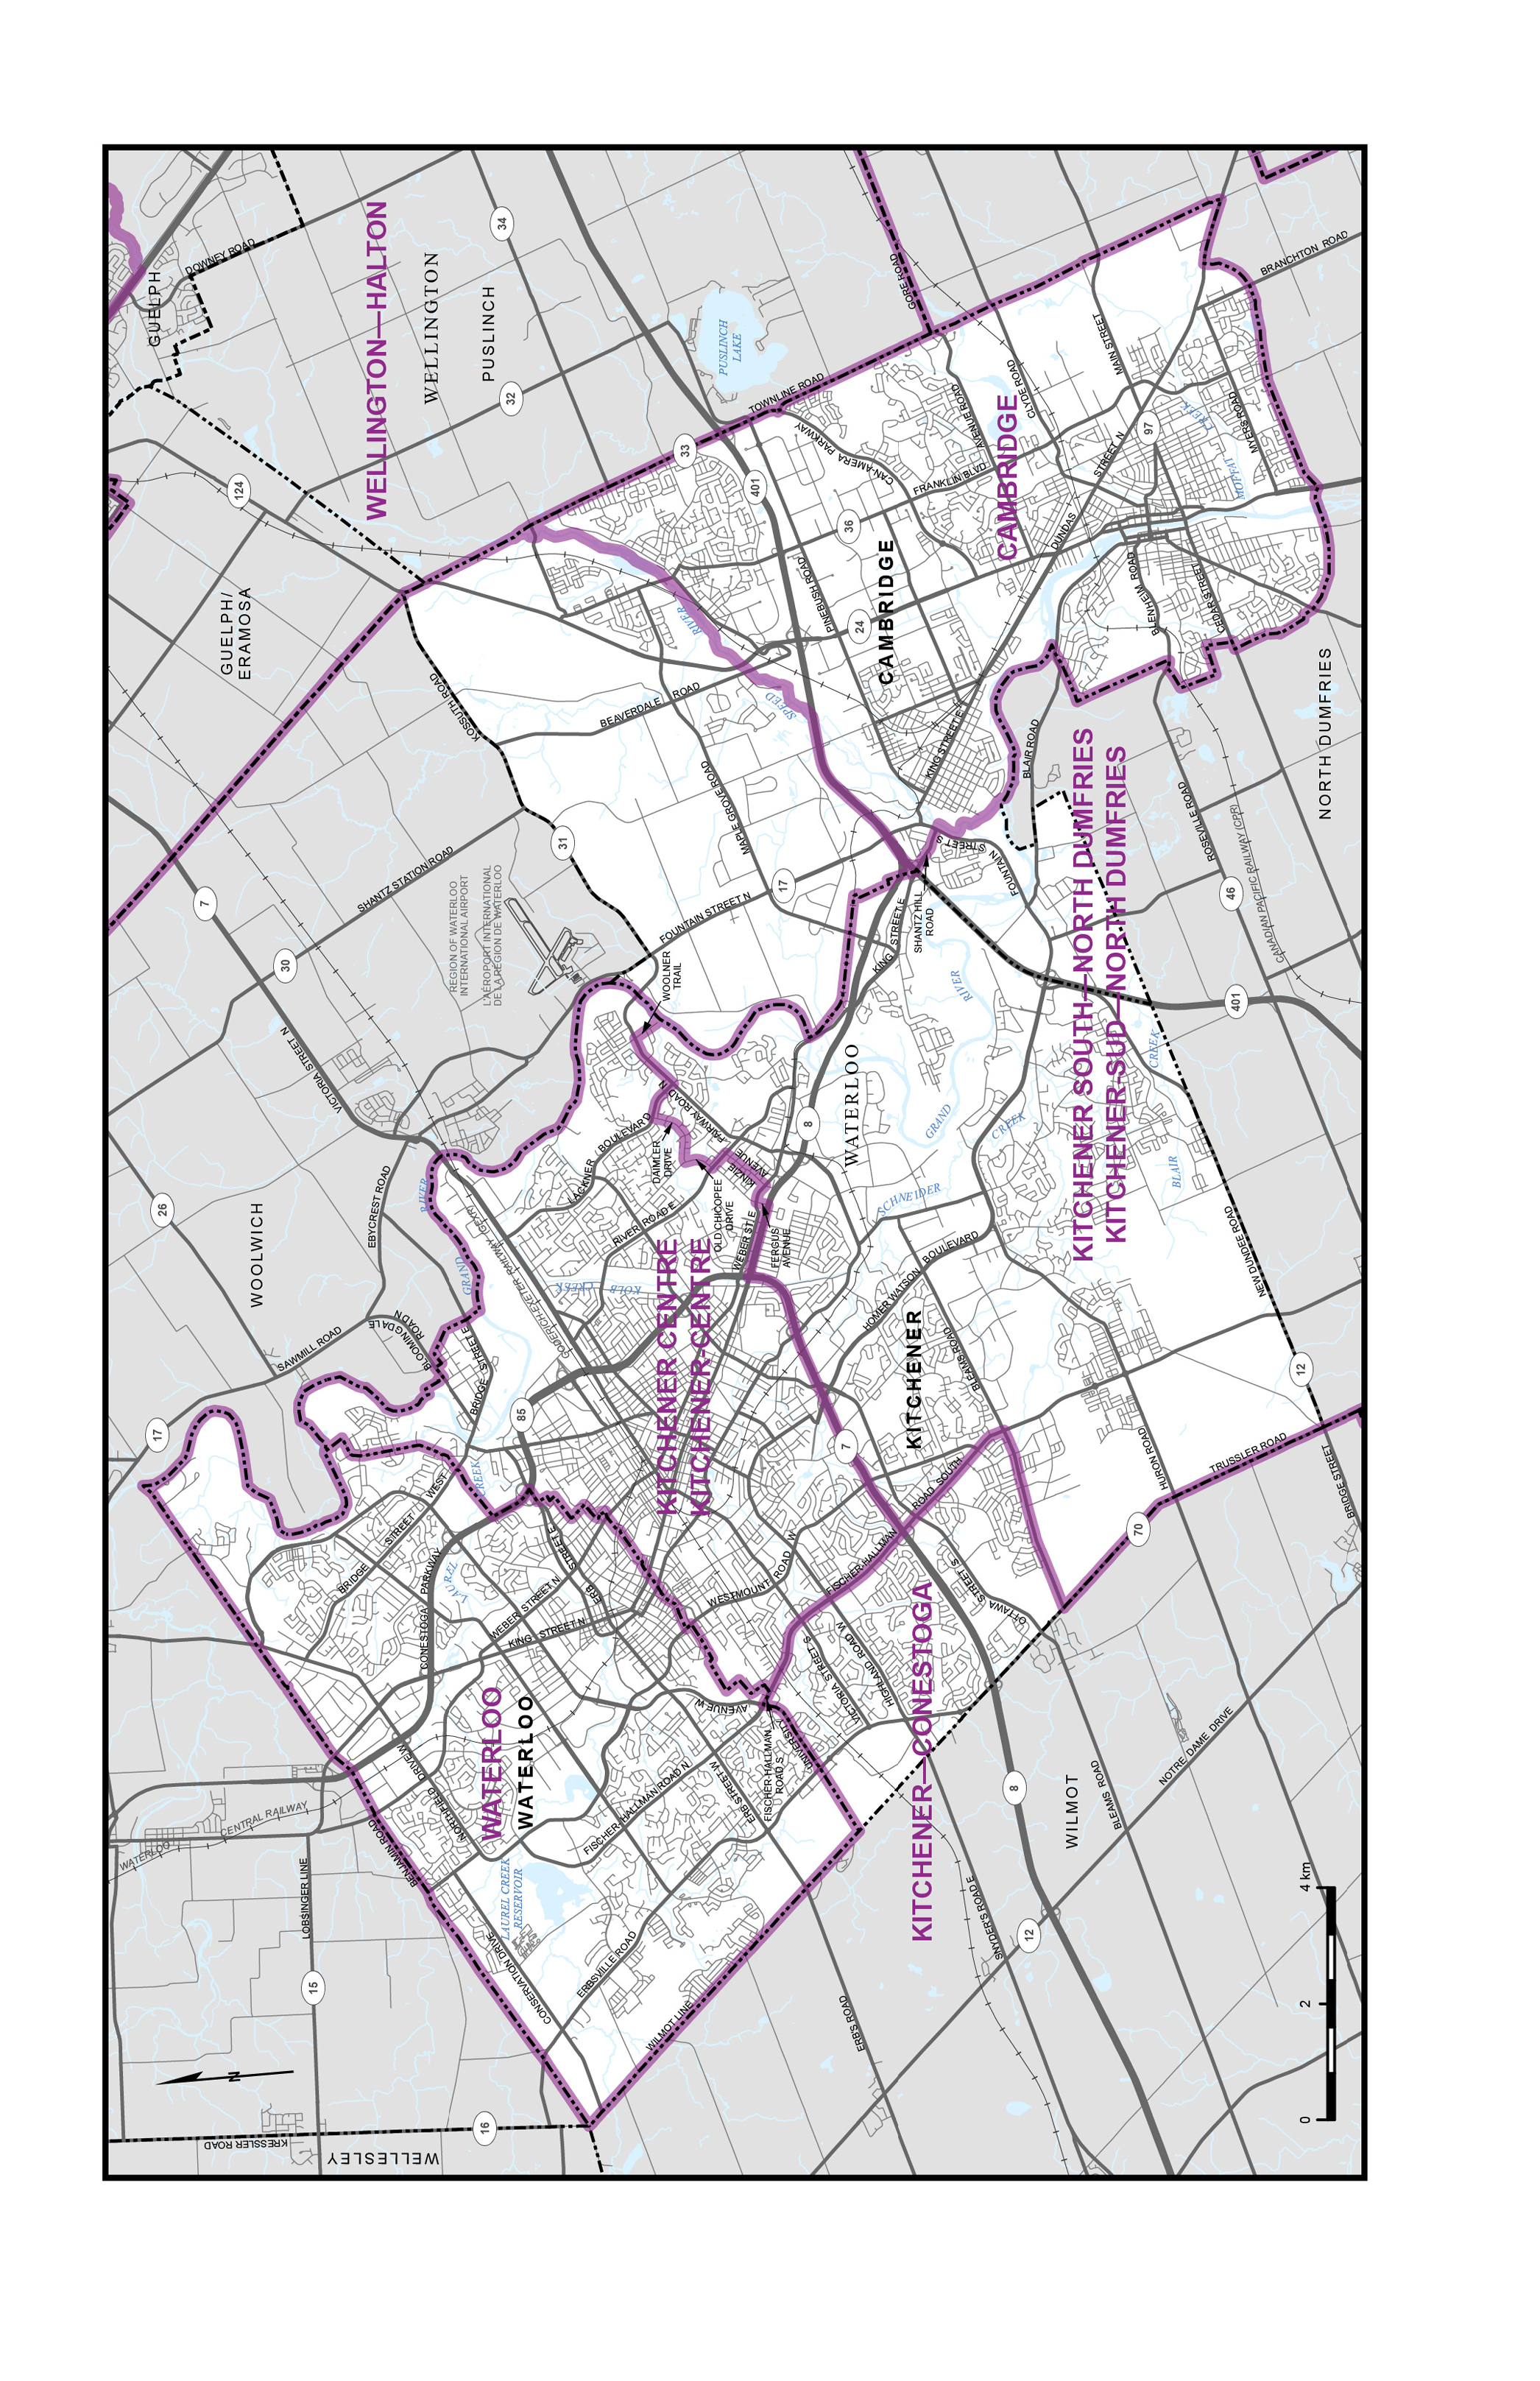
Map 9 – Regional Municipality of Durham (part)
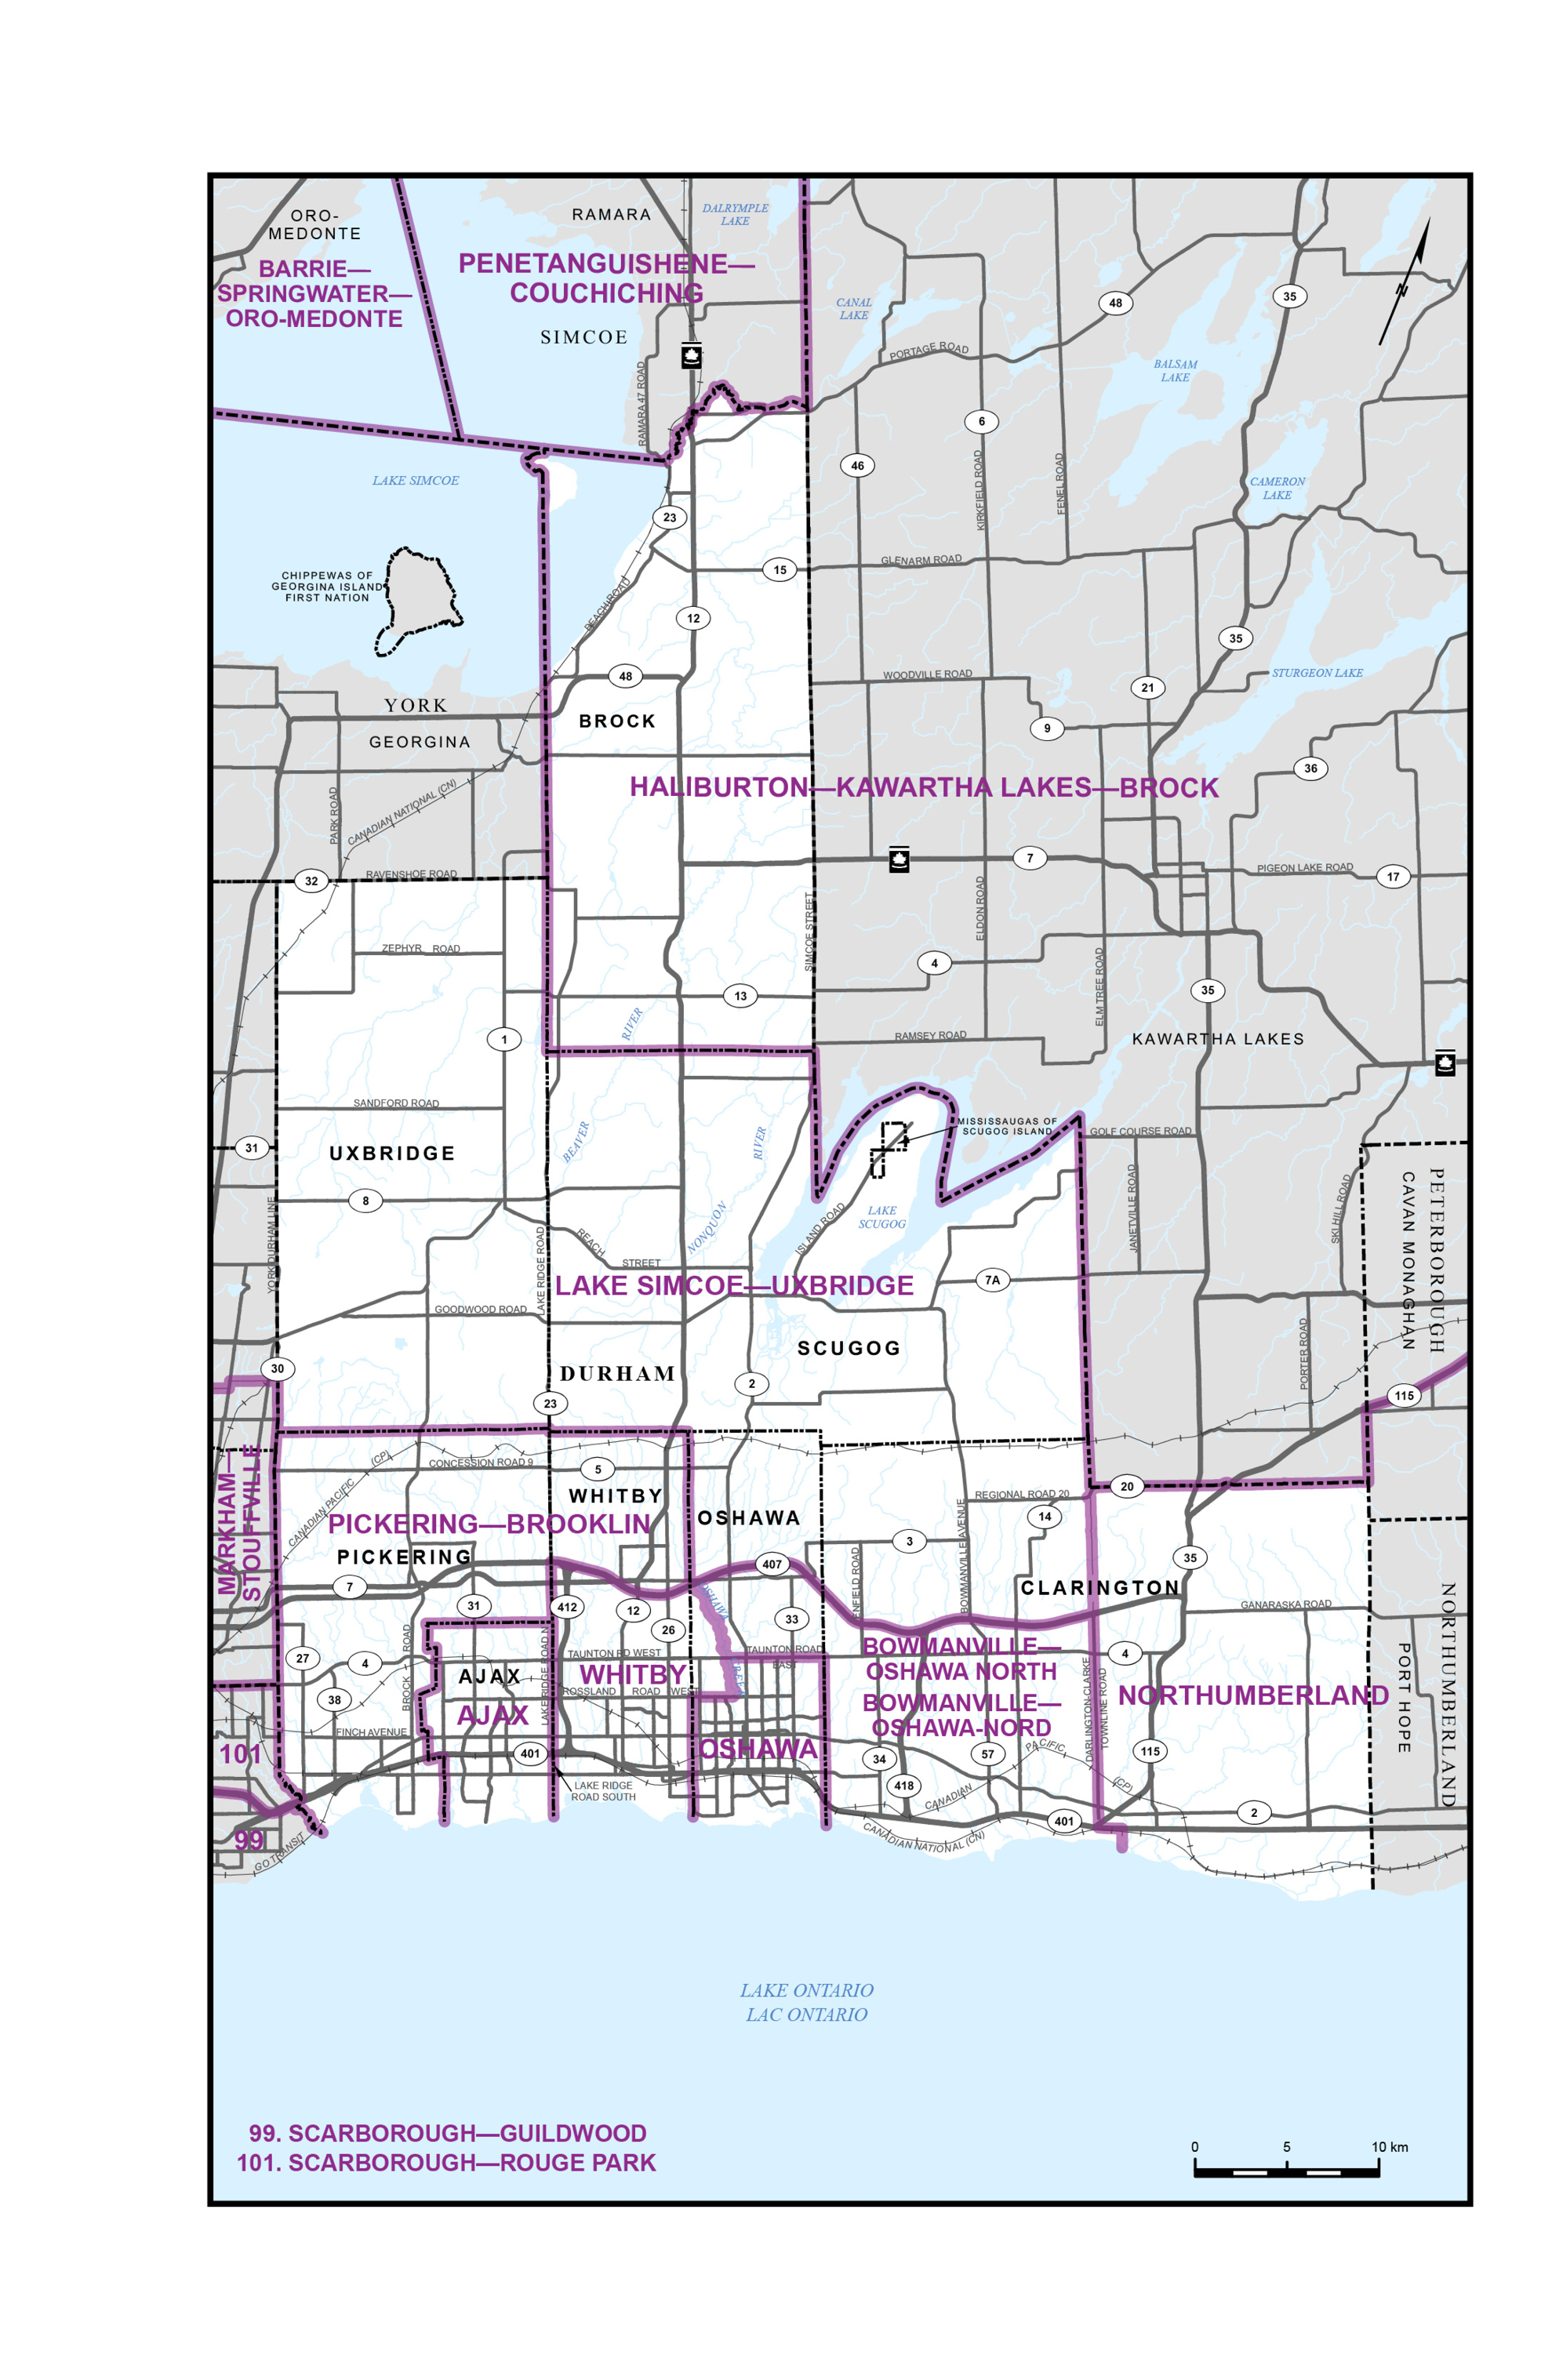
Map 10 – City of Greater Sudbury
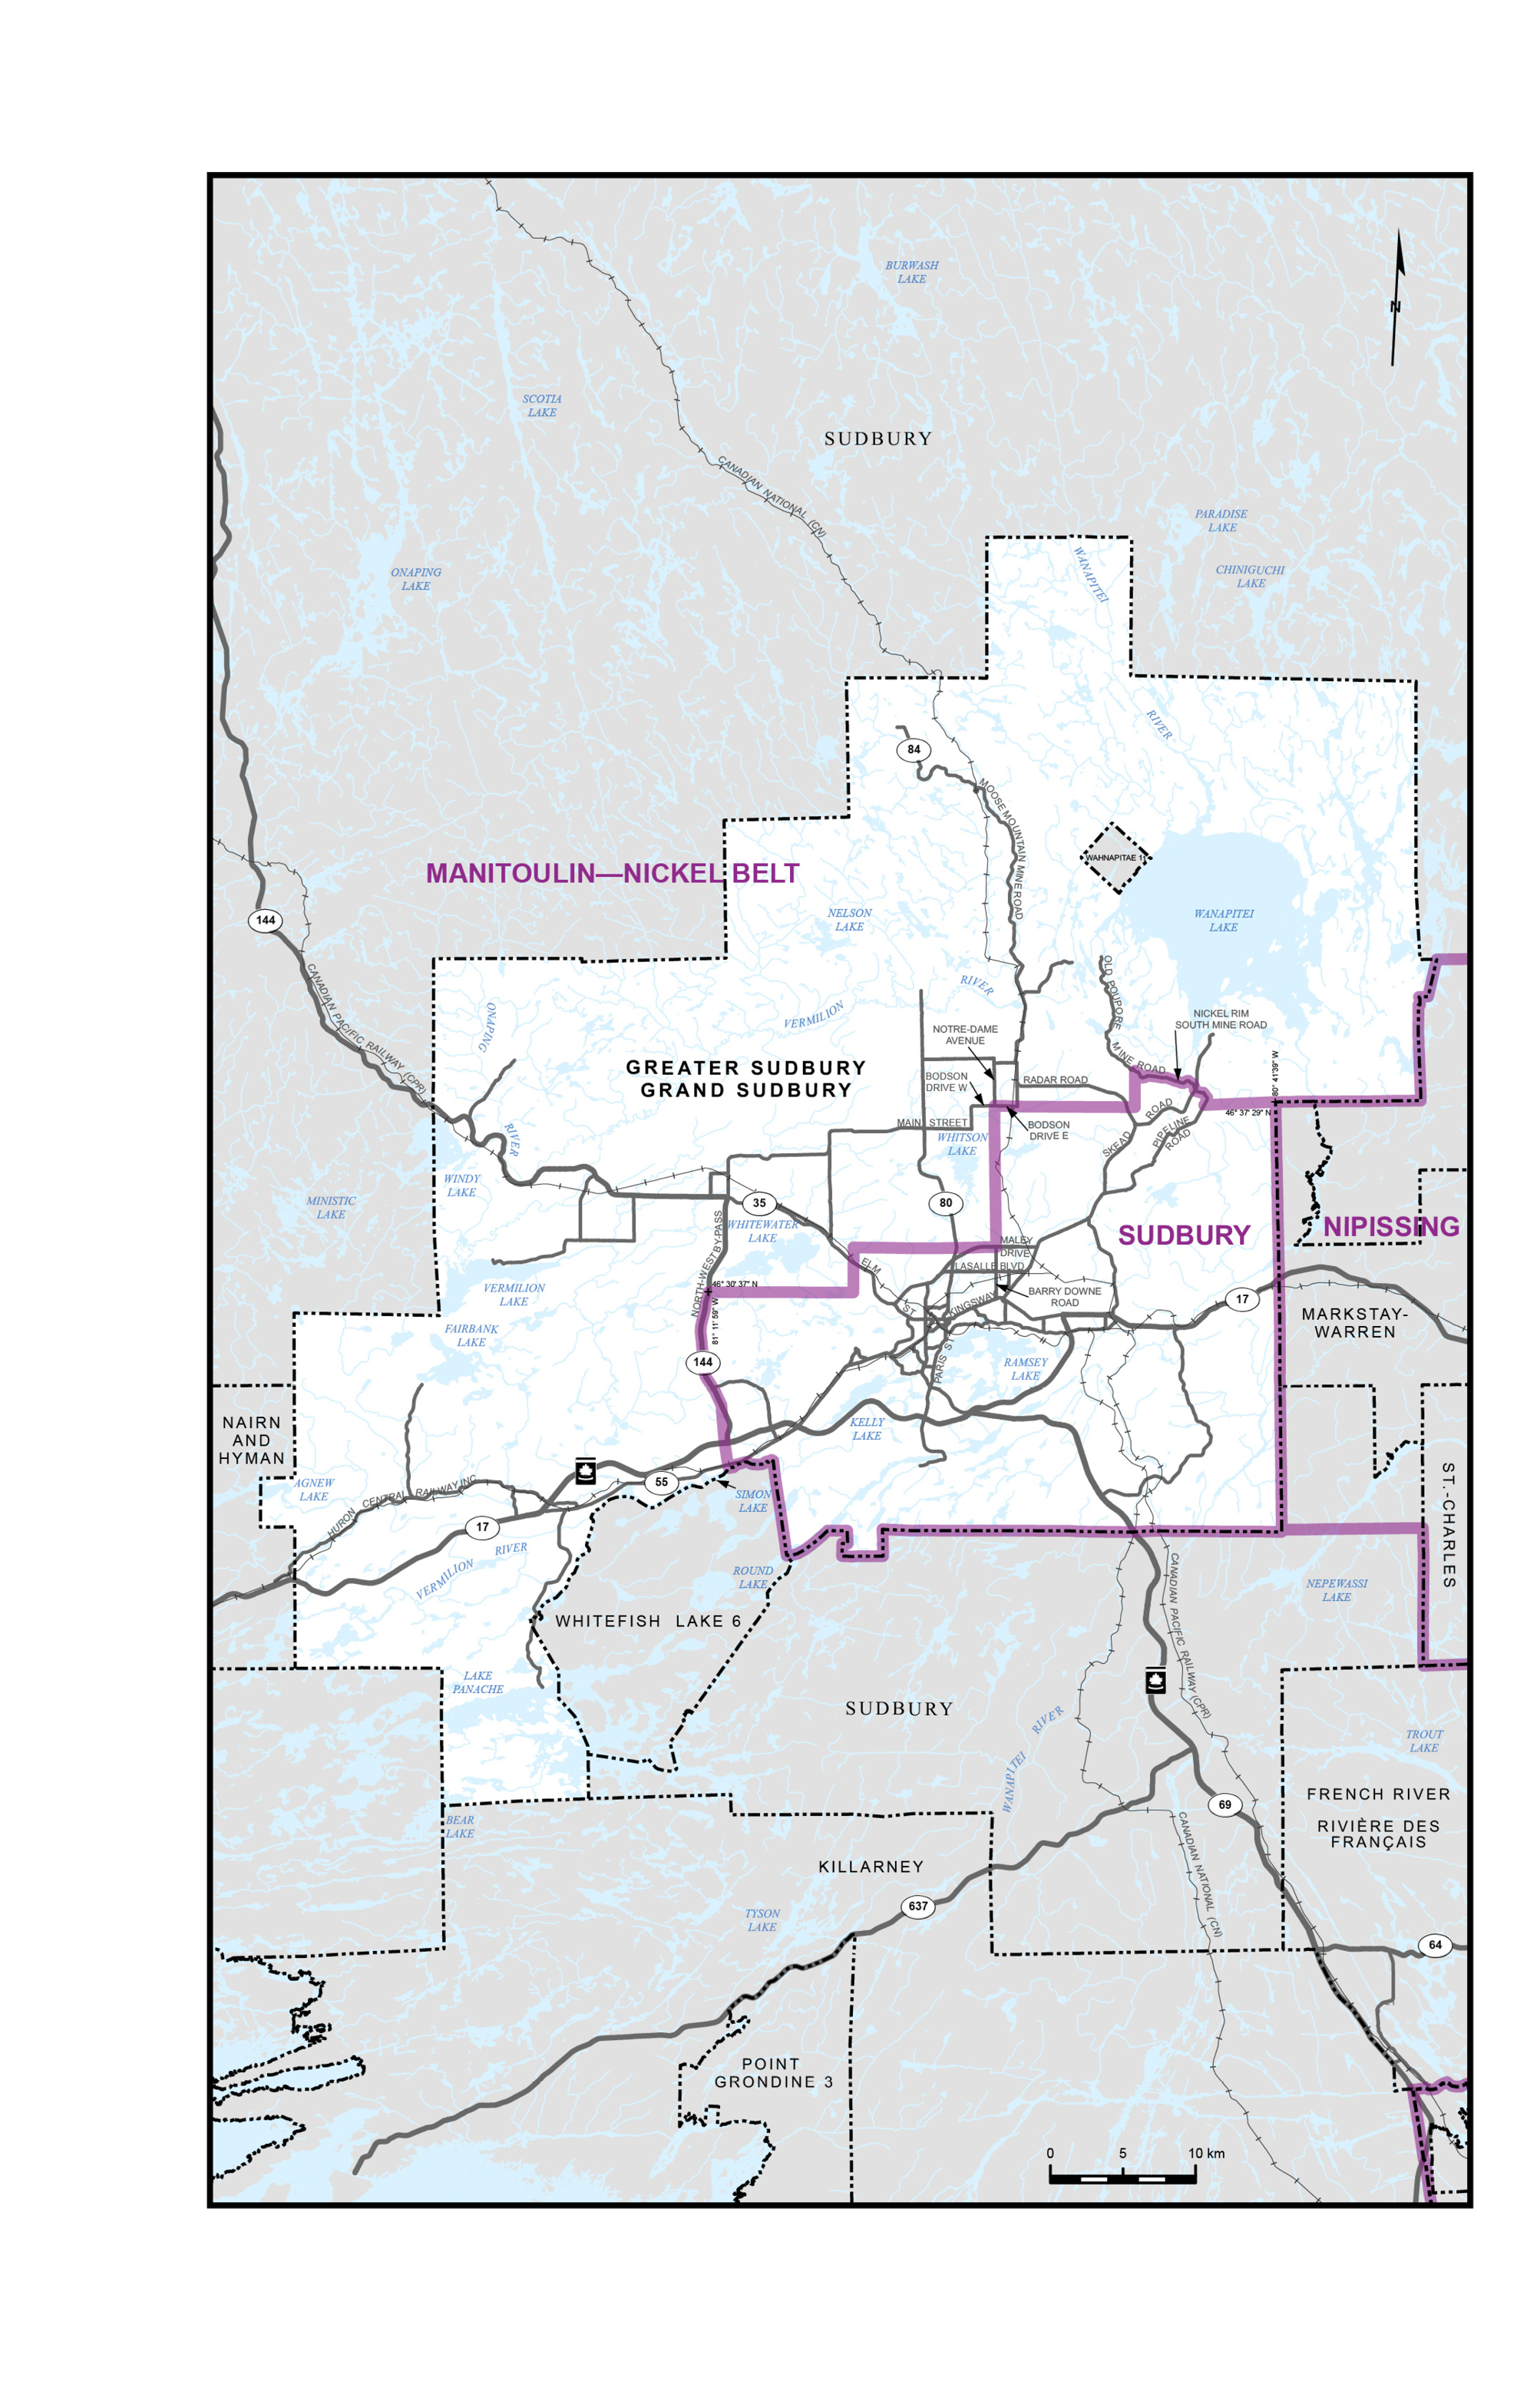
Map 11 – City of Guelph
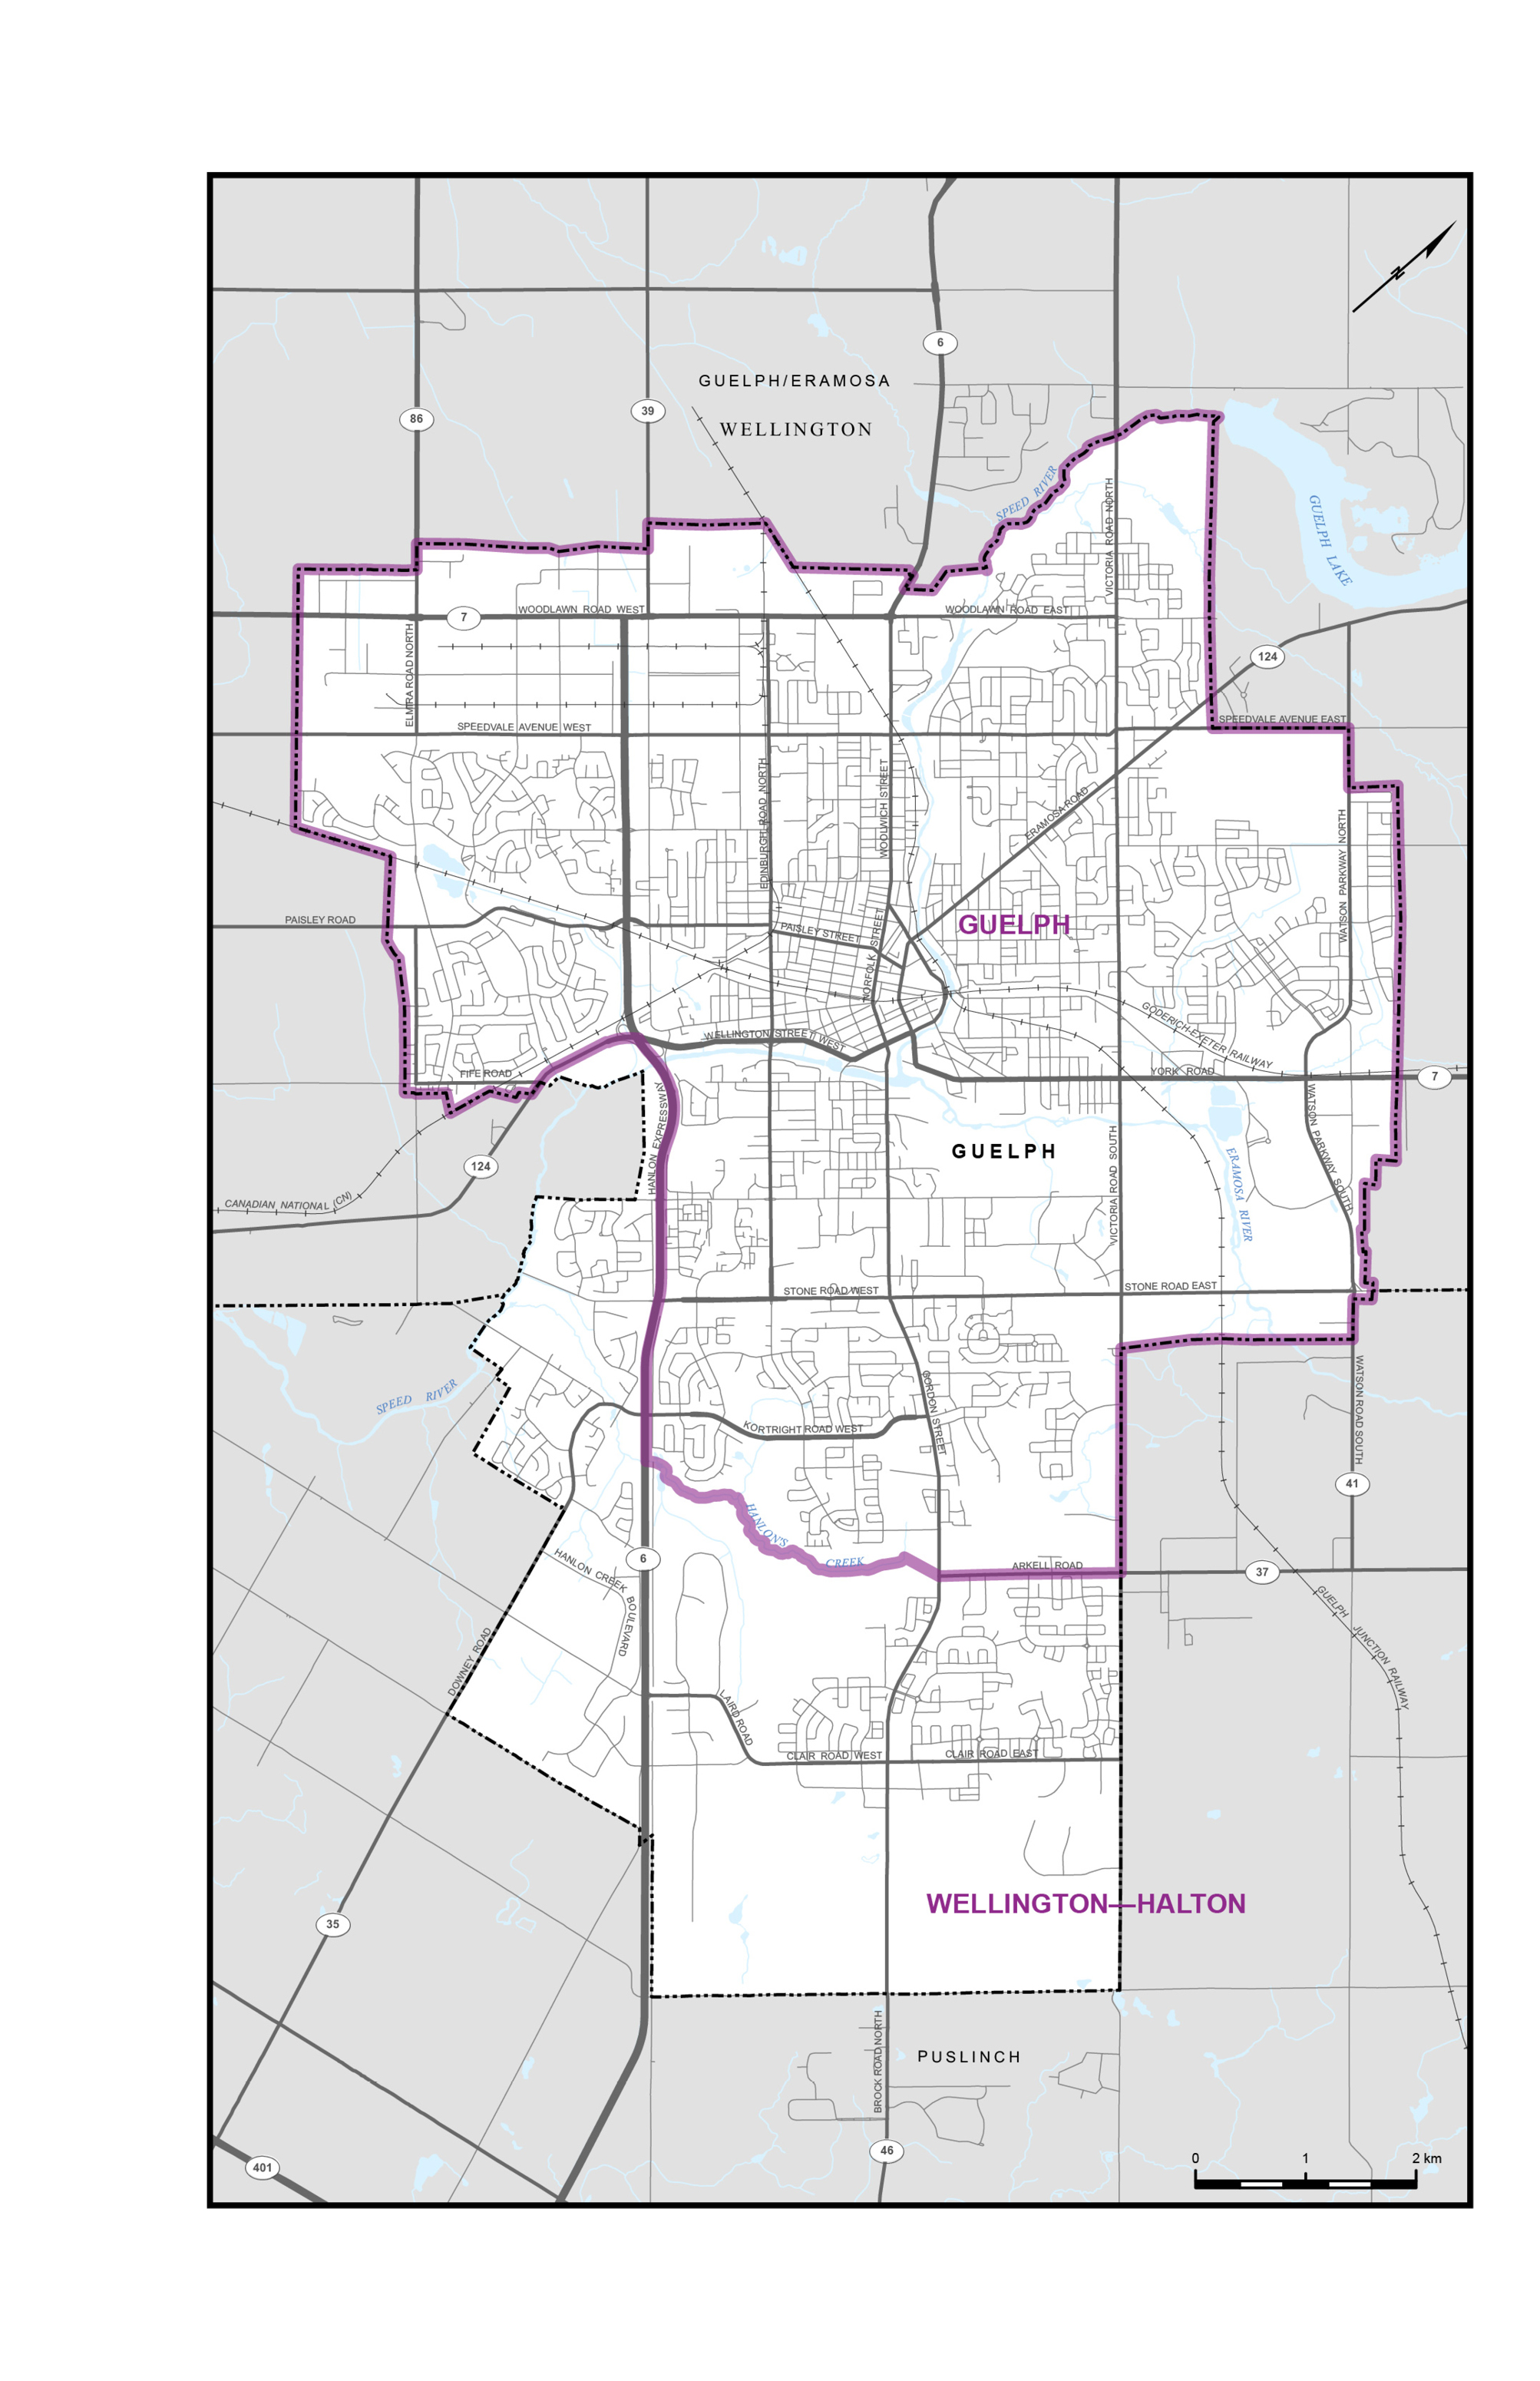
Map 12 – Regional Municipality of Halton
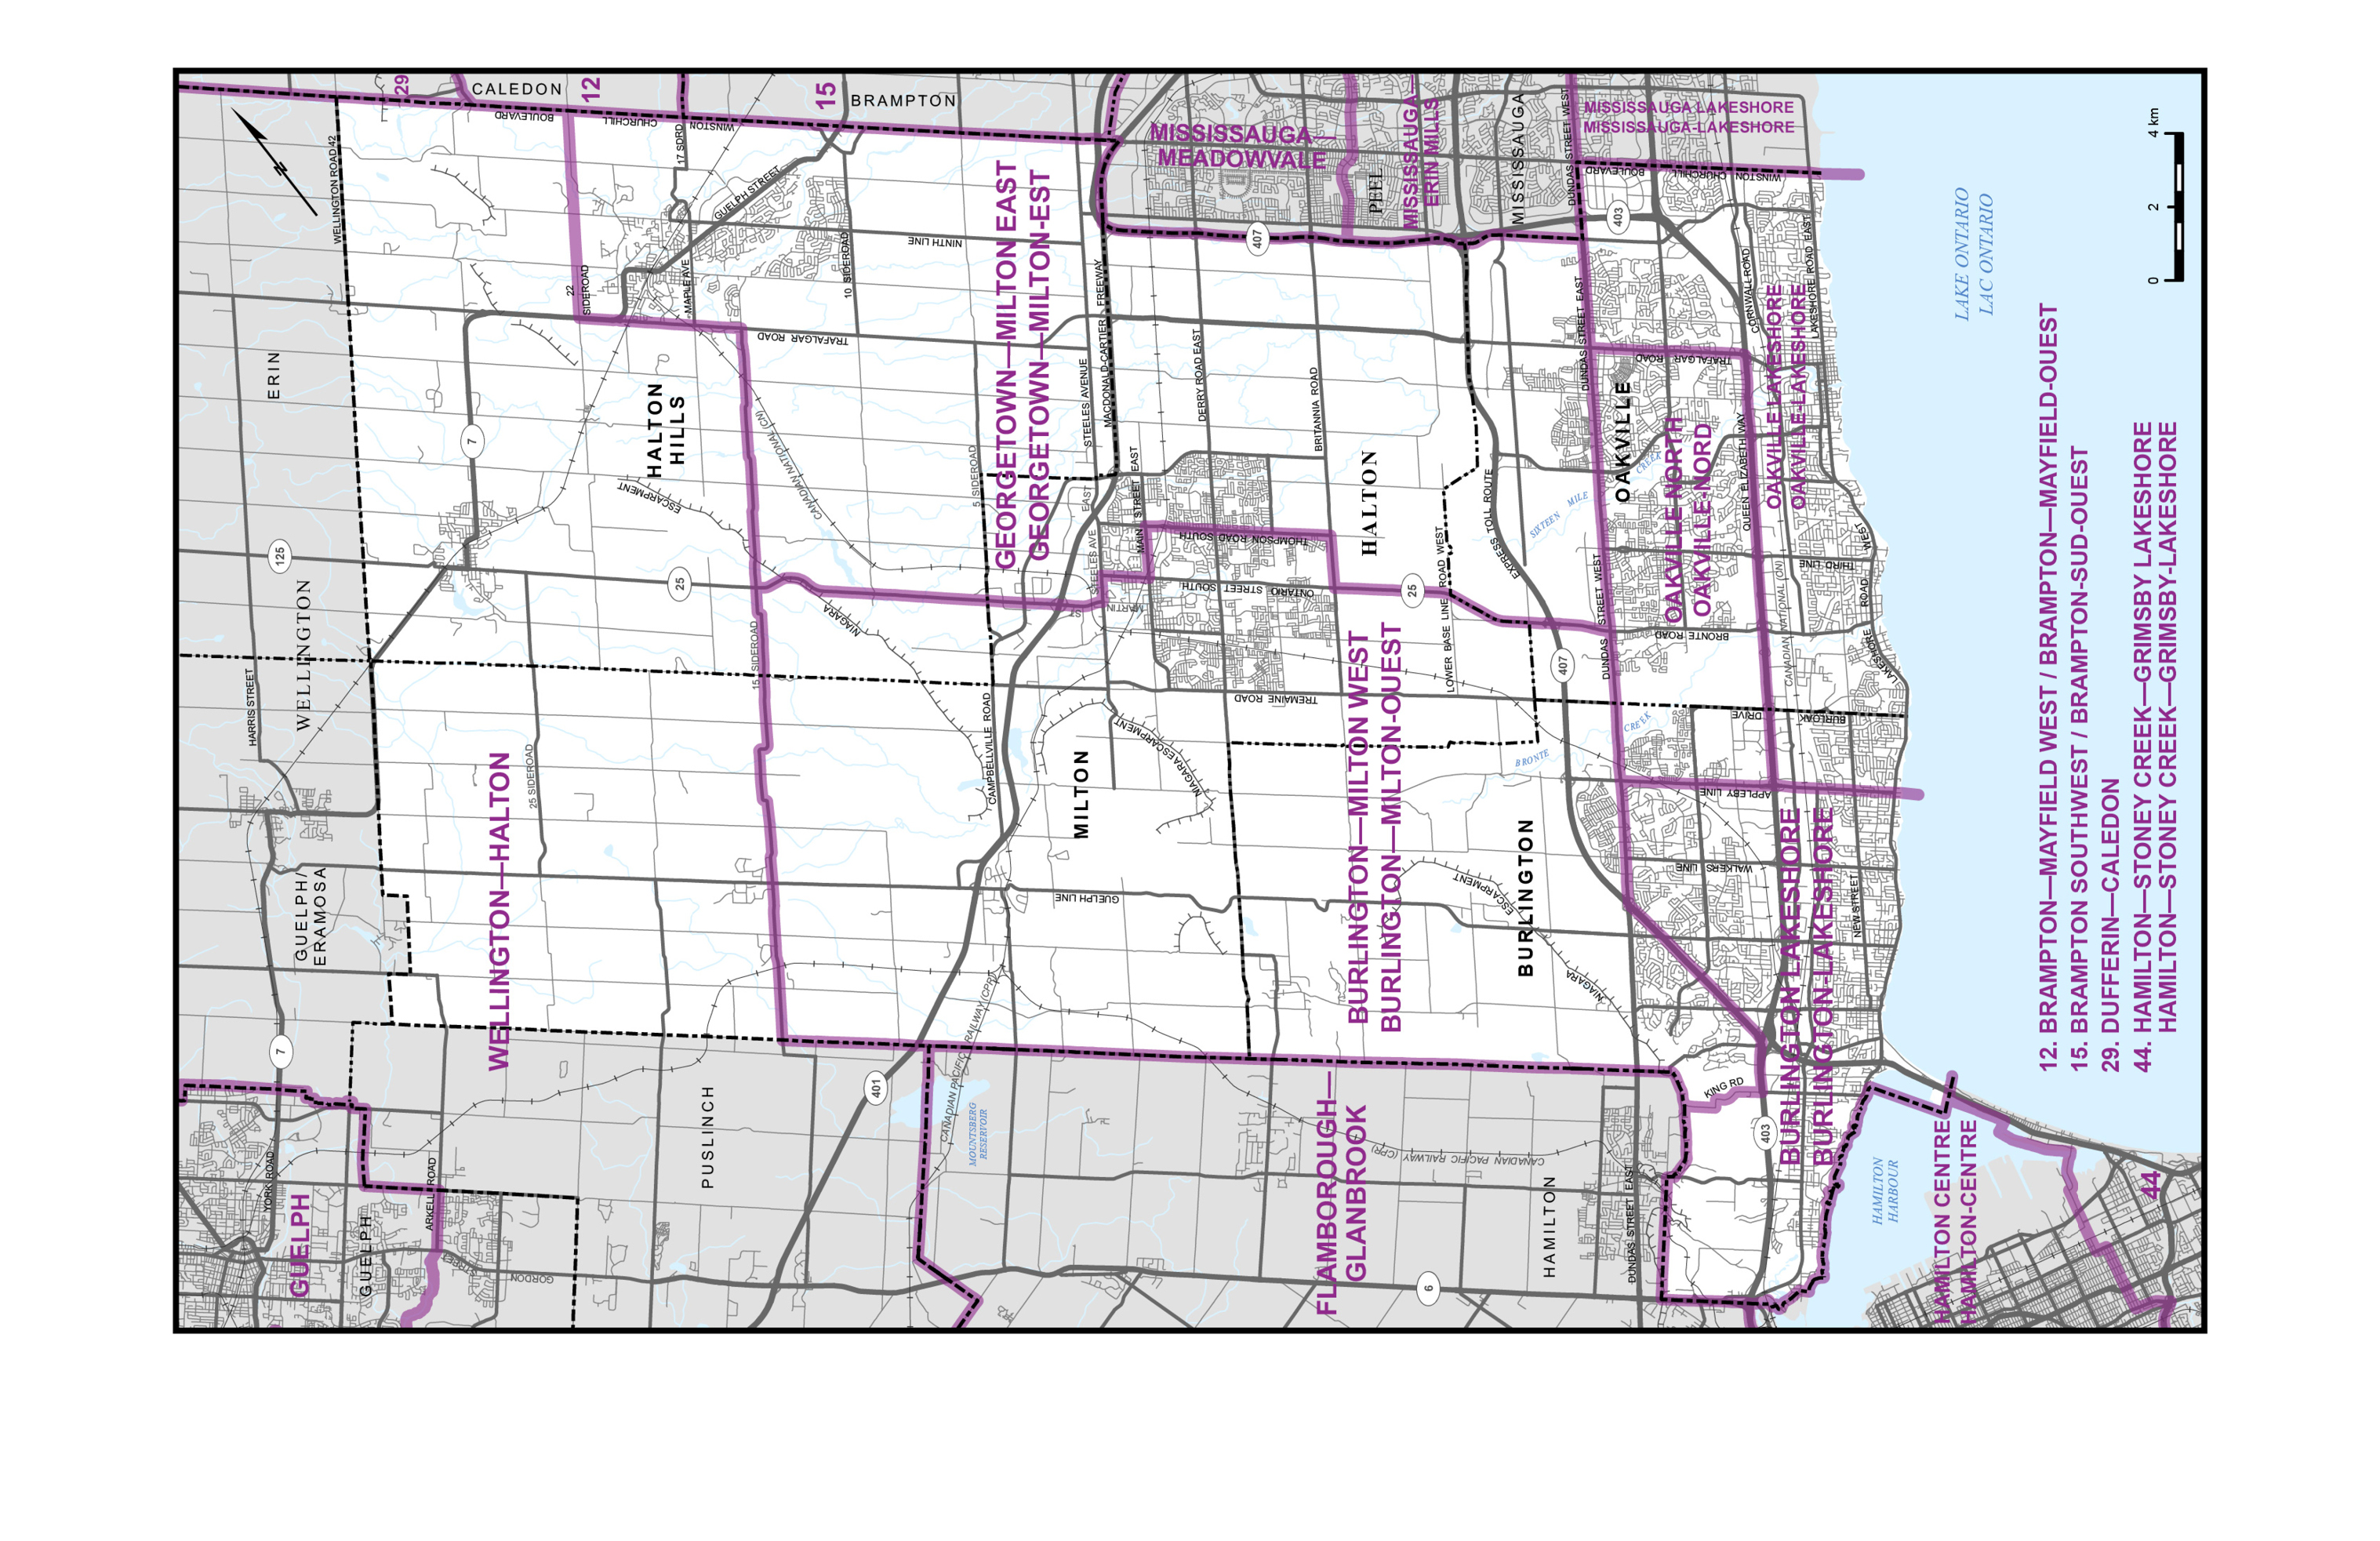
Map 13 – City of Hamilton
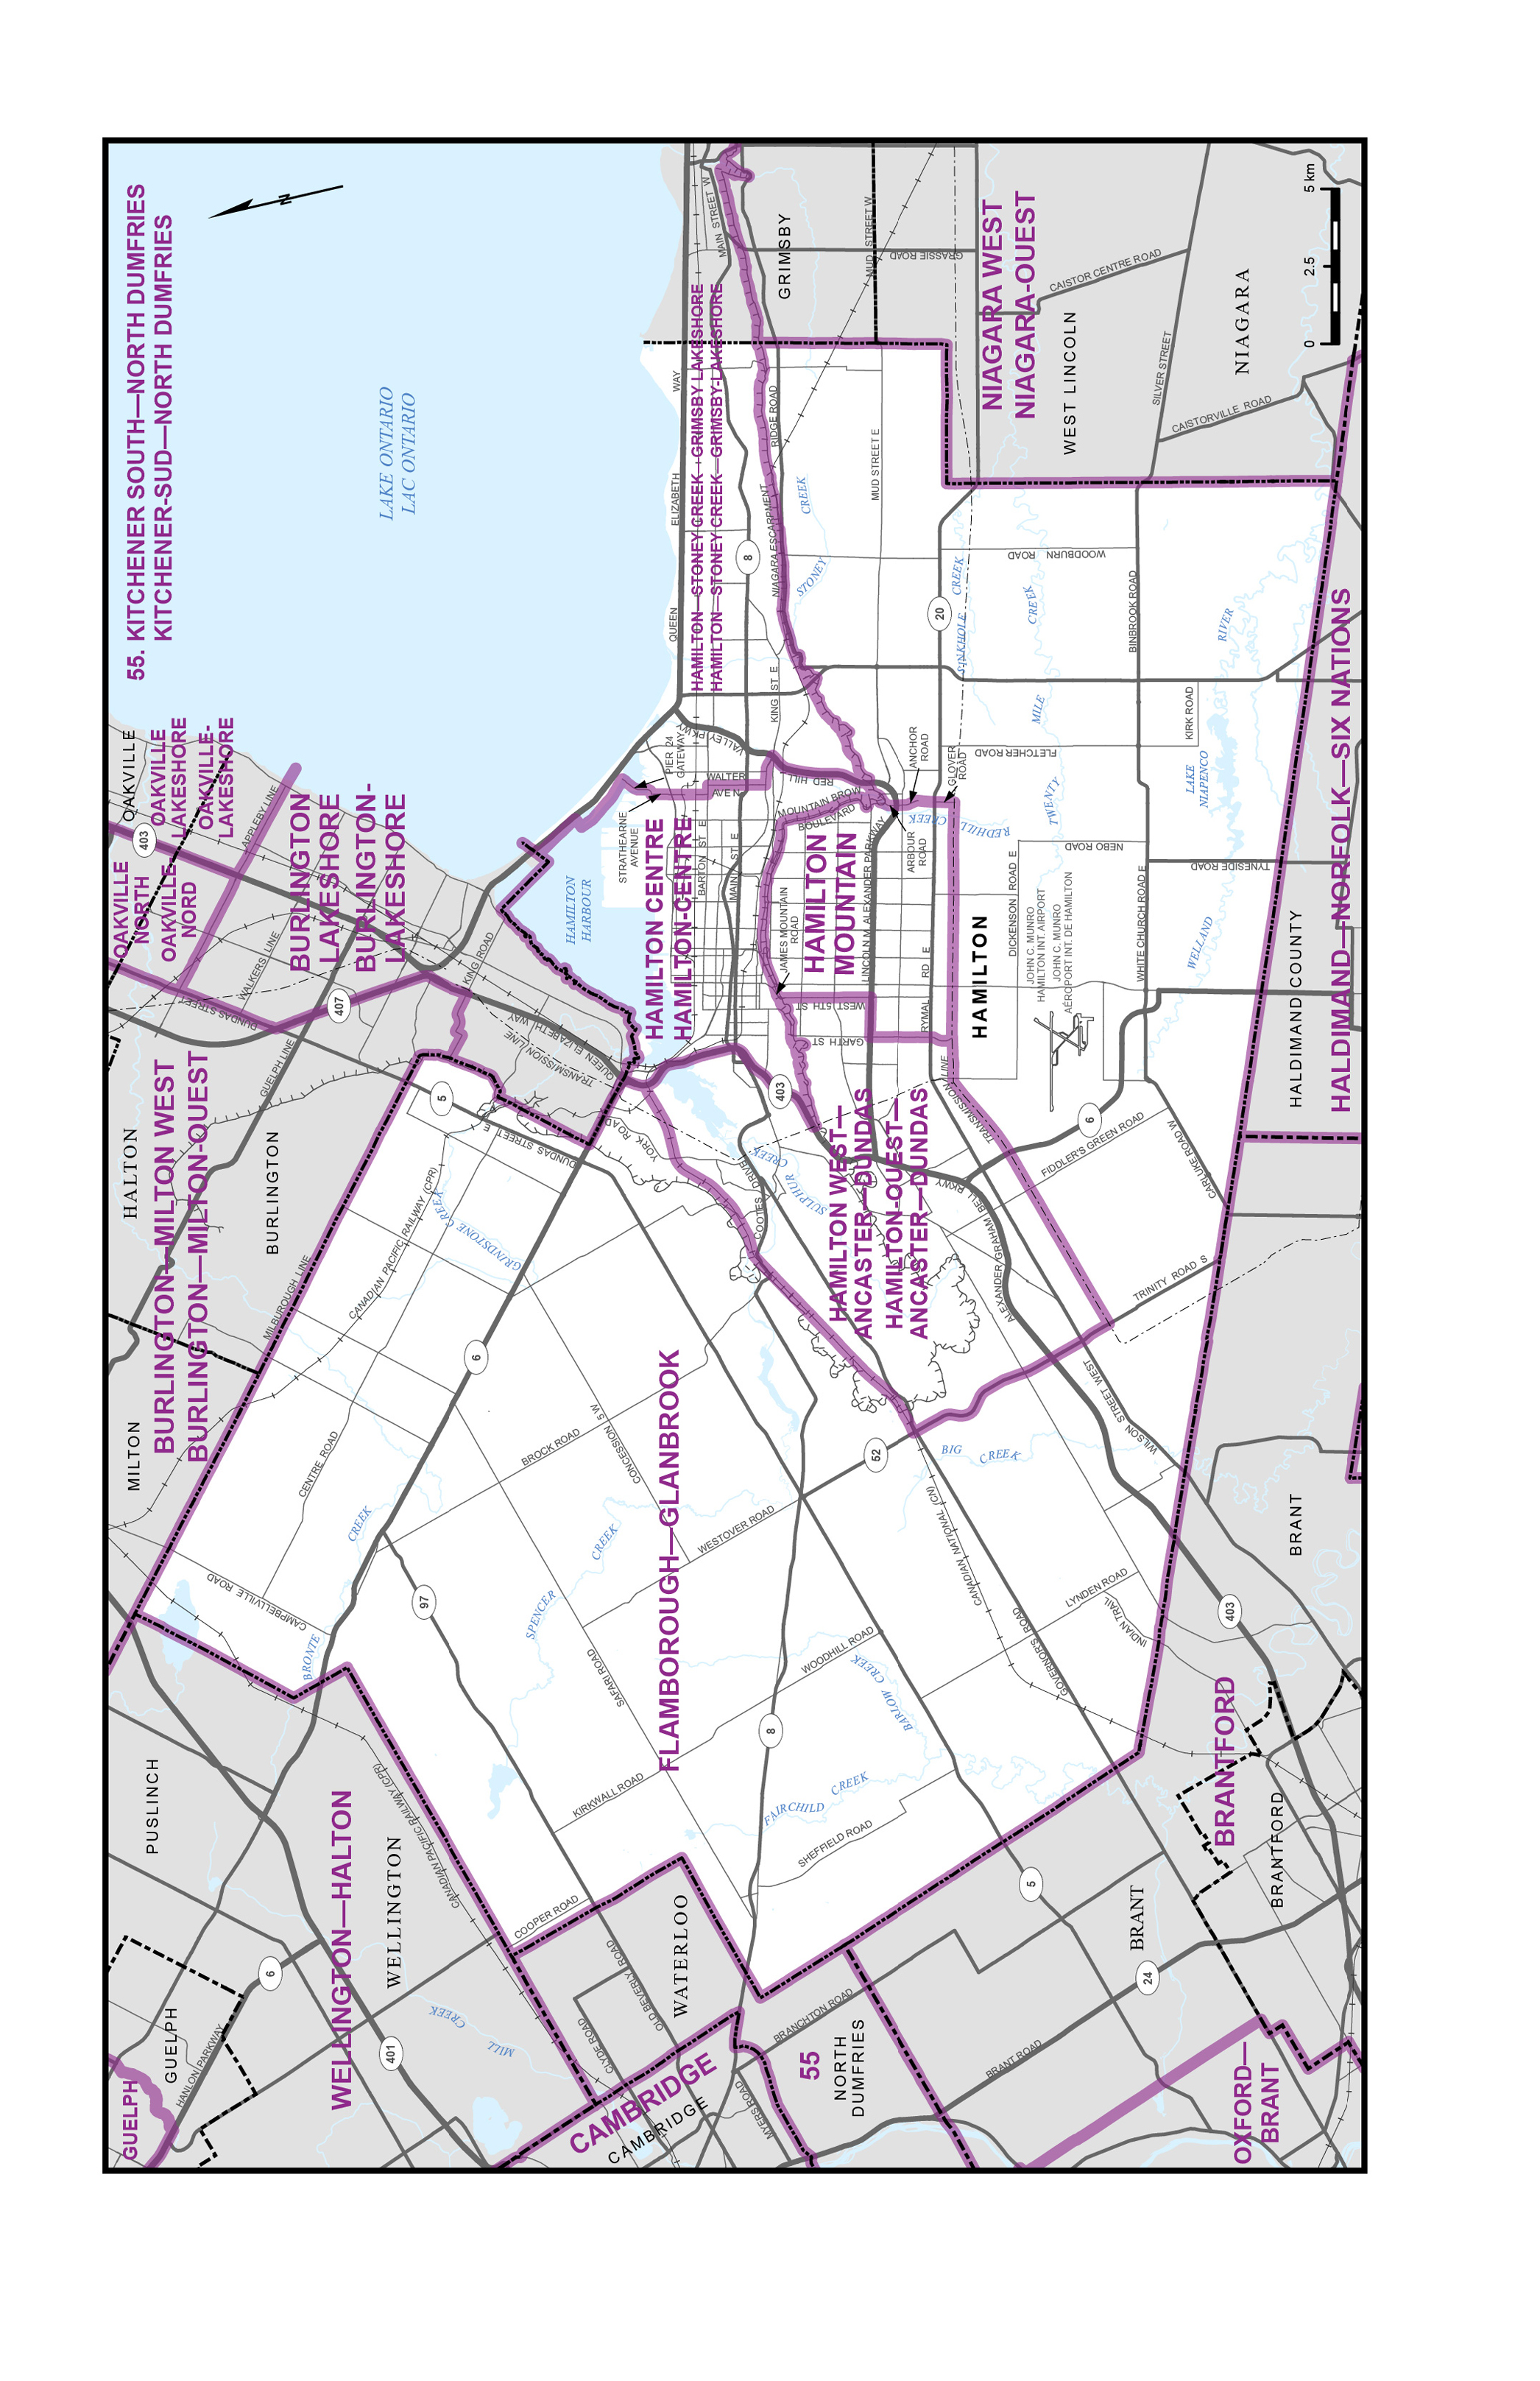
Map 14 – City of Kingston
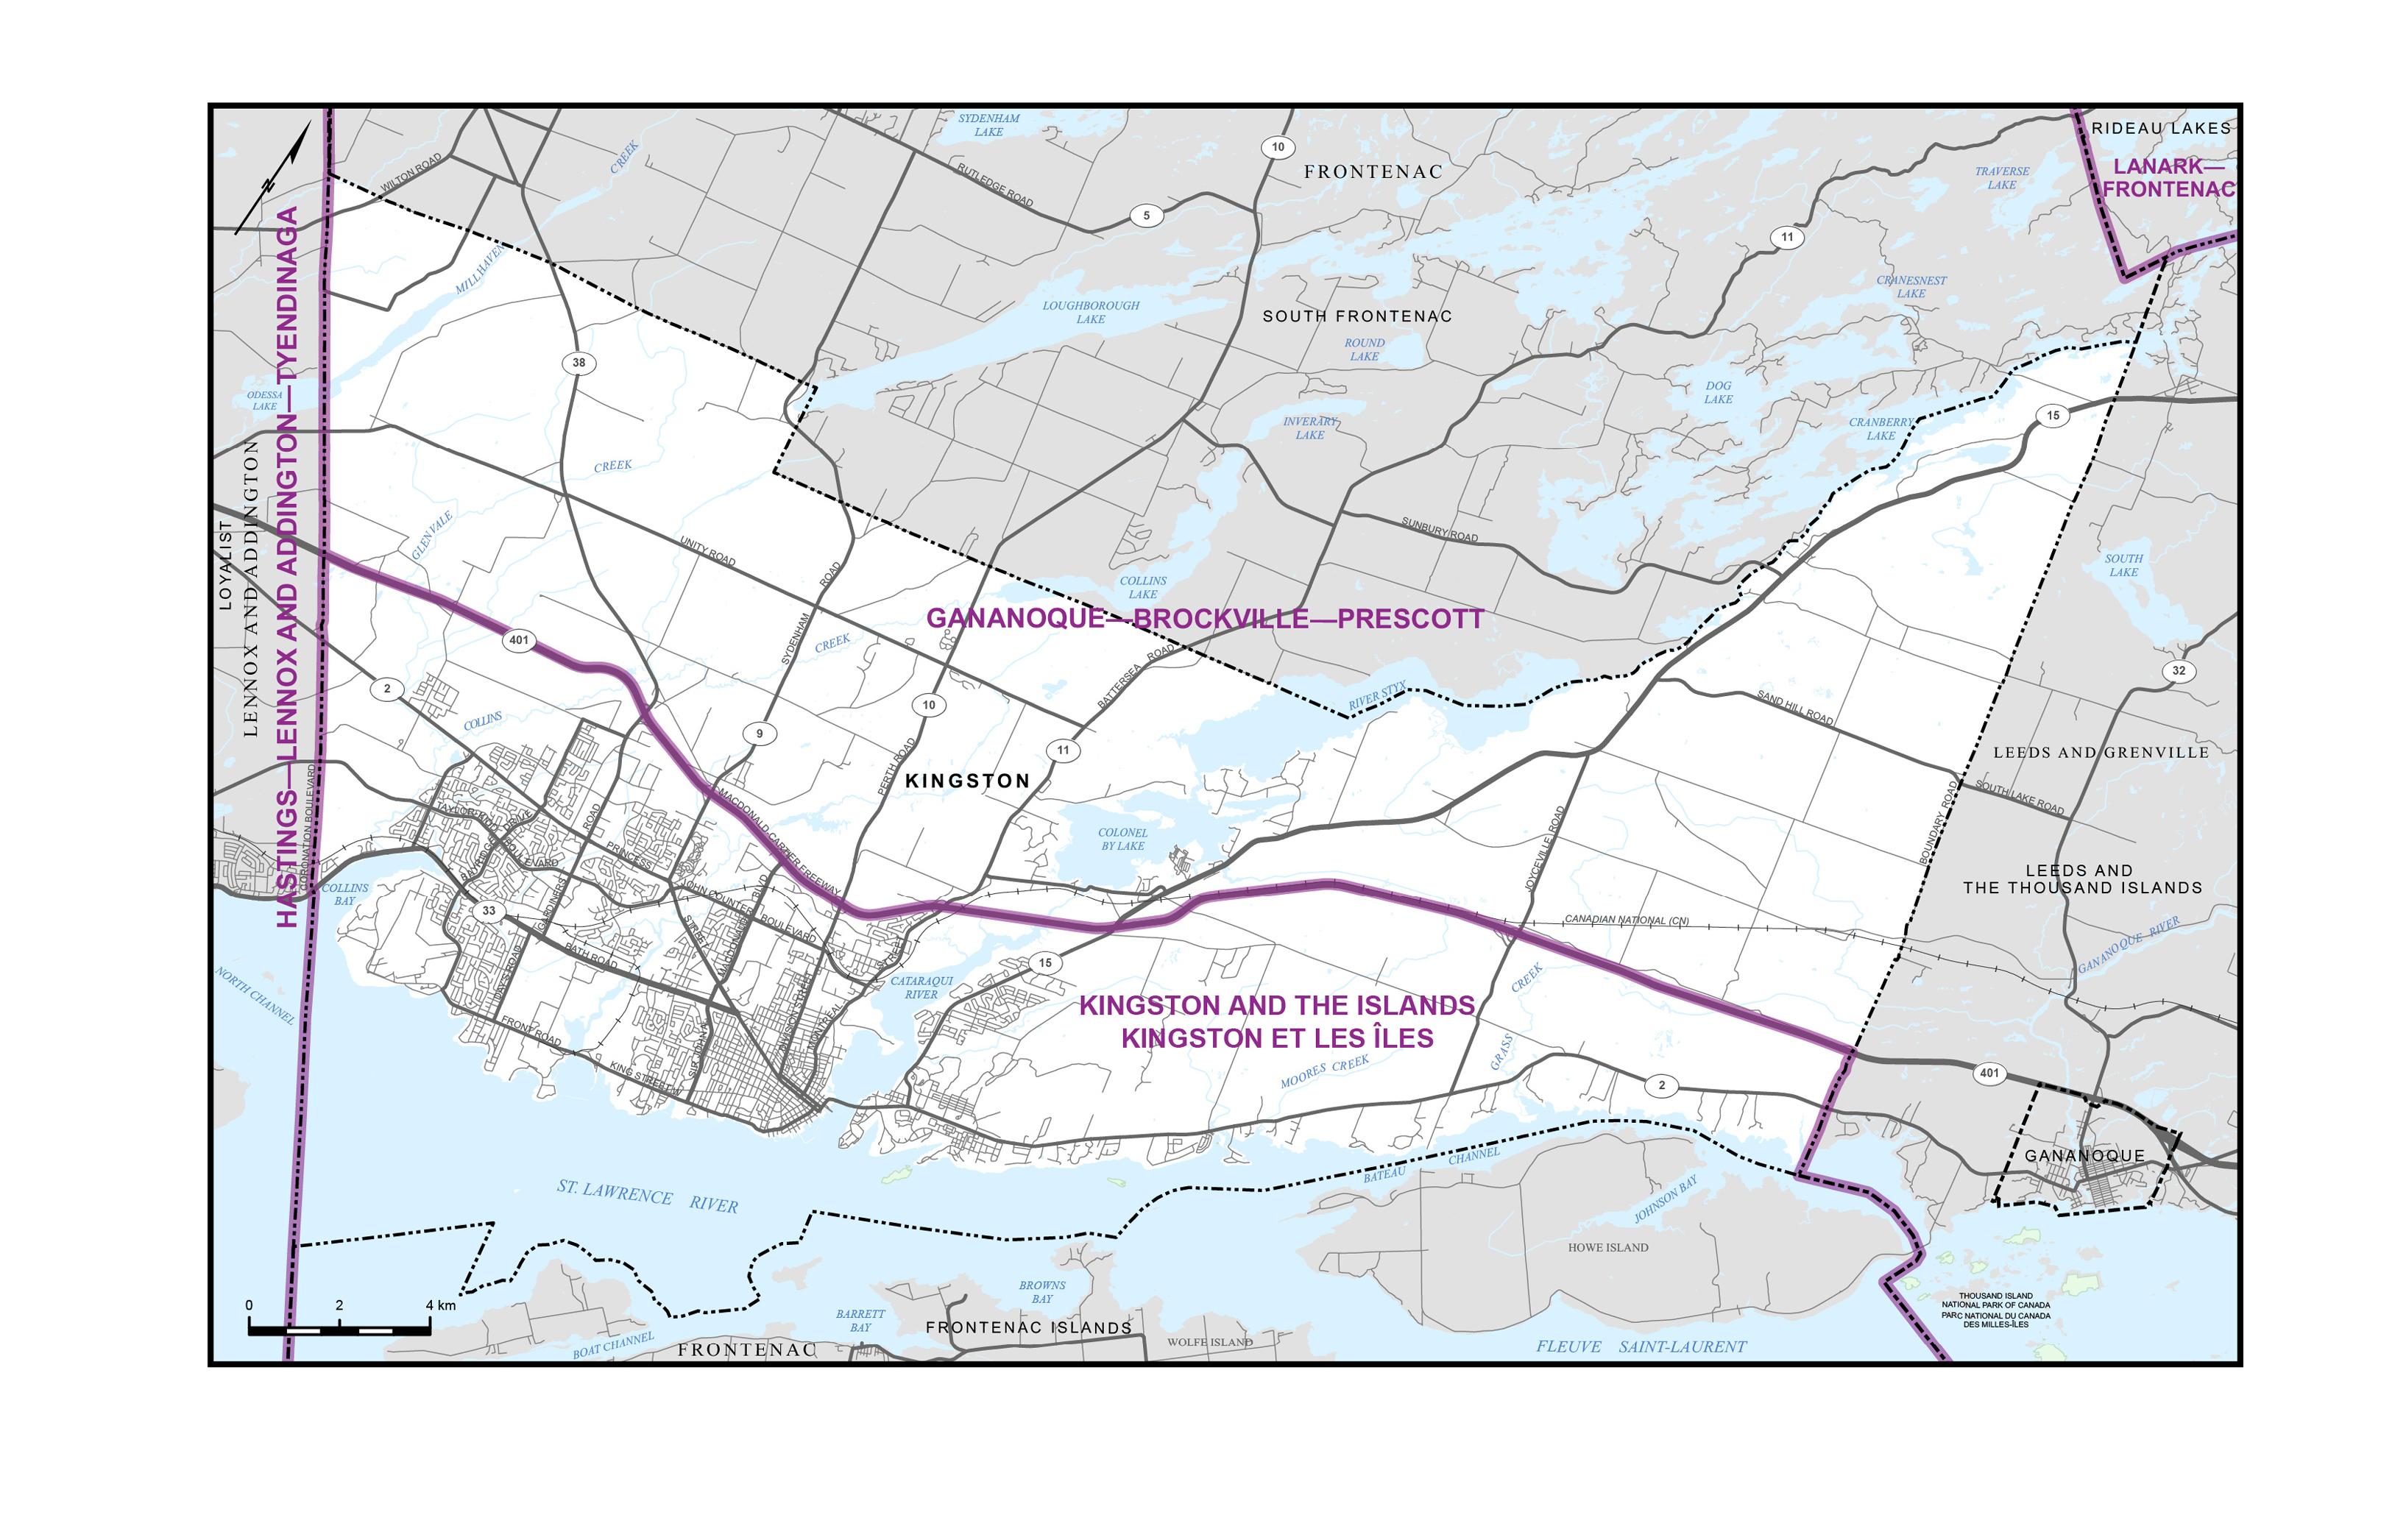
Map 15 – City of London
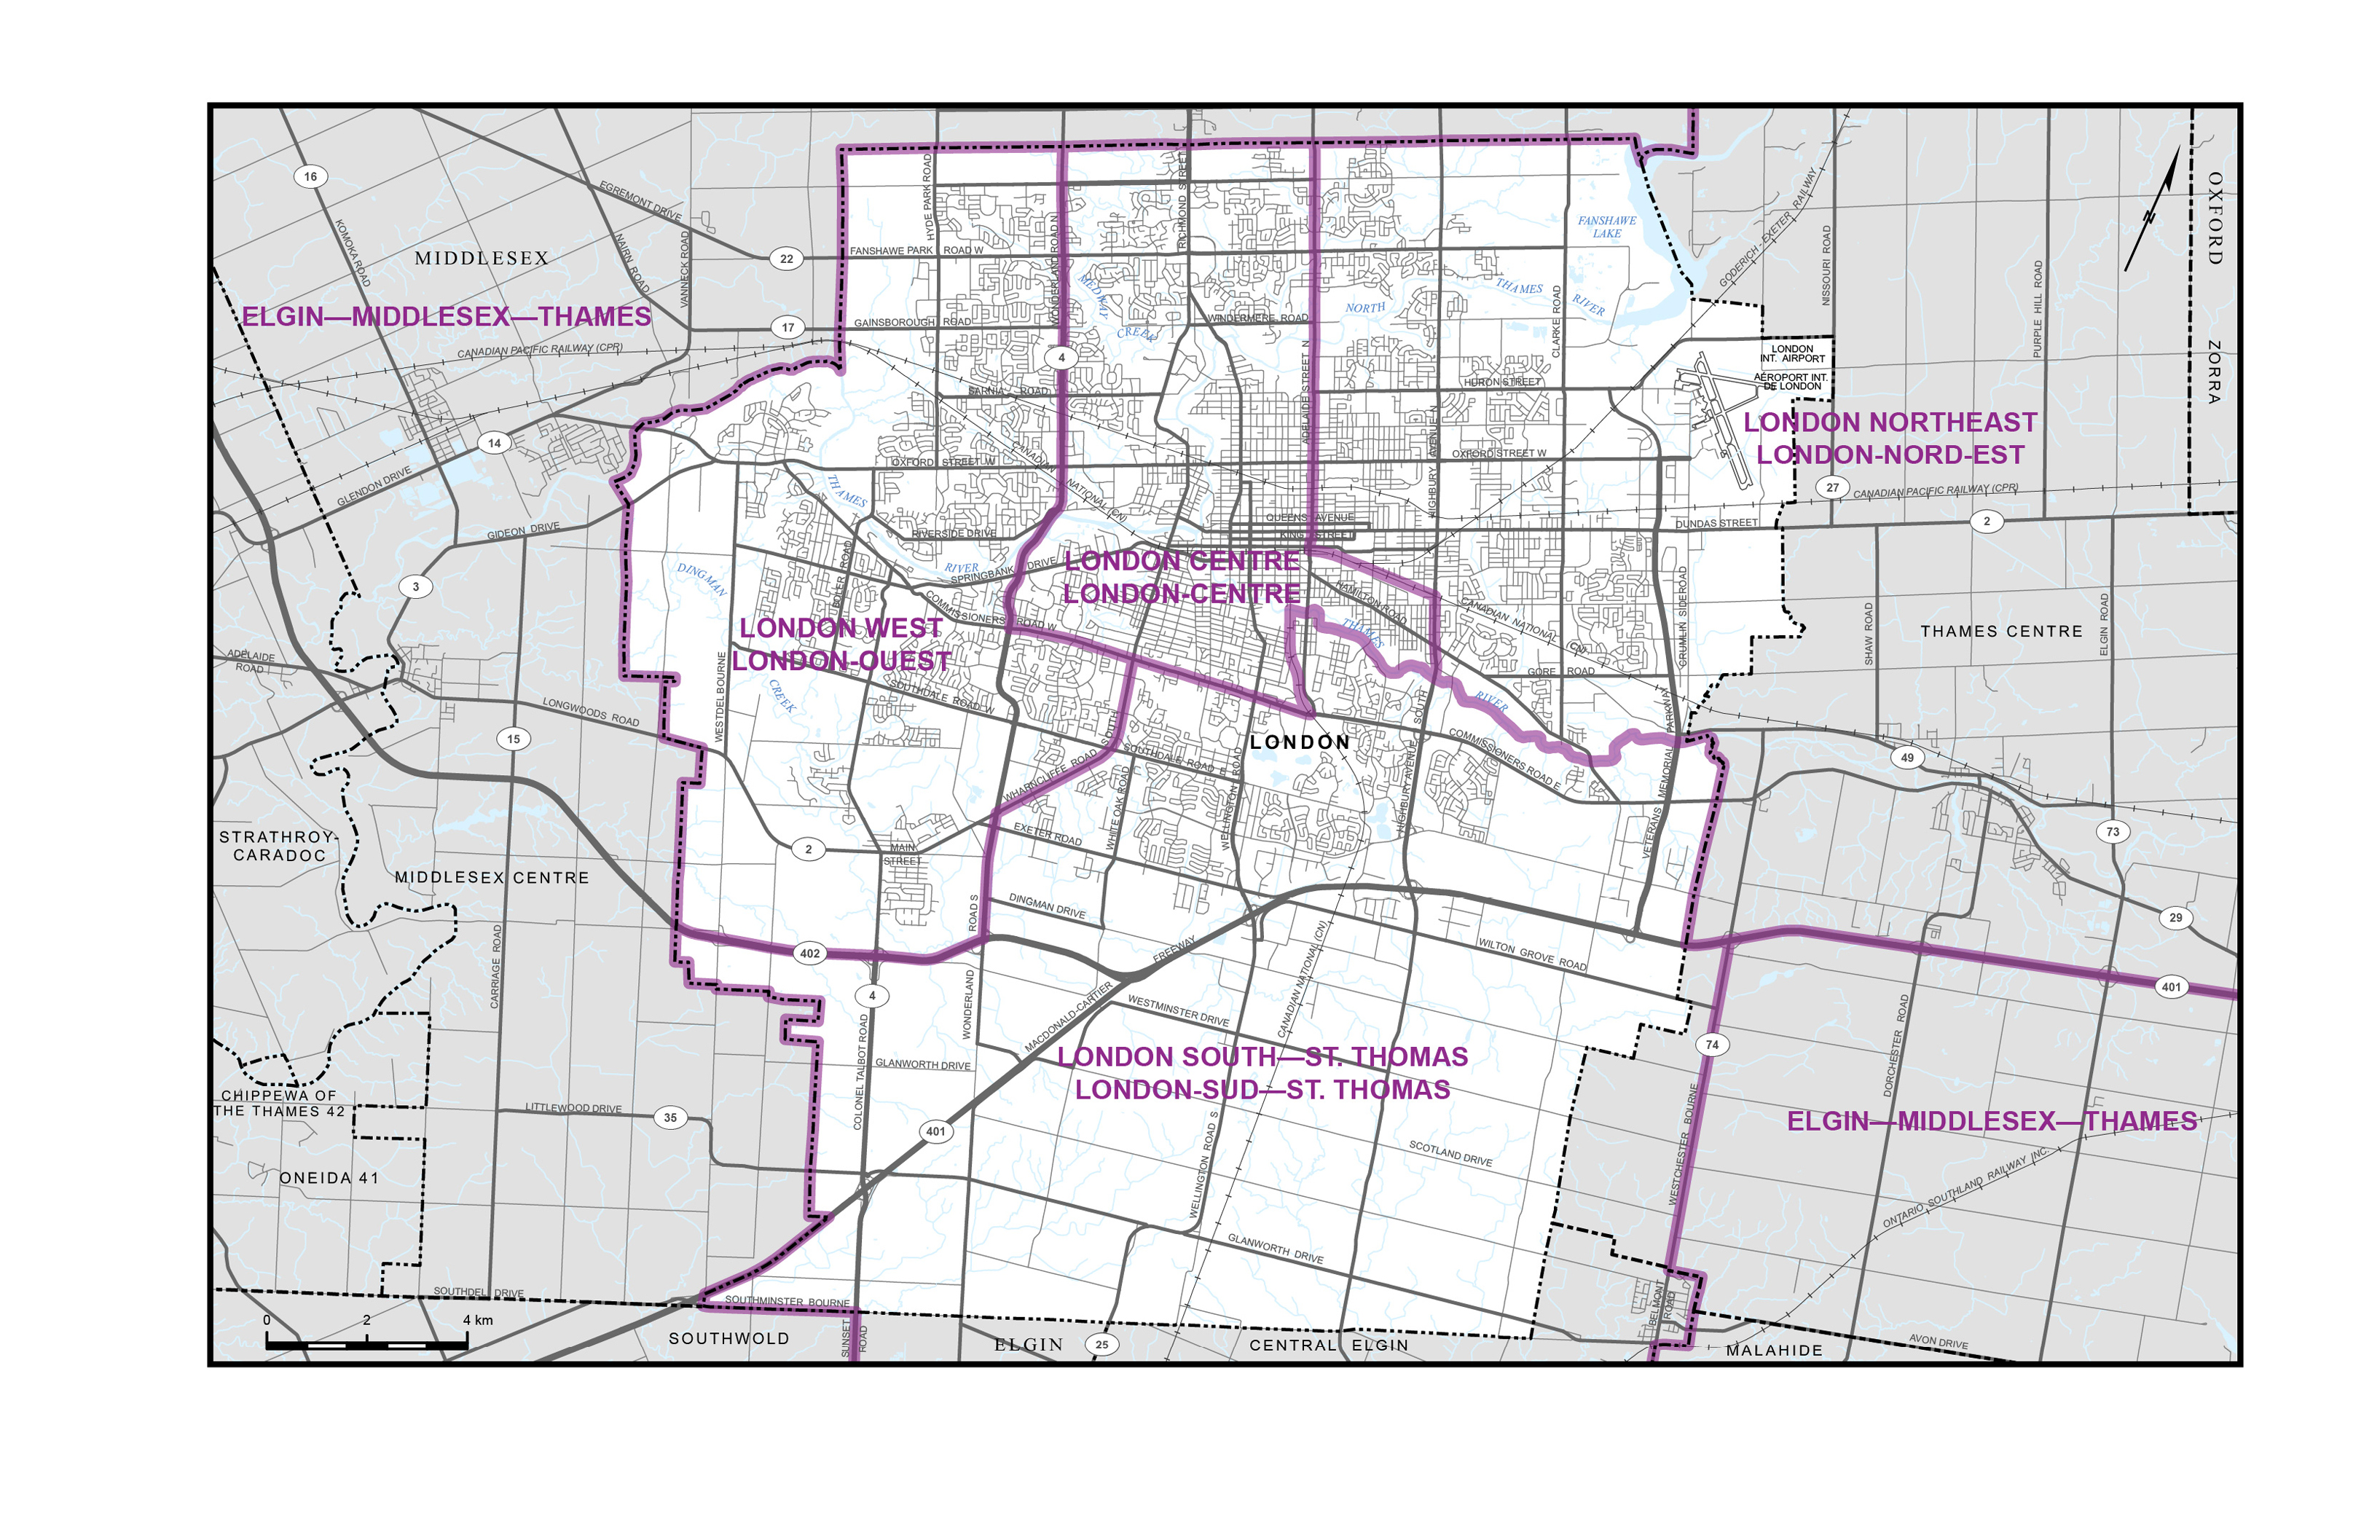
Map 16 – City of Ottawa
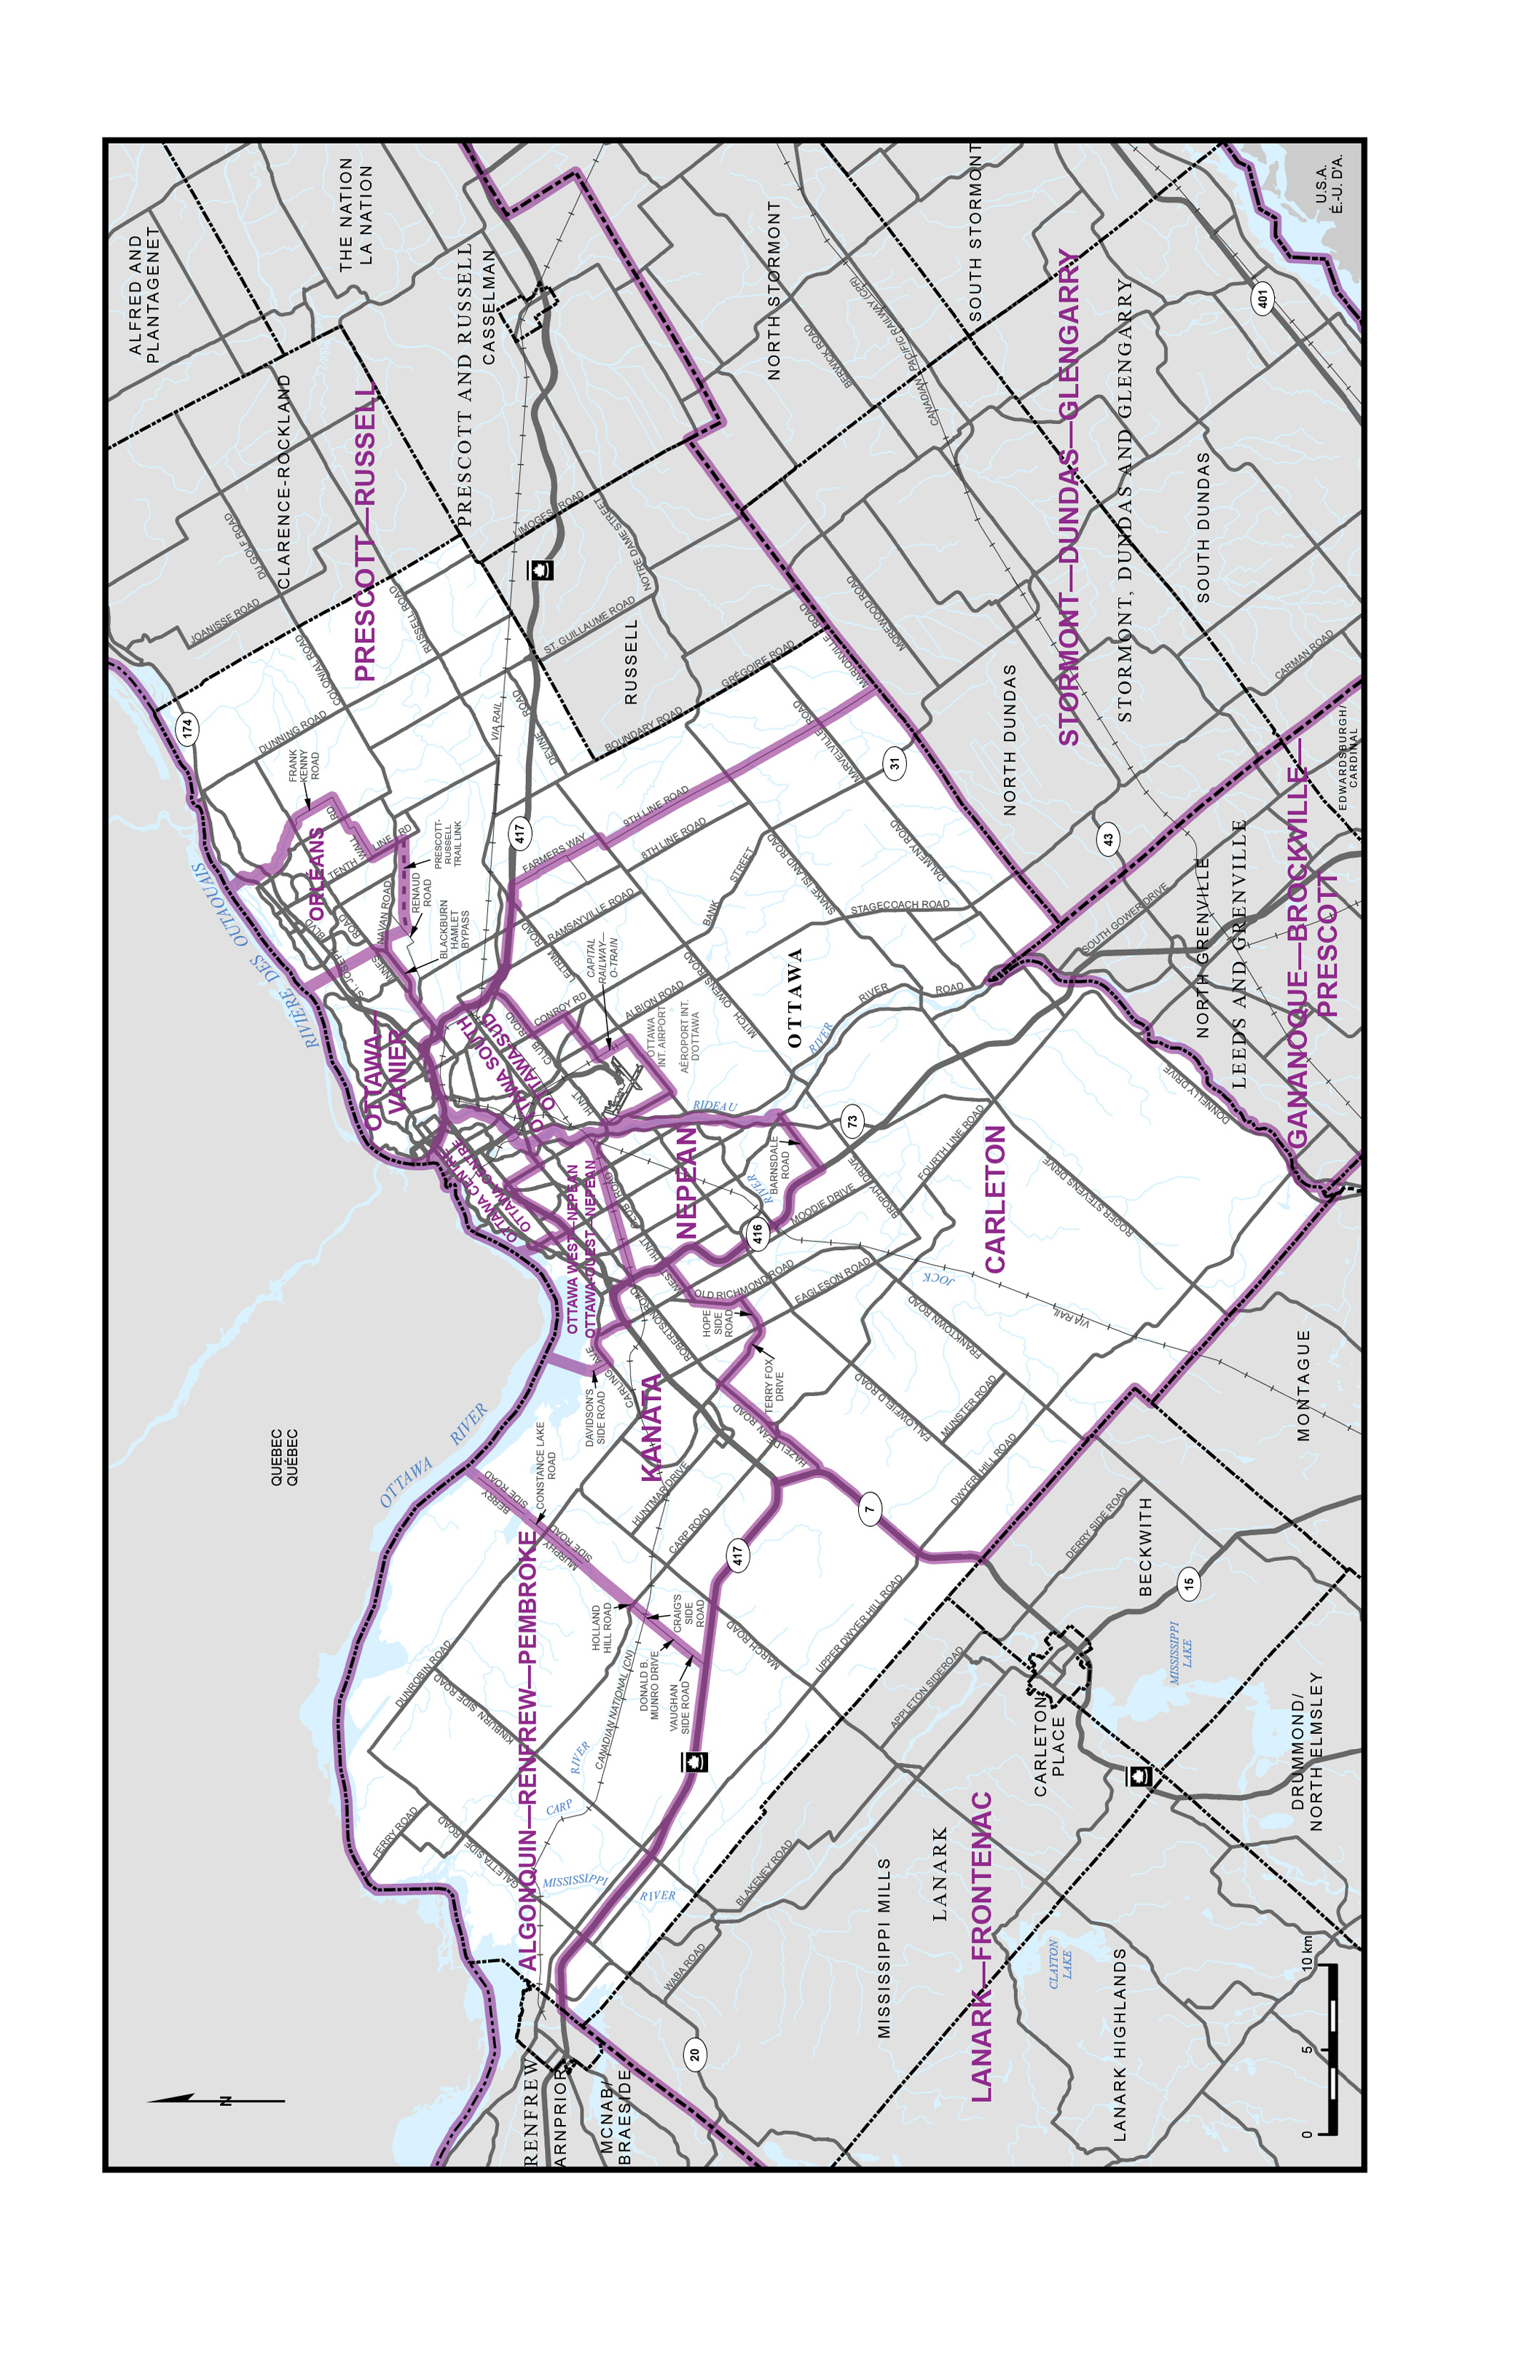
Map 17 – Regional Municipality of Peel (part)
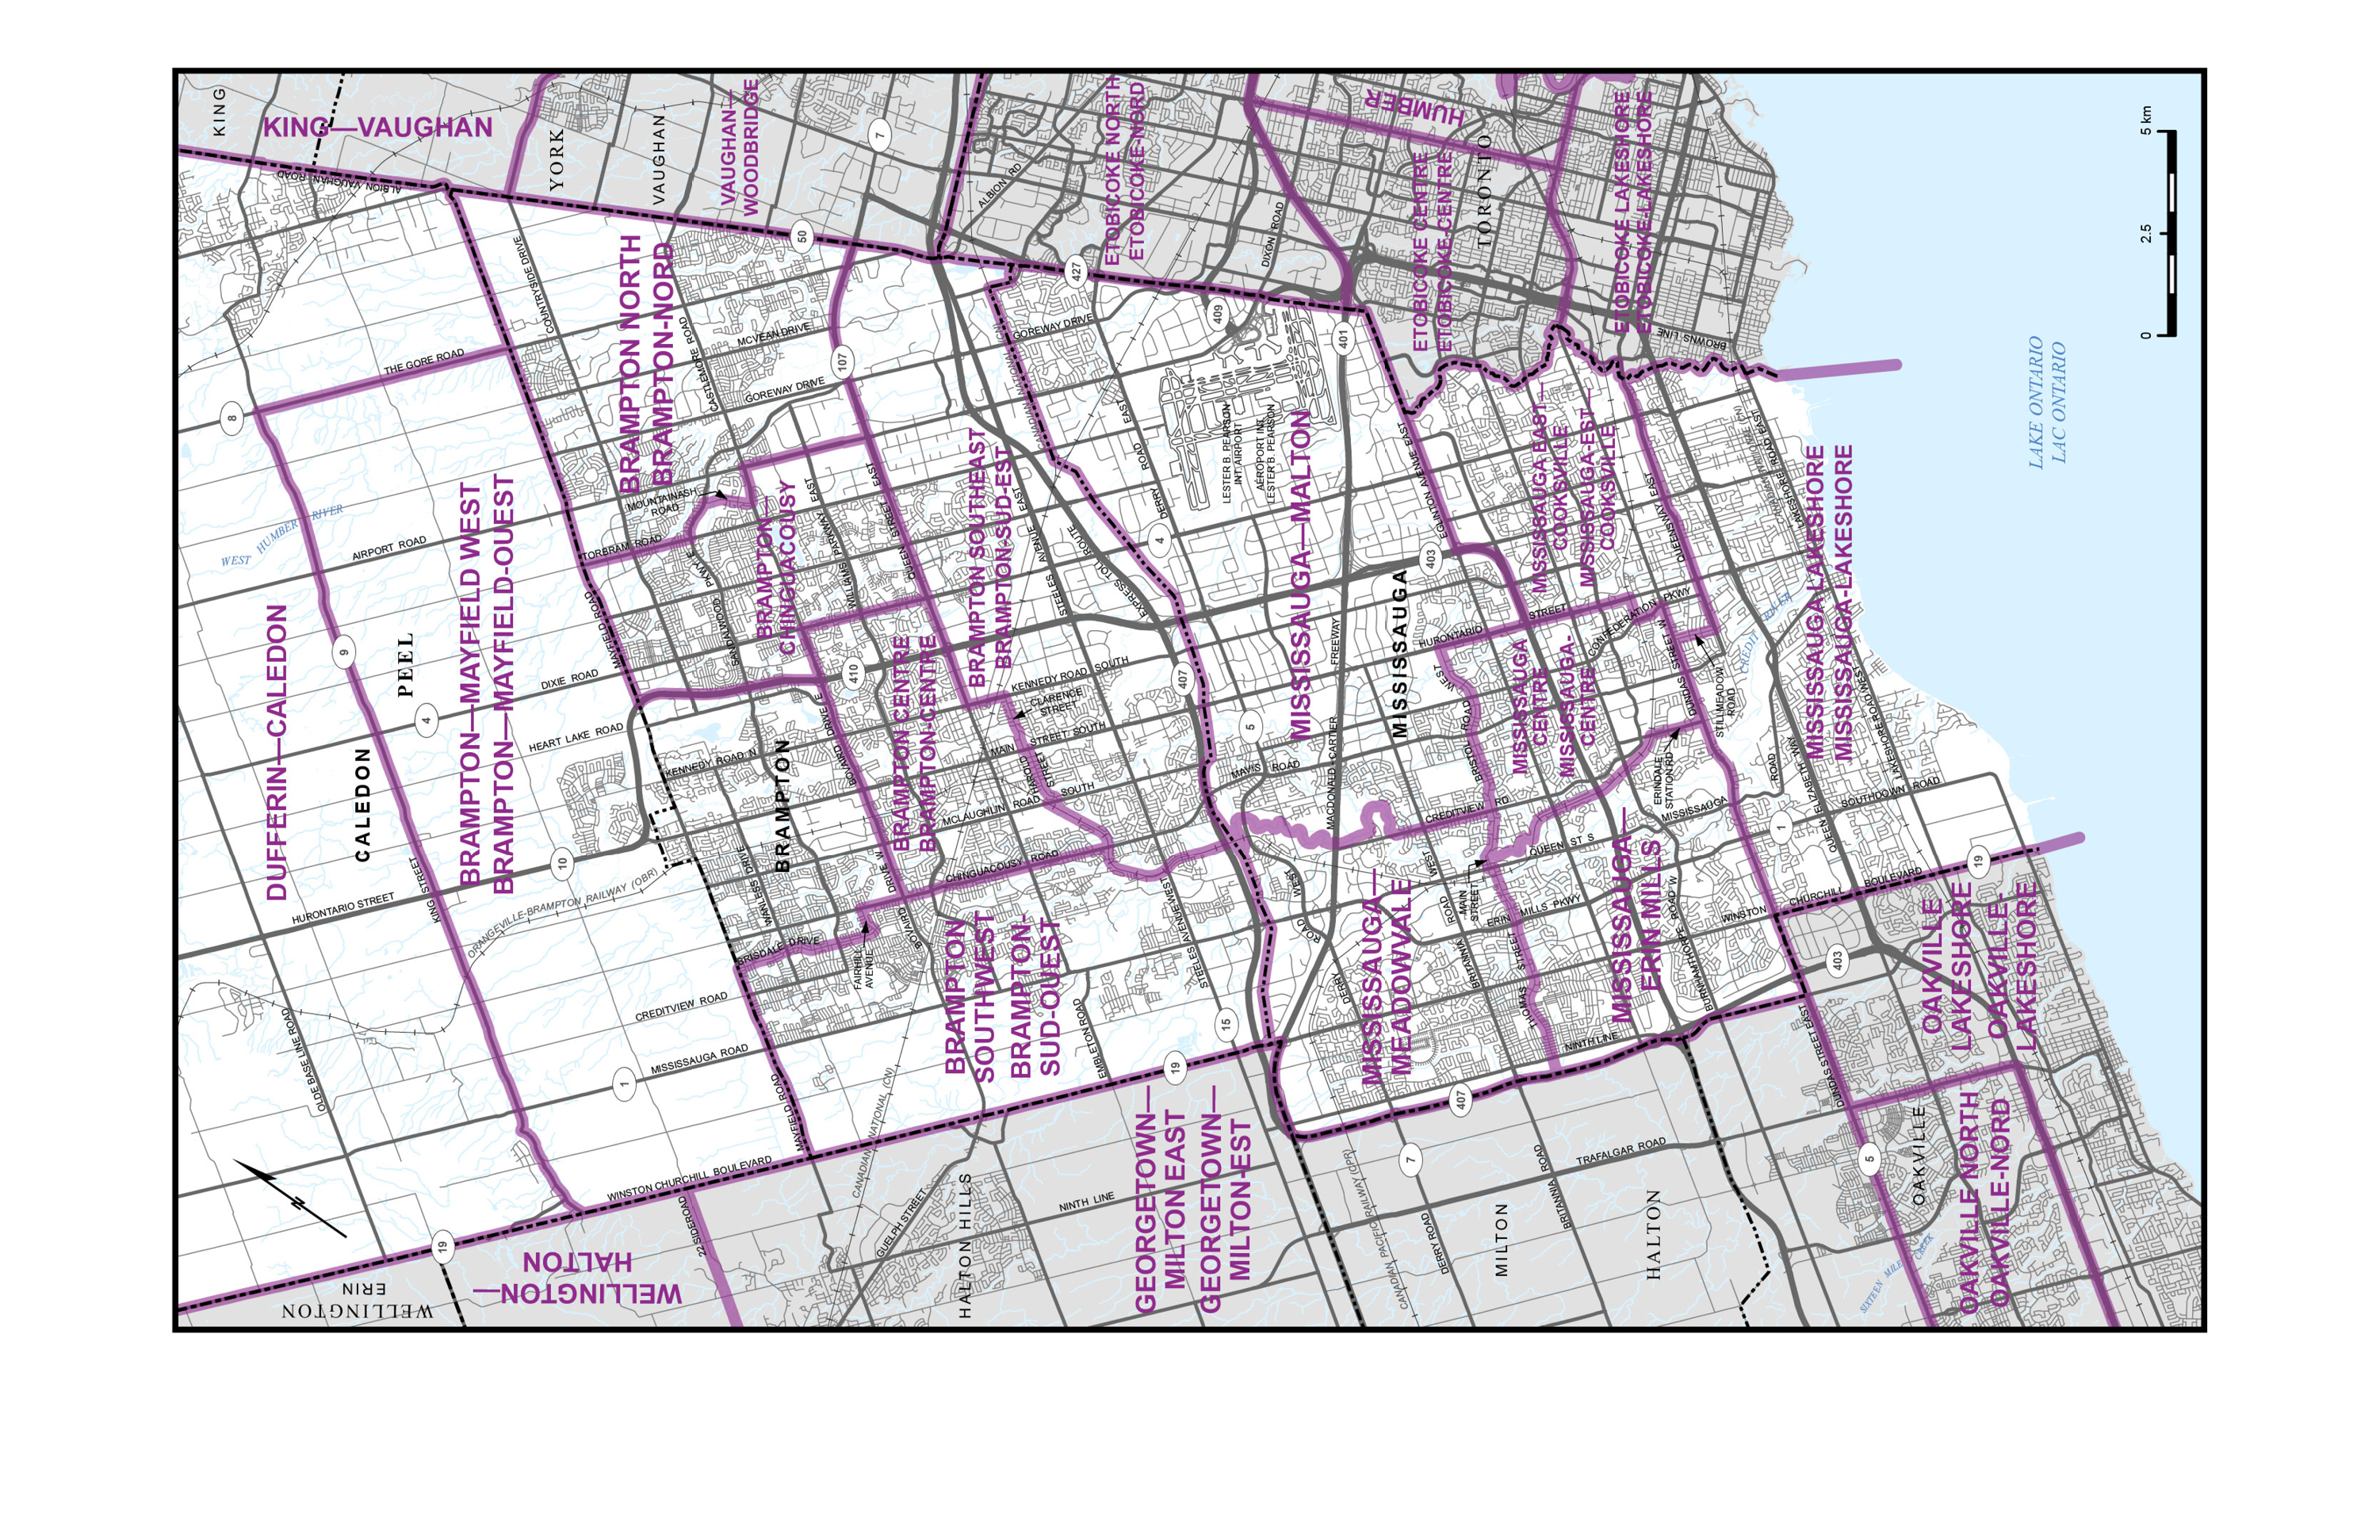
Map 18 – Cities of St. Catharines and Thorold
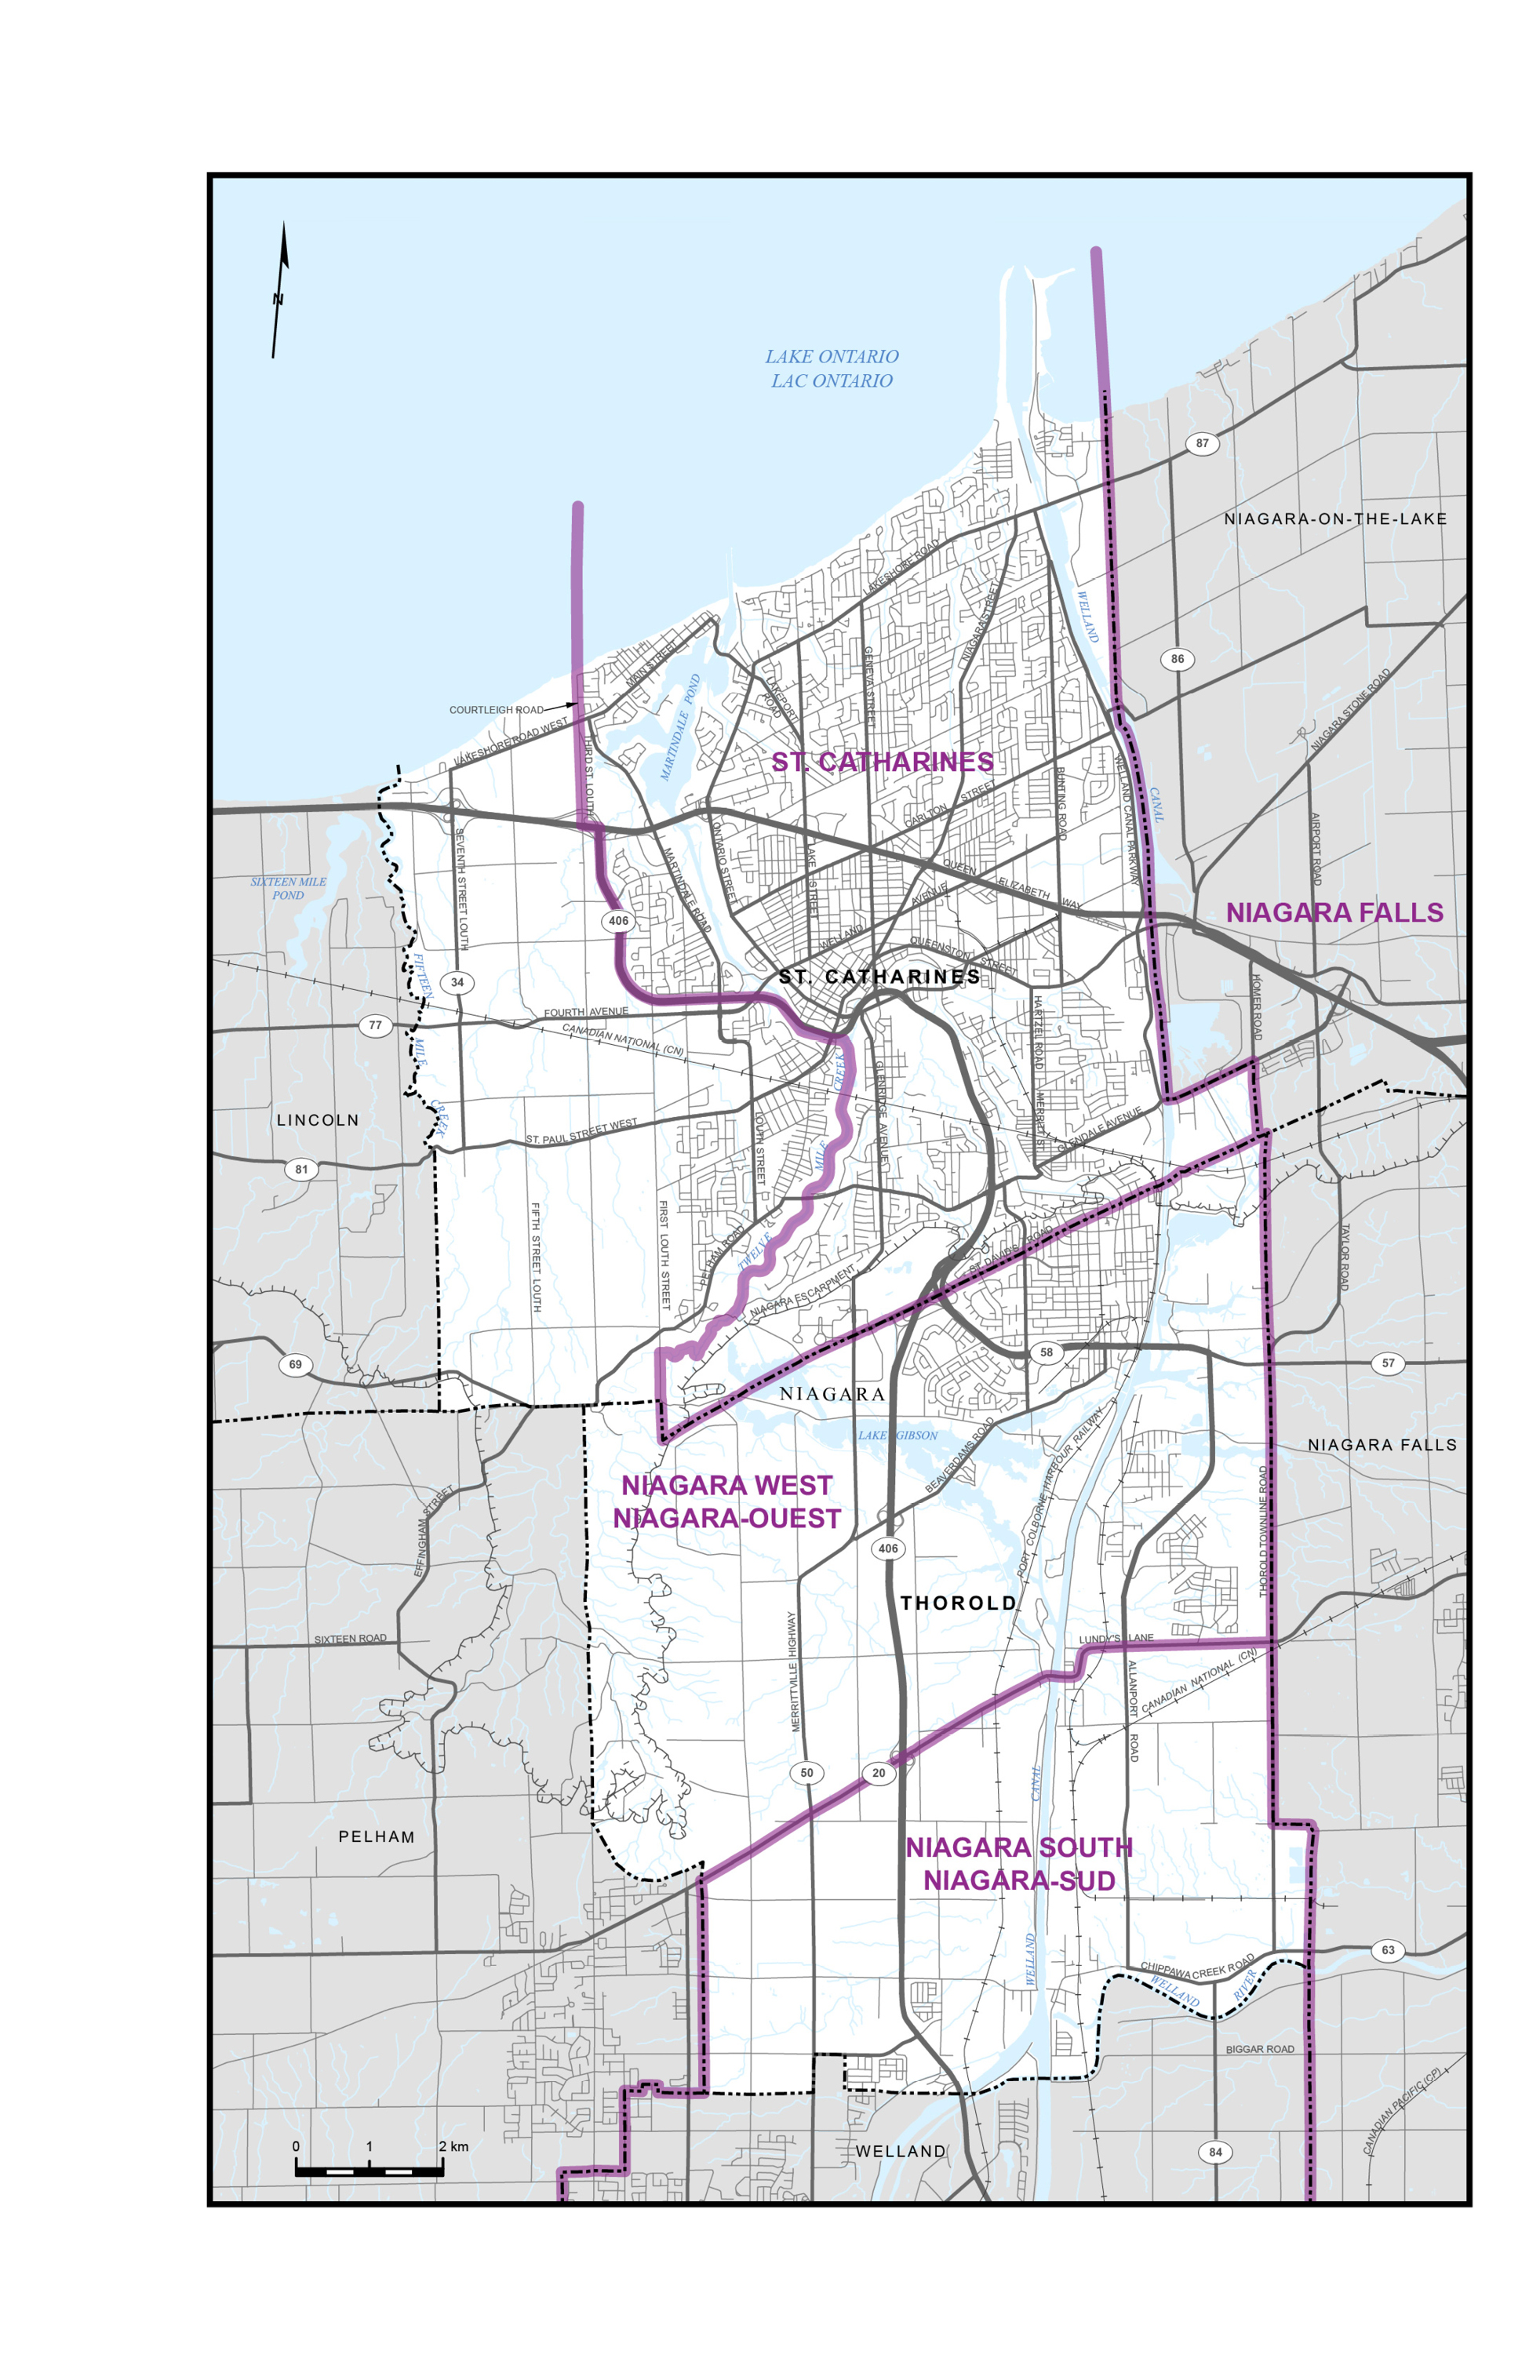
Map 19 – City of Thunder Bay
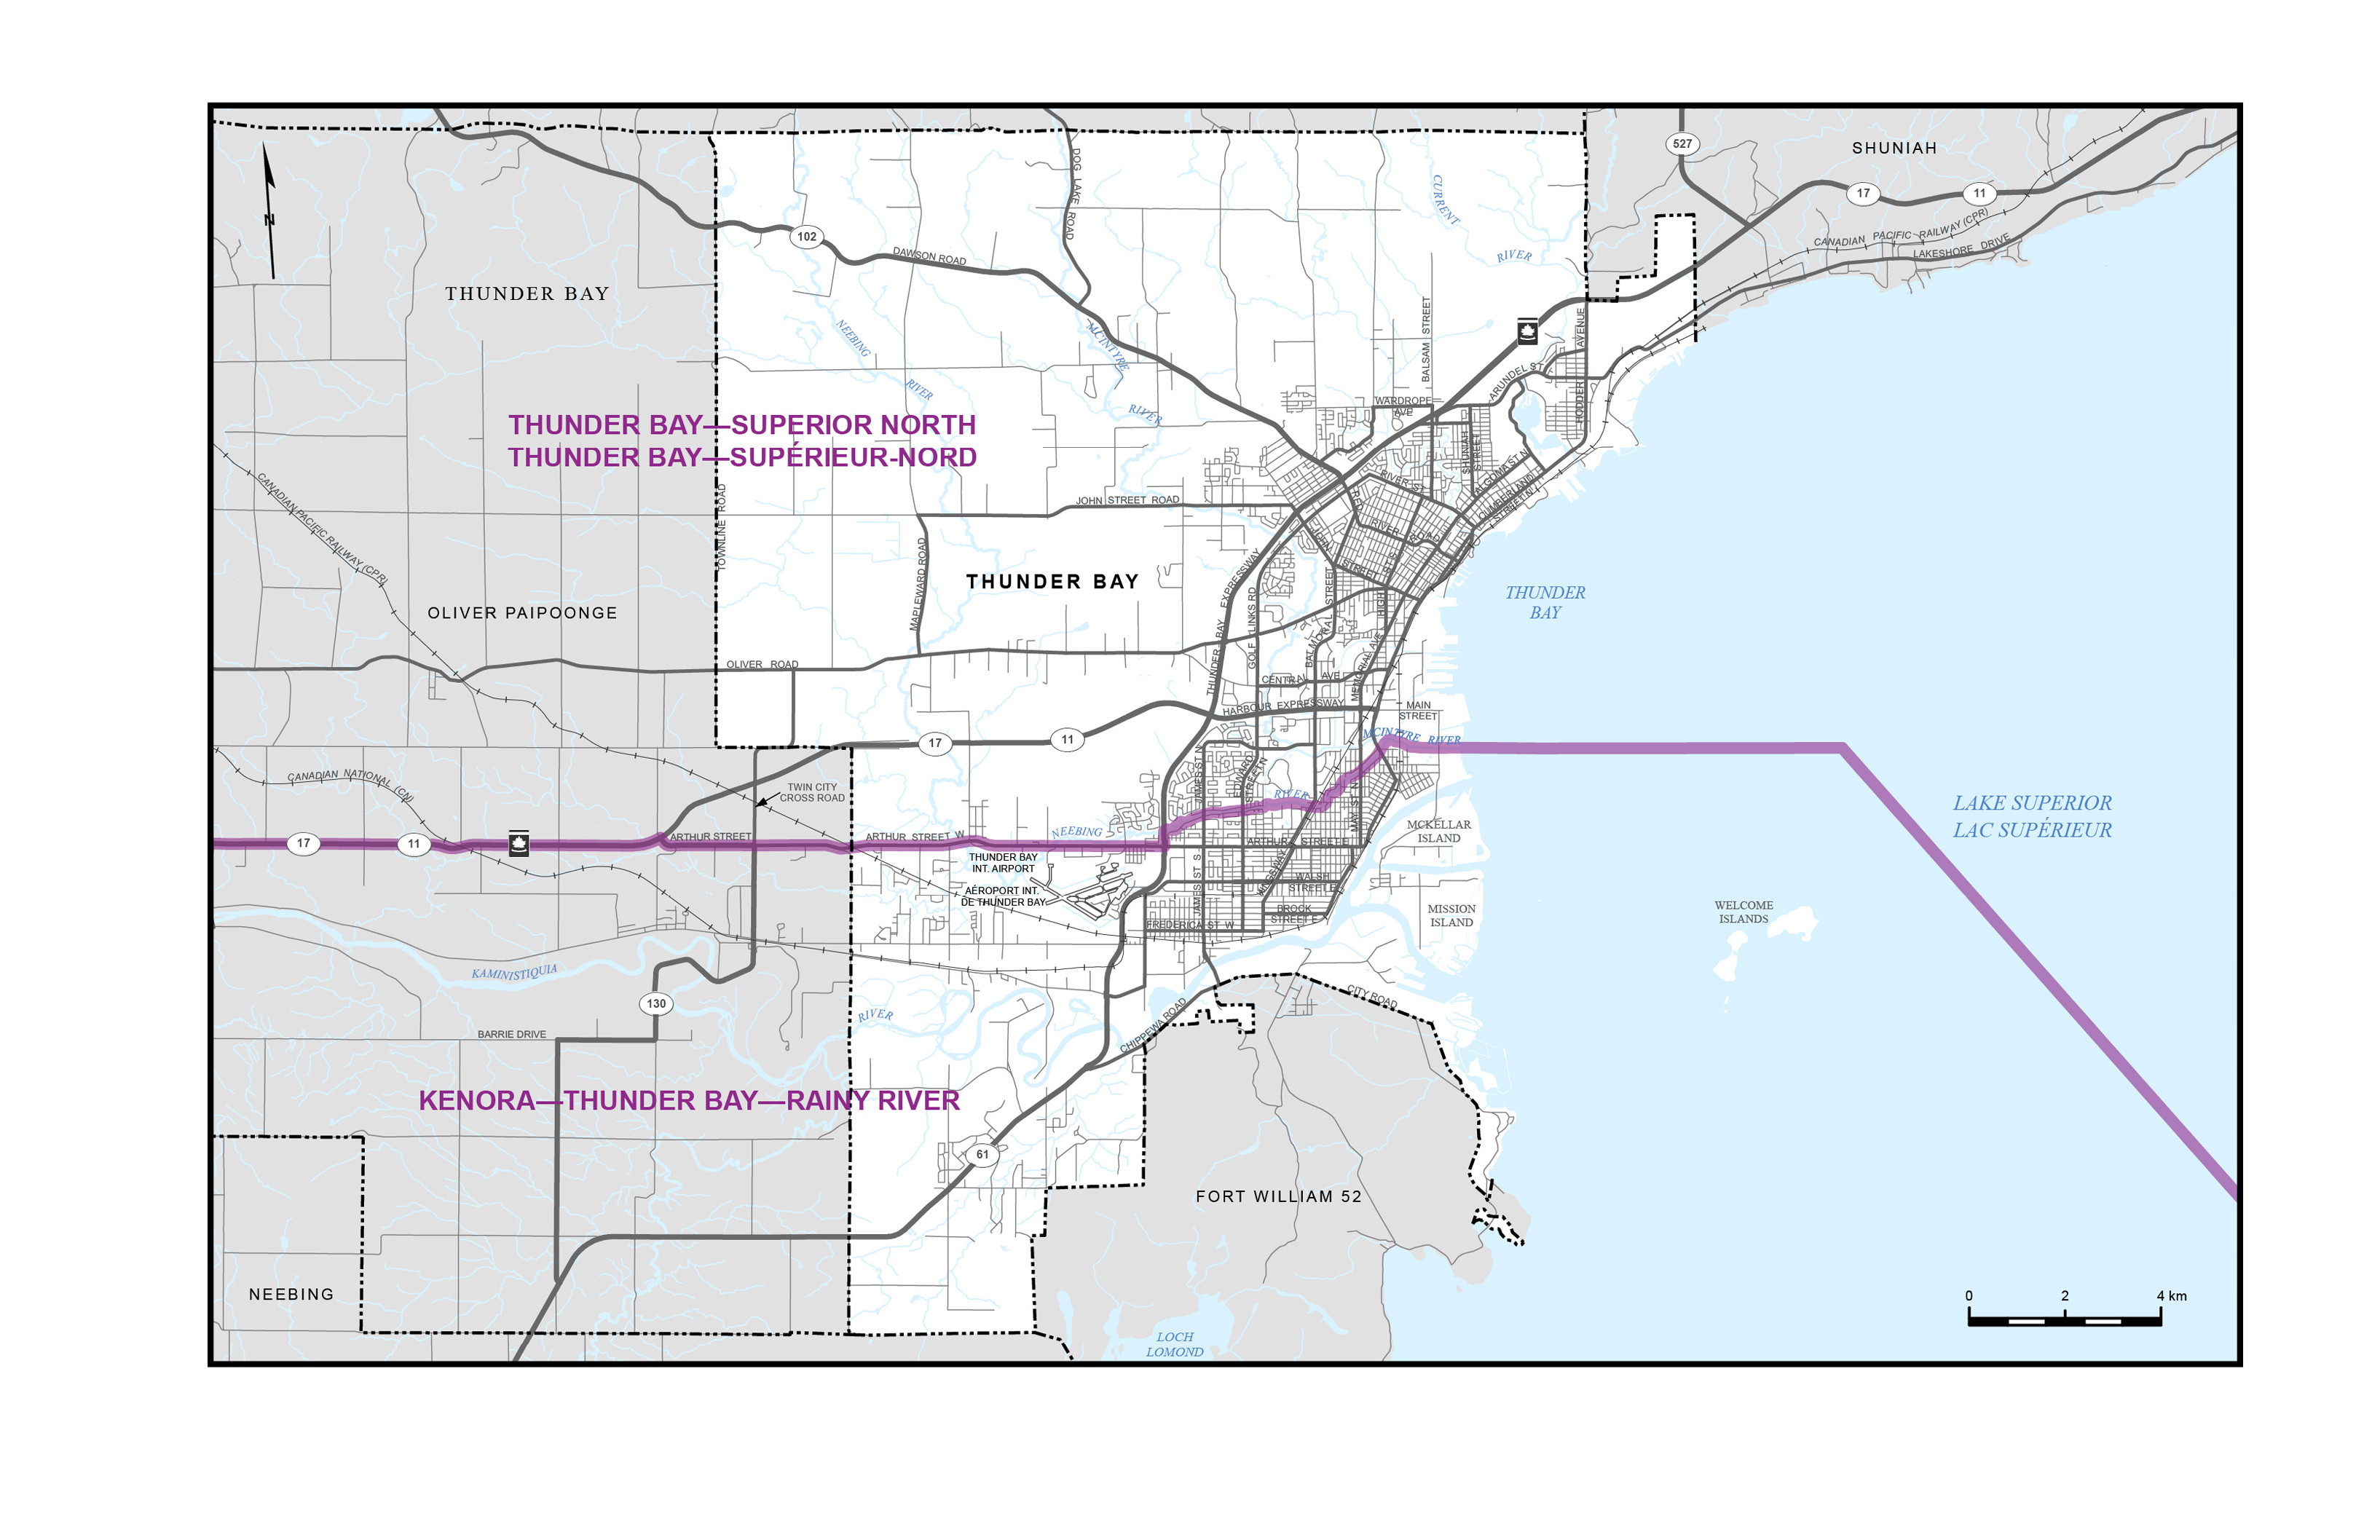
Map 20 – City of Toronto
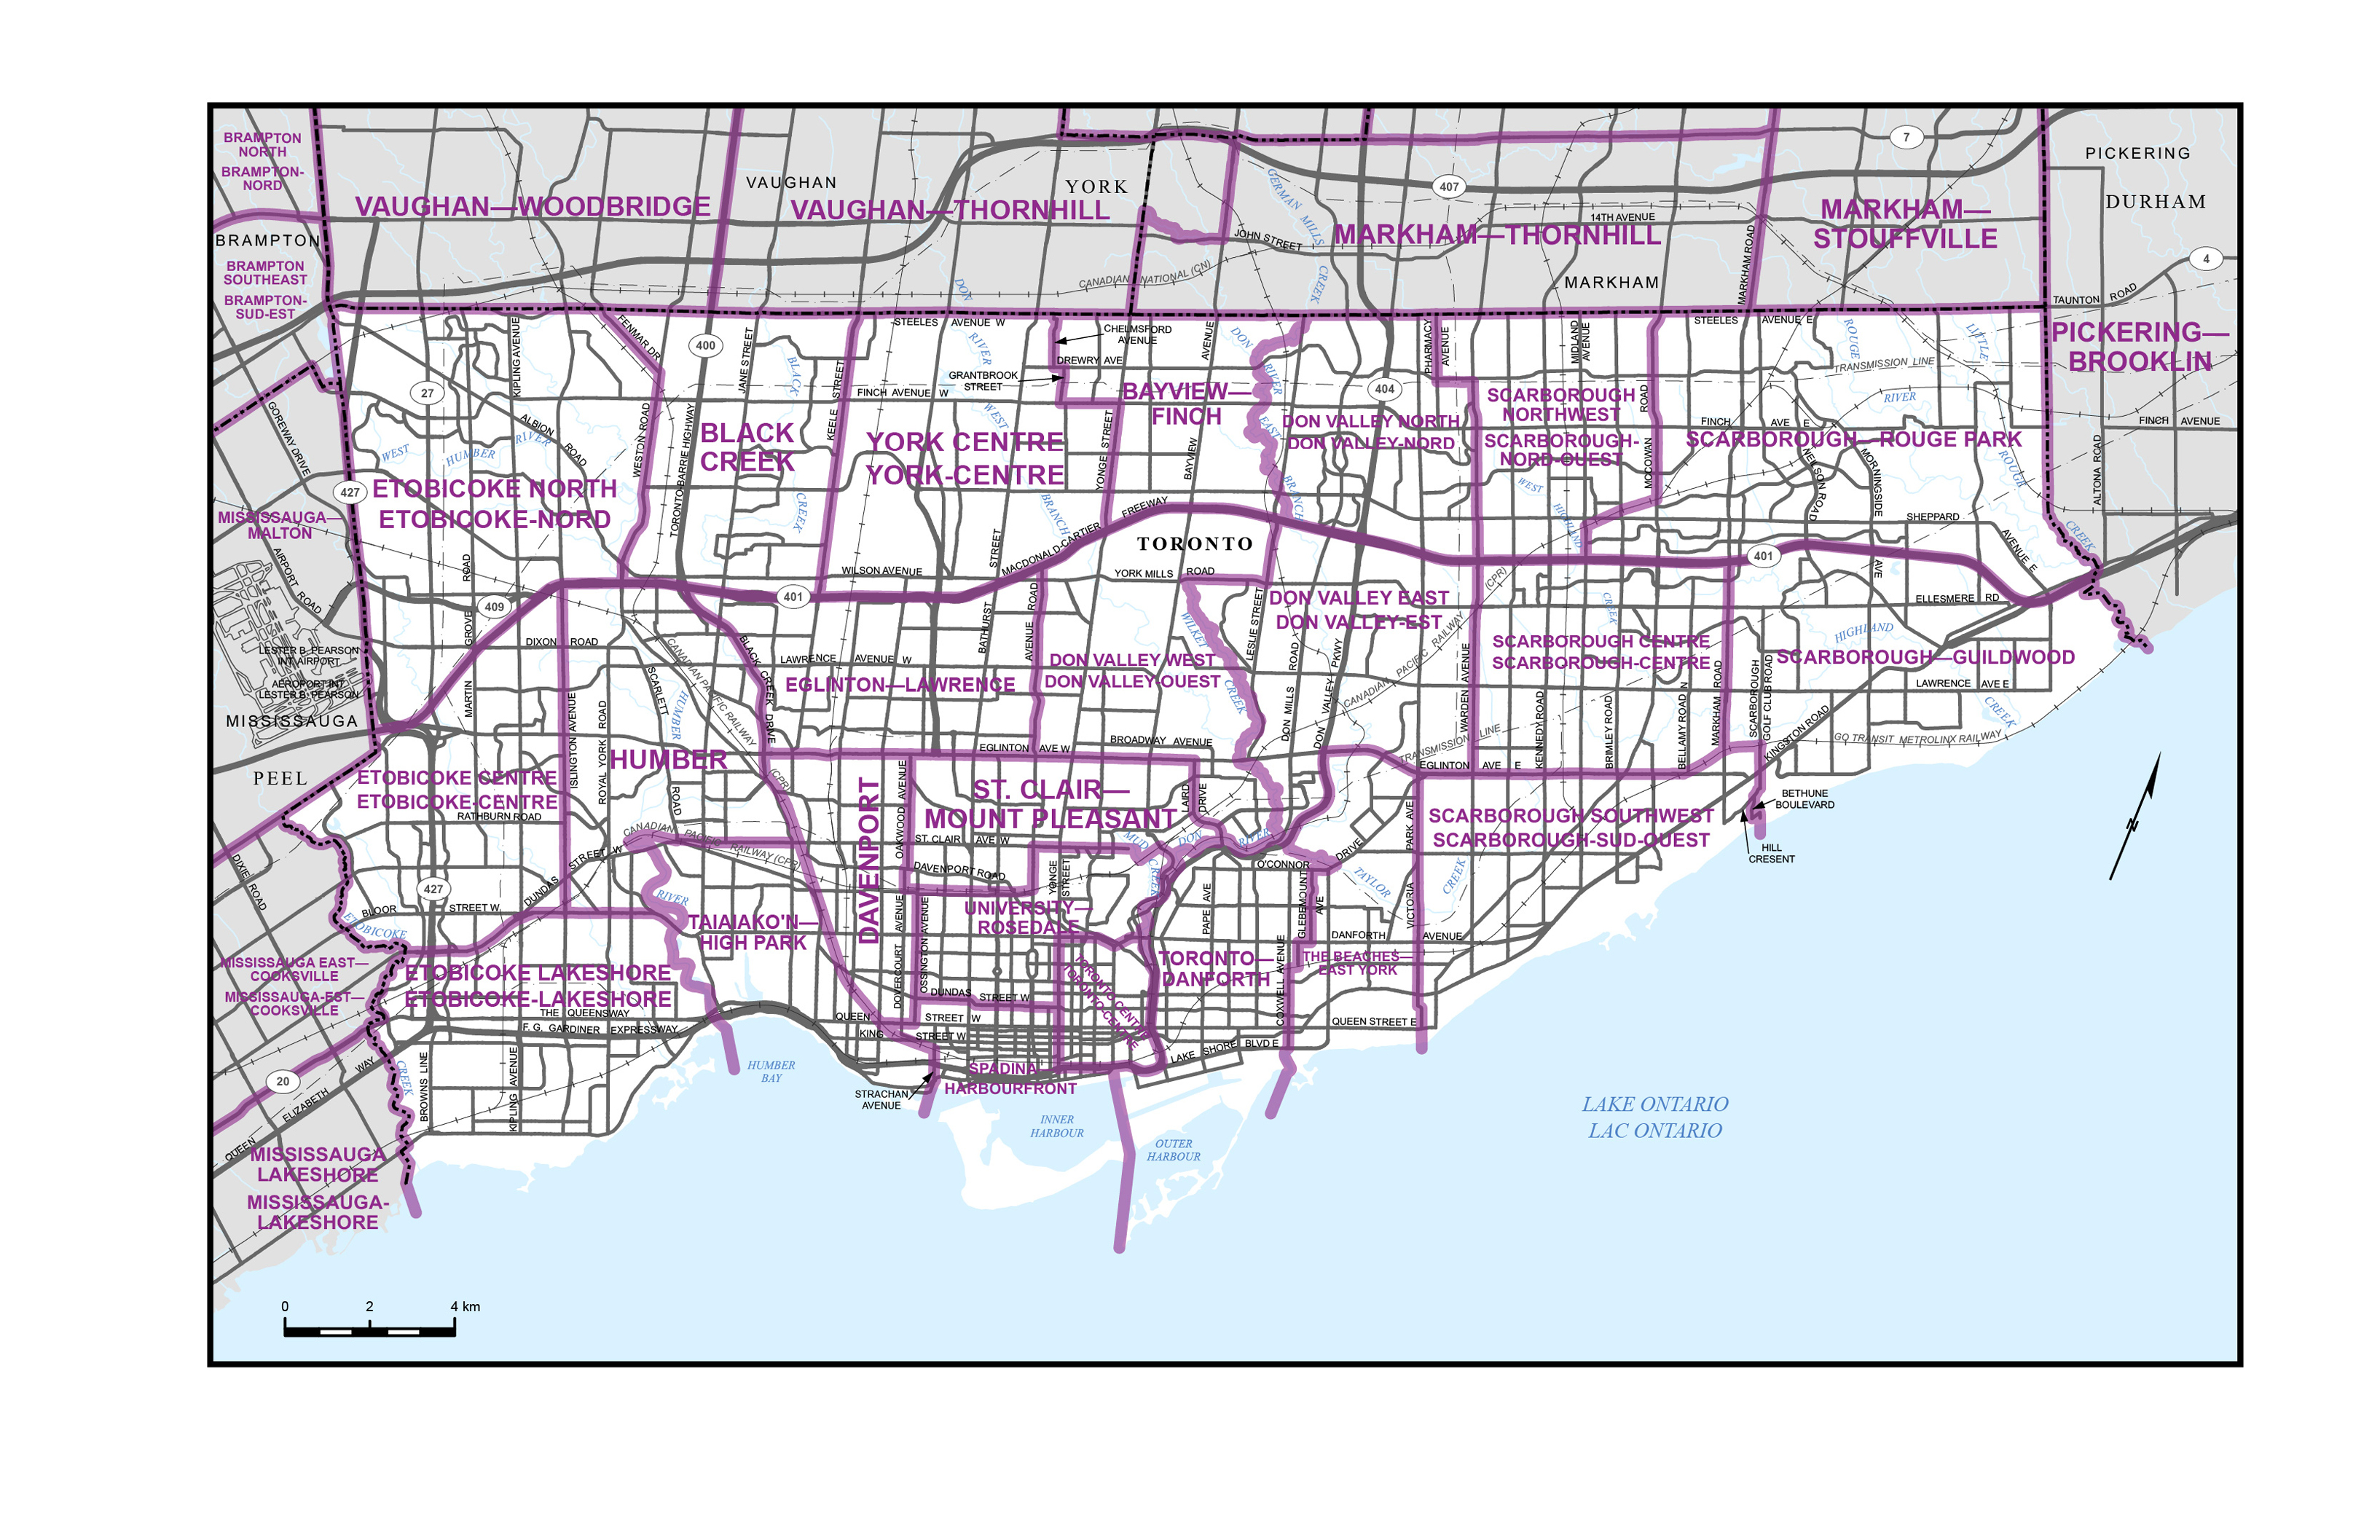
Map 21 – City of Windsor
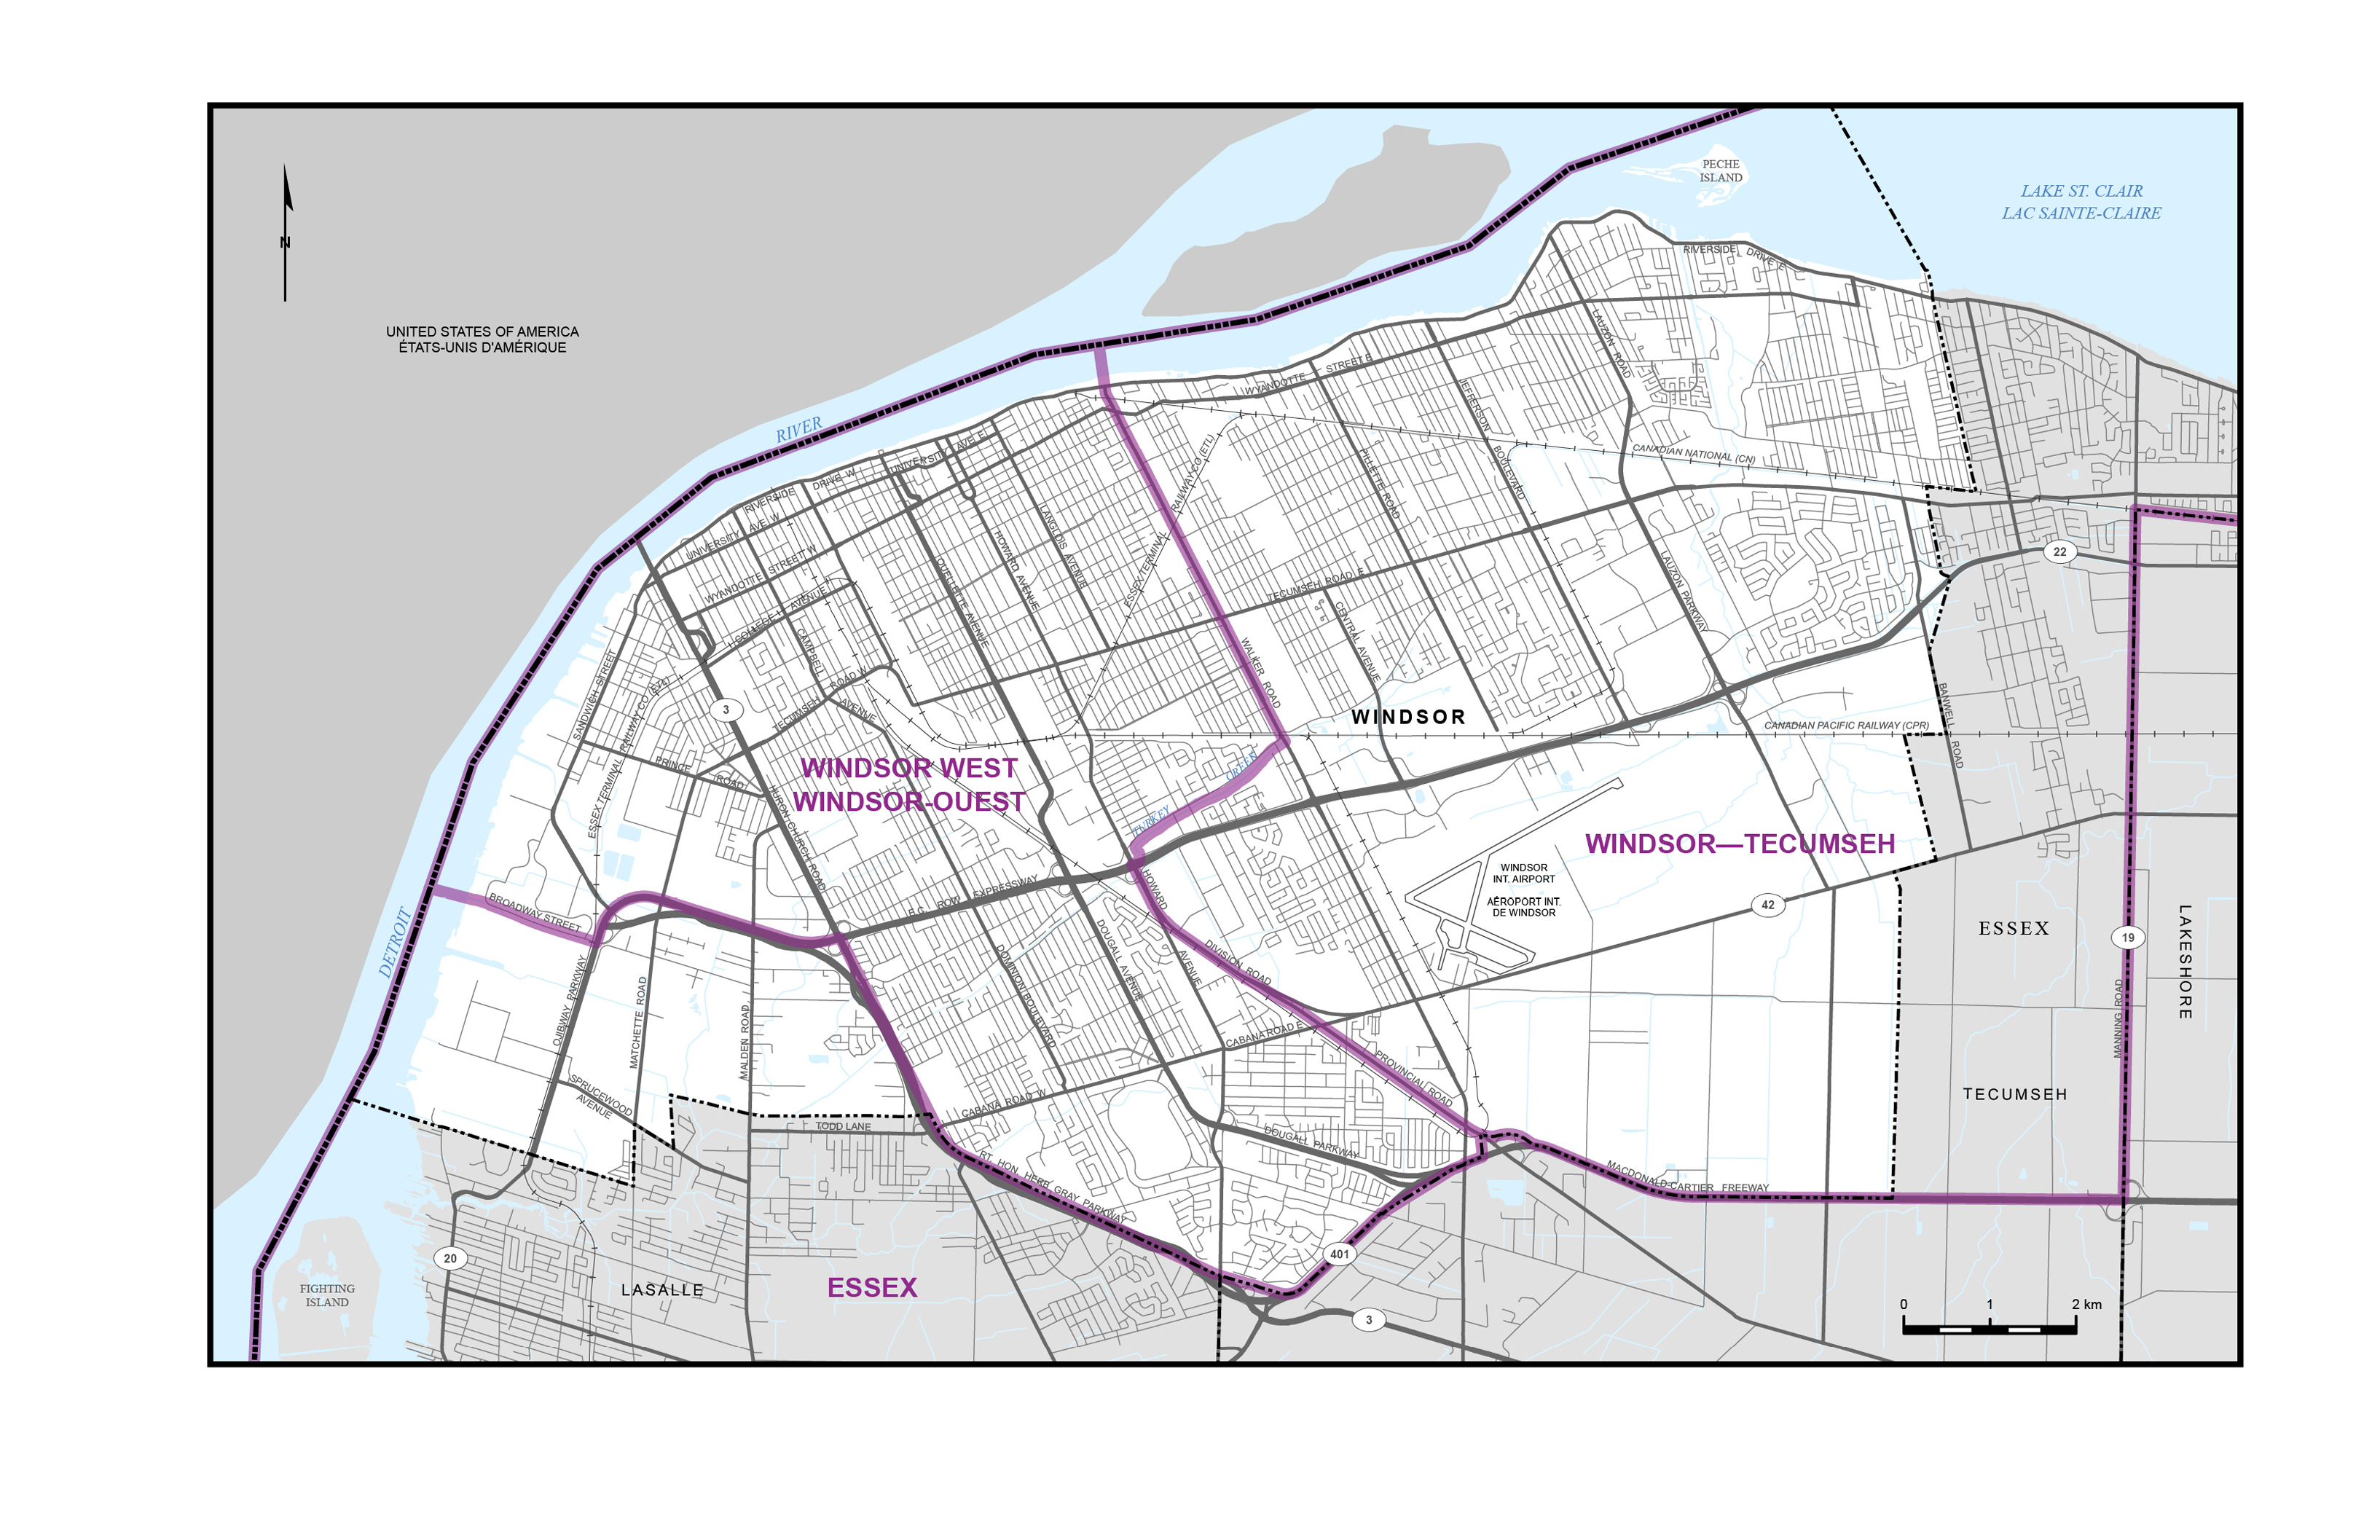
Map 22 – Regional Municipality of York (part)